. 2016 Feb 11:6:20944.
doi: 10.1038/srep20944.

Digital Sorting of Pure Cell Populations Enables Unambiguous Genetic Analysis of Heterogeneous Formalin-Fixed Paraffin-Embedded Tumors by Next Generation Sequencing

Affiliations

Digital Sorting of Pure Cell Populations Enables Unambiguous Genetic Analysis of Heterogeneous Formalin-Fixed Paraffin-Embedded Tumors by Next Generation Sequencing

Chiara Bolognesi et al. Sci Rep. .

Abstract

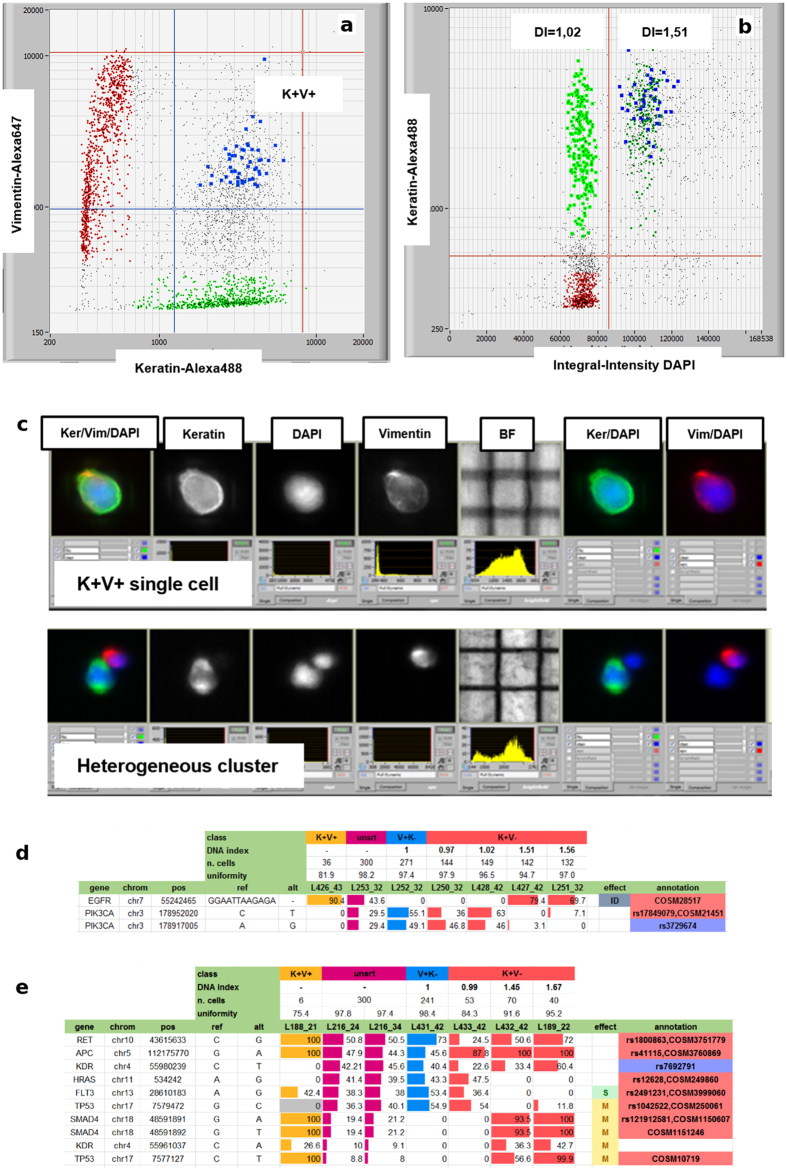
Precision medicine in oncology requires an accurate characterization of a tumor molecular profile for patient stratification. Though targeted deep sequencing is an effective tool to detect the presence of somatic sequence variants, a significant number of patient specimens do not meet the requirements needed for routine clinical application. Analysis is hindered by contamination of normal cells and inherent tumor heterogeneity, compounded with challenges of dealing with minute amounts of tissue and DNA damages common in formalin-fixed paraffin-embedded (FFPE) specimens. Here we present an innovative workflow using DEPArray™ system, a microchip-based digital sorter to achieve 100%-pure, homogenous subpopulations of cells from FFPE samples. Cells are distinguished by fluorescently labeled antibodies and DNA content. The ability to address tumor heterogeneity enables unambiguous determination of true-positive sequence variants, loss-of-heterozygosity as well as copy number variants. The proposed strategy overcomes the inherent trade-offs made between sensitivity and specificity in detecting genetic variants from a mixed population, thus rescuing for analysis even the smaller clinical samples with low tumor cellularity.


Figures

Figure 1
Figure 1
(a,b) H&E staining of paraffin sections from sample S10 (5% tumor cellularity) and S09 (40% tumor cellularity), respectively. Fifty μm sections or 0,6 mm diameter core punches were collected from FFPE tissue blocks. Paraffin sections taken from all samples were H&E stained to facilitate identification of the tumor area of interest. The slide was used to guide enrichment of carcinoma and carcinoma-associated stroma by trimming the normal epithelium and/or superfluous stromal tissue. Images were acquired using Leica DMA 600 B microscope, equipped with 10× objective and DFC280 camera. Abbreviations: S = stroma, T = tumor. (c) Schematic overview of the workflow used in the study.
Figure 2
Figure 2. DEPArray™ analysis and gating based on scatter plots, histogram and images.
(a) Simultaneous detection of two distinct cell populations based on antigen expression from a dissociated FFPE specimen by using the mean intensity keratin-Alexa488 vs vimentin-Alexa647 scatter plot. (b) After gating for the vimentin-positive (V + ) and keratin-positive (K + ) cell populations, single-parameter DNA histograms are generated. The V + fraction is used as an internal DNA-diploid reference for K + population DNA content assessment. (c) Images of individual events can be viewed on an image bar, allowing cells of interest to be identified and flagged for recovery.
Figure 3
Figure 3. Summary of variant frequencies and copy-number profiles obtained by low-pass whole genome sequencing in S01 patient, affected by an ovarian cancer.
(a) Only a subset of significant variants are displayed. Table shows variants in rows and cell populations in columns (unsrt, unsorted cells; V + K-DIx, stromal cells with mixed ploidy; K + V-DI = 1.7, tumor cells with a DNA index of 1.7 related to stromal peak; K + V-DIx, tumor cells with mixed DNA content). Variants for each cell population are represented by a cell box filled with different colors based on relative frequency: red for tumor, blue for stromal, magenta for unsorted. In the table header, information about number of cells and sequencing uniformity are present. The frequency patterns highlight different kind of variant events summarized in a colored box (column GVC, Genetic Variant Class): somatic homozygous variant (black), copy number gains (green), LOH (red), germline variants (ice), and background-noise (gray). In the right-side, the “eff” column describes gene/protein effect where missense mutations (M) are marked with a yellow square and splice variants (S) with a green square; empty cells means no protein effect (intron or synonymous variant). Variants annotated in COSMIC (C) and/or dbSNP (rs) databases are represented in “ann” column with respectively a red and blue box. (b) Whole-genome profiles (chr1-22) of stromal (top) and tumor (bottom) populations. Ploidy values are indicated in the y-axis, with the diploid state highlighted with a red dotted line; in the x-axis, the alternation of different chromosomes are plotted with different colors. Thanks to information given by DNA index, tumor profile is centered on ploidy = 3, as opposite to diploid stromal profile. (c) CNV profiles of specific chromosomes were enlarged to better display the copy-number of specific genes that experience, according to targeted panel data (Fig. 3a), LOH and CNV events. At the bottom of the x-axis, the chromosome number is indicated.
Figure 4
Figure 4. Evaluation of method applicability in relation to sample age and cell number limits.
(a) Histogram showing the percentage of failed libraries in relation with samples and storage years (dark blue = failed library). (b) Analysis of coverage uniformity versus number of cells recovered. (c) Distribution of allele frequencies of “singleton” variants per bins of 20 cells. Red dashed line shows the 10% frequency threshold.
Figure 5
Figure 5. DNA content categories from cells suspension derived from FFPE lung tumor based on multi-parametric analysis.
(a,b) DNA content histogram show a DNA diploid peak after gating of the V + K cell fraction. K + V- population shows a DNA histogram containing two DNA fractions: a DNA diploid fraction with a DNA index of 0.97 and an hyperdiploid fraction with a DNA index of 1.56. (c) DNA-content distribution of cell recoveries. The dots with the same color represent an homogenous cell type, green (K + V- DI = 0.97), dark-green (K + V- DI = 1.56) and red (V + K- DNA diploid). (d) Sample S09 frequency profiles show different mutational profiles between stromal, DNA diploid and DNA aneuploid tumor populations. Across the loci displayed (one SNP and two somatic mutations), the DNA aneuploid tumor has a much higher frequency value than the diploid tumor population. SG = stop_gain, M = missense. The variants of the diploid K + V- population (DI = 0,96) confirm its tumor origin.
Figure 6
Figure 6. Isolation and genetic analysis of double-positive cells.
(a) Identification of cells recovered from K + V + population in lung carcinoma sample S11 (blue dots). (b) DNA content histogram shows that K + V + cells overlay the DNA aneuploid of the K + V- fraction in the integral intensity DAPI versus keratin dot plot. (c) Co-localization of antigens within the same cell is clearly distinguished from heterogeneous clusters. (d) Sample S11 variant frequencies highlight a common profile between stromal and diploid K + V- fraction, and between tumor DNA aneuploid and double-positive replicates. ID = in-frame deletion. e) Sample S10: TP53, KDR and SMAD4 somatic mutations confirms K + V + recovery comprises tumor cells. S = splice-site, M = missense.

References

    1. Frampton G. M. et al.. Development and validation of a clinical cancer genomic profiling test based on massively parallel DNA sequencing. Nat. Biotechnol. 31, 1023–1031 (2013). - PMC - PubMed
    1. Abkevich V. et al.. Patterns of genomic loss of heterozygosity predict homologous recombination repair defects in epithelial ovarian cancer. Br. J. Cancer 107, 1776–1782 (2012). - PMC - PubMed
    1. Hovelson D. H. et al.. Development and validation of a scalable next-generation sequencing system for assessing relevant somatic variants in solid tumors. Neoplasia 17, 385–399 (2015). - PMC - PubMed
    1. Do H. & Dobrovic A. Sequence artifacts in DNA from formalin-fixed tissues: causes and strategies for minimization. Clin. Chem. 61, 64–71 (2015). - PubMed
    1. Wong S. Q. et al.. Sequence artefacts in a prospective series of formalin-fixed tumours tested for mutations in hotspot regions by massively parallel sequencing. BMC Med Genomics 7, 23 (2014). - PMC - PubMed

MeSH terms