. 2016 May 12;127(19):2298-309.
doi: 10.1182/blood-2015-08-664631. Epub 2016 Feb 10.

Analysis of Jak2 signaling reveals resistance of mouse embryonic hematopoietic stem cells to myeloproliferative disease mutation

Affiliations

Analysis of Jak2 signaling reveals resistance of mouse embryonic hematopoietic stem cells to myeloproliferative disease mutation

Maria I Mascarenhas et al. Blood. .

Abstract

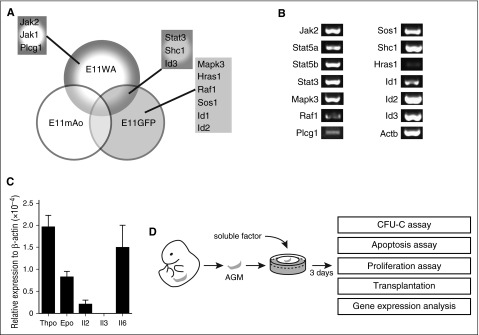
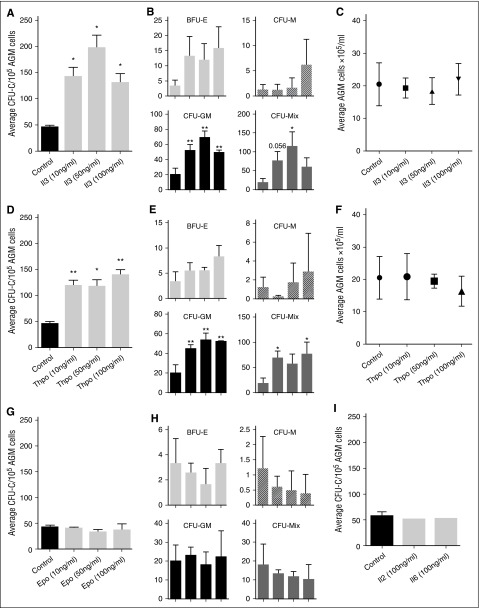
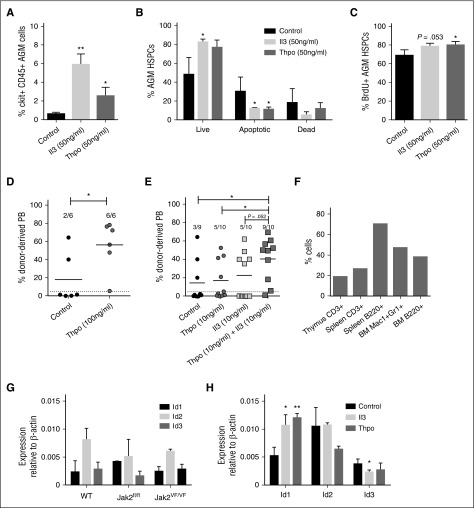
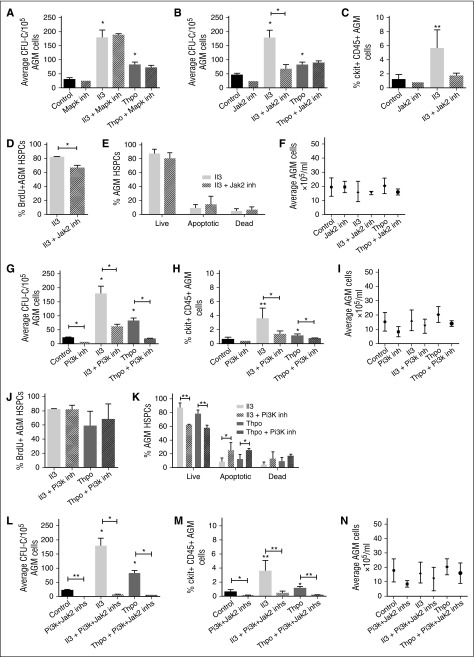
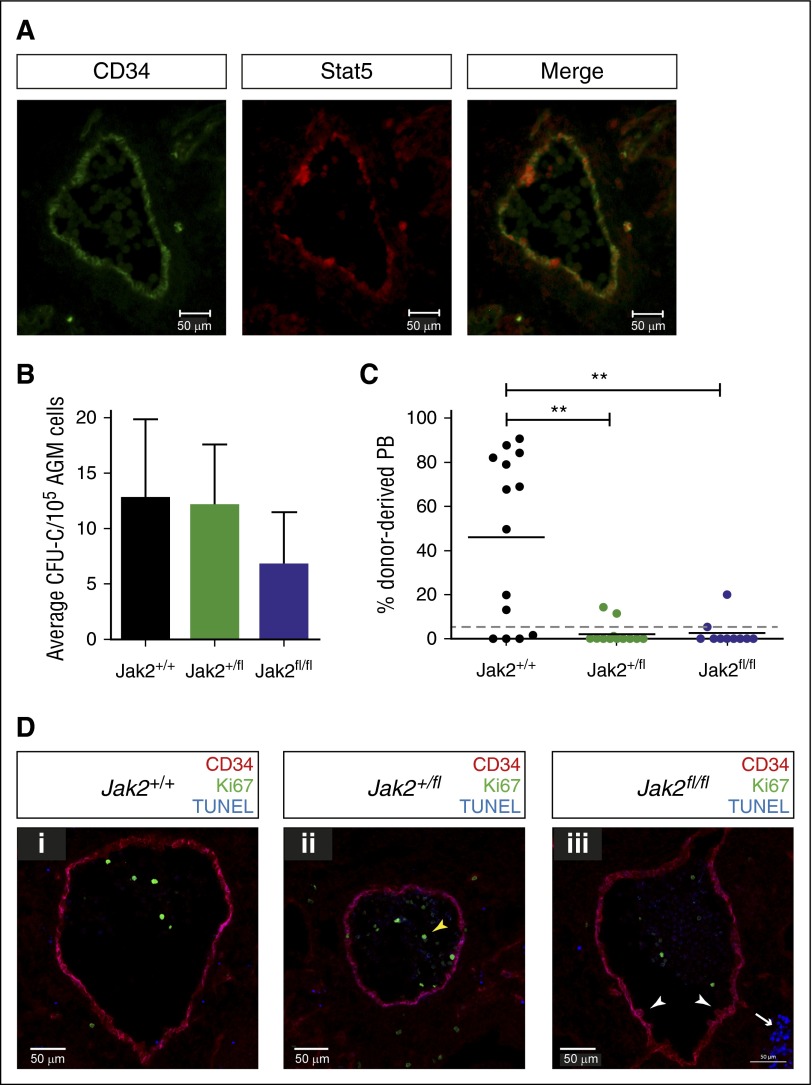
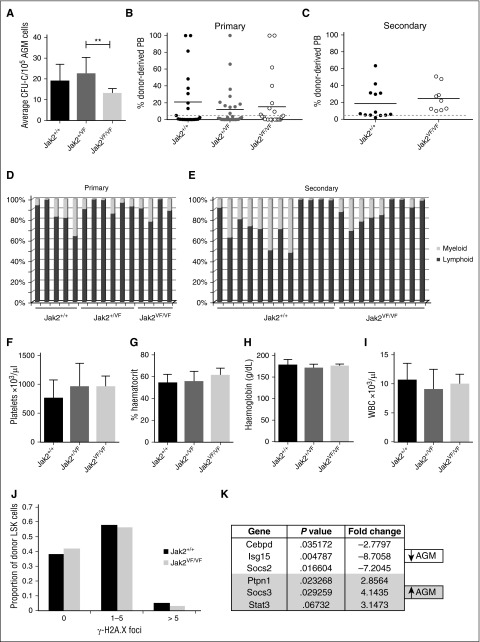
The regulation of hematopoietic stem cell (HSC) emergence during development provides important information about the basic mechanisms of blood stem cell generation, expansion, and migration. We set out to investigate the role that cytokine signaling pathways play in these early processes and show here that the 2 cytokines interleukin 3 and thrombopoietin have the ability to expand hematopoietic stem and progenitor numbers by regulating their survival and proliferation. For this, they differentially use the Janus kinase (Jak2) and phosphatidylinositol 3-kinase (Pi3k) signaling pathways, with Jak2 mainly relaying the proproliferation signaling, whereas Pi3k mediates the survival signal. Furthermore, using Jak2-deficient embryos, we demonstrate that Jak2 is crucially required for the function of the first HSCs, whereas progenitors are less dependent on Jak2. The JAK2V617F mutation, which renders JAK2 constitutively active and has been linked to myeloproliferative neoplasms, was recently shown to compromise adult HSC function, negatively affecting their repopulation and self-renewal ability, partly through the accumulation of JAK2V617F-induced DNA damage. We report here that nascent HSCs are resistant to the JAK2V617F mutation and show no decrease in repopulation or self-renewal and no increase in DNA damage, even in the presence of 2 mutant copies. More importantly, this unique property of embryonic HSCs is stably maintained through ≥1 round of successive transplantations. In summary, our dissection of cytokine signaling in embryonic HSCs has uncovered unique properties of these cells that are of clinical importance.


Figures

Figure 1
Figure 1
Cytokine signaling pathways are active in the AGM. (A) Components of cytokine signaling pathways found to be upregulated in the E11 dorsal aorta (E11WA), in E11 Ly6A-GFP+ cells (E11GFP), and in the middle part of the dorsal aorta (E11mAo) by expression profiling. (B) Confirmation of signaling component expression by semiquantitative RT-PCR analysis in the AGM region. (C) Analysis of cytokine expression in the E11 AGM by qPCR; n = 3. (D) Schematic diagram of experimental setup.
Figure 2
Figure 2
Il3 and Thpo expand hematopoietic progenitor cells. (A) Recombinant mouse Il3 was added to AGM explant cultures at the indicated concentrations. Three days later, cells were plated in methylcellulose, and total colonies were counted after 7 days. n = 3. (B) Total colonies separated into the different colony types. (C) Average number of total AGM cells obtained after 3 days of explant culture in the presence or absence of Il3. (D) Recombinant mouse Thpo was added to AGM explant cultures at the indicated concentrations. Three days later, cells were plated in methylcellulose, and total colonies were counted after 7 days. n = 3. (E) Total colonies separated into the different colony types. (F) Average number of total AGM cells obtained after 3 days of explant culture in the presence or absence of Thpo. (G) Recombinant mouse Epo was added to AGM explant cultures at the indicated concentrations. Three days later, cells were plated in methylcellulose, and total colonies were counted after 7 days. n = 3. (H) Total colonies separated into the different colony types. (I) Recombinant mouse Il2 or Il6 was added to AGM explant cultures at 100 ng/mL. Three days later, cells were plated in methylcellulose, and total colonies were counted after 7 days. n = 3.
Figure 3
Figure 3
Il3 and Thpo have prosurvival and proproliferation effects and can expand HSCs. (A) The number of ckit+CD45+ AGM cells recovered after 3 days of explant culture in the presence or absence of Il3 or Thpo. (B) The percentage of live (7AADAnnexin V), early apoptotic (7AADAnnexin V+), and dead (7AAD+Annexin V+) cells within the ckit+CD45+ population was determined. n = 3. (C) The percentage of proliferating cells that had incorporated BrdU during the last night of explant culture was determined within the ckit+CD45+ population. n = 3. (D) Repopulation levels of individual mice injected with AGM cells (0.1-0.3 embryo equivalents) explant-cultured in the presence or absence of Thpo. Dotted line represents 5% threshold. The number of positive mice out of total injected mice is indicated at the top. (E) Repopulation levels of individual mice injected with AGM cells explant-cultured in the presence or absence of Il3 and/or Thpo. Dotted line represents 5% threshold. The number of positive mice out of total injected mice is indicated at the top. (F) Multilineage analysis of donor cell contribution in one mouse highly repopulated with AGM cells cultured in the presence of Il3 and Thpo. (G) HSPCs (ckit+CD45+CD41intermediate) were sorted from uncultured AGMs of the indicated genotypes and analyzed by qPCR for Id gene expression. n = 3. (H) AGMs were cultured in the presence or absence of 100 ng/mL Il3 or Thpo, and ckit+CD45+CD41intermediate cells were sorted and then analyzed for the expression of Id1, Id2, or Id3 by quantitative real-time PCR analysis. n = 3. **P < .01, *P < .05.
Figure 4
Figure 4
Il3 and Thpo signal through the Jak2 and/or Pi3k pathways. AGMs were cultured as explants in the absence or presence of Il3 or Thpo (50 ng/mL) and/or (A) Mapk inhibitor (U0126; 5 μM), (B) Jak2 inhibitor (TG101348; 3 μM), (G) Pi3k inhibitor (LY294002; 14 μM), or (L) Jak2 inhibitor + Pi3k inhibitor for 3 days and then plated in methylcellulose. Colonies were scored 7 days later. n = 3. Alternatively, (C,H,M) the percentage of ckit+CD45+ at the end of the culture was determined, and the percentage of (D,J) BrdU+ cells or (E,K) live, apoptotic, and dead cells within this population. (F,I,N) The total number of cells recovered at the end of the each explant culture was also counted. n = 3; **P < .01, *P < .05.
Figure 5
Figure 5
Jak2 signaling is required for HSC production in the AGM. (A) Cryosections (10 μM) were prepared from E11.5 embryos and stained with antibodies against CD34 and total Stat5 as indicated (ventral down). Pictures were taken with a Zeiss AxioSkop2 wide-field microscope (objective 20×/045 NA) fitted with a Zeiss AxioCam MRc5, and images were analyzed with the Zeiss AxioVision software. (B) E11.5 AGM cells from embryos with the indicated genotypes were directly plated in methylcellulose, and colonies were counted 7 days later. n = 3 for Jak2+/+; n = 4 for Jak2+/fl; n = 3 for Jak2fl/fl. (C) E11.5 AGM cells from embryos with the indicated genotypes were directly transplanted as 1 embryo equivalent, and donor cell contribution to the peripheral blood of the recipients was determined at 4 months. Dotted line represents 5% threshold. Fourteen recipients for Jak2+/+; 13 recipients for Jak2+/fl; 10 recipients for Jak2fl/fl. **P < .01. (D) Cryosections (10 μM) were prepared from (i) E11.5 Jak2+/+, (ii) Jak2+/fl, and (iii) Jak2fl/fl embryos and stained with antibodies against CD34 and Ki67, together with TUNEL staining as indicated (ventral down). n = 2 for each genotype; 16 to 21 sections were analyzed per genotype. Pictures were taken with a Zeiss Axio Imager Microscope (objective 40×) fitted with a Hammatsu Flash 4 V2 sCMOS camera, and images were analyzed with the Zen software.
Figure 6
Figure 6
AGM HSCs are unaffected by the JAK2V617F mutation. (A) E11.5 AGM cells from embryos with the indicated genotypes were directly plated in methylcellulose, and colonies were counted 7 days later. n = 5 for Jak2+/+; n = 9 for Jak2+/VF; n = 4 for Jak2VF/VF. **P < .01. (B) E11.5 AGM cells from embryos with the indicated genotypes were directly transplanted as 1 embryo equivalent, and donor cell contribution to the peripheral blood of the recipients was determined at 4 months. Dotted line represents 5% threshold. Twenty-one recipients for Jak2+/+; 28 recipients for Jak2+/VF; 24 recipients for Jak2VF/VF. (C) Secondary transplants were performed with total BM cells from 3 primary recipients of Jak2+/+ AGM cells and 2 primary recipients of Jak2VF/VF AGM cells. Two to 3 million total BM cells were injected per secondary recipient with the amount adjusted to the repopulation levels in the primary recipient. Donor cell contribution to the peripheral blood was determined at 4 months after transplantation. Dotted line represents 5% threshold. Thirteen recipients for Jak2+/+; 9 recipients for Jak2VF/VF. Donor contribution within individual (D) primary and (E) secondary recipients was analyzed with respect to myeloid and lymphoid proportion. (F-I) Blood counts were performed on primary recipients at 4 months after transplantation. Error bars indicate standard deviation. (J) Donor LSK cells were sorted from secondary recipients of Jak2+/+ and Jak2VF/VF AGMs and stained for γ-H2A.X foci. The number of foci were counted in 200 to 300 cells per genotype. n = 2. (K) cDNA was prepared from sorted wild-type AGM HSCs (ckit+CD34+CD45+) and wild-type BM HSCs (CD45+CD48CD150+EPCR+) and analyzed for the expression of Jak-Stat pathway components using the Qiagen Jak/Stat Signaling Pathway RT2 Profiler PCR Array. Differentially expressed genes with P < .05 and a fold change >2 are shown. n = 3.

Comment in

Similar articles

Cited by

References

    1. Ciau-Uitz A, Monteiro R, Kirmizitas A, Patient R. Developmental hematopoiesis: ontogeny, genetic programming and conservation. Exp Hematol. 2014;42(8):669–683. - PubMed
    1. Mirshekar-Syahkal B, Fitch SR, Ottersbach K. Concise review: From greenhouse to garden: the changing soil of the hematopoietic stem cell microenvironment during development. Stem Cells. 2014;32(7):1691–1700. - PubMed
    1. Swiers G, Rode C, Azzoni E, de Bruijn MF. A short history of hemogenic endothelium. Blood Cells Mol Dis. 2013;51(4):206–212. - PMC - PubMed
    1. Mascarenhas MI, Parker A, Dzierzak E, Ottersbach K. Identification of novel regulators of hematopoietic stem cell development through refinement of stem cell localization and expression profiling. Blood. 2009;114(21):4645–4653. - PMC - PubMed
    1. Mirshekar-Syahkal B, Haak E, Kimber GM, et al. Dlk1 is a negative regulator of emerging hematopoietic stem and progenitor cells. Haematologica. 2013;98(2):163–171. - PMC - PubMed

Publication types

MeSH terms