. 2016 Jun 15;594(12):3245-70.
doi: 10.1113/JP271930. Epub 2016 Apr 13.

Bioelectric signalling via potassium channels: a mechanism for craniofacial dysmorphogenesis in KCNJ2-associated Andersen-Tawil Syndrome

Affiliations

Bioelectric signalling via potassium channels: a mechanism for craniofacial dysmorphogenesis in KCNJ2-associated Andersen-Tawil Syndrome

Dany Spencer Adams et al. J Physiol. .

Abstract

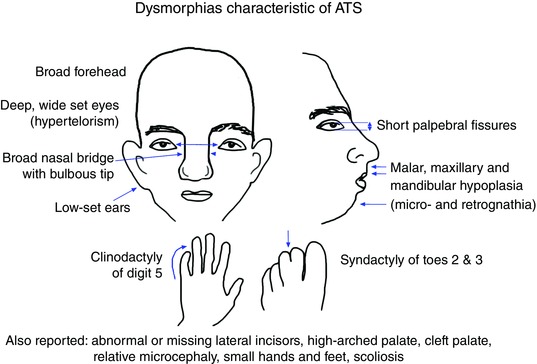
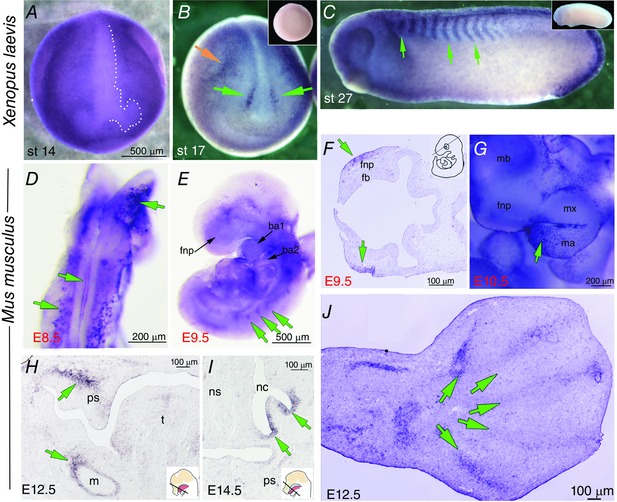
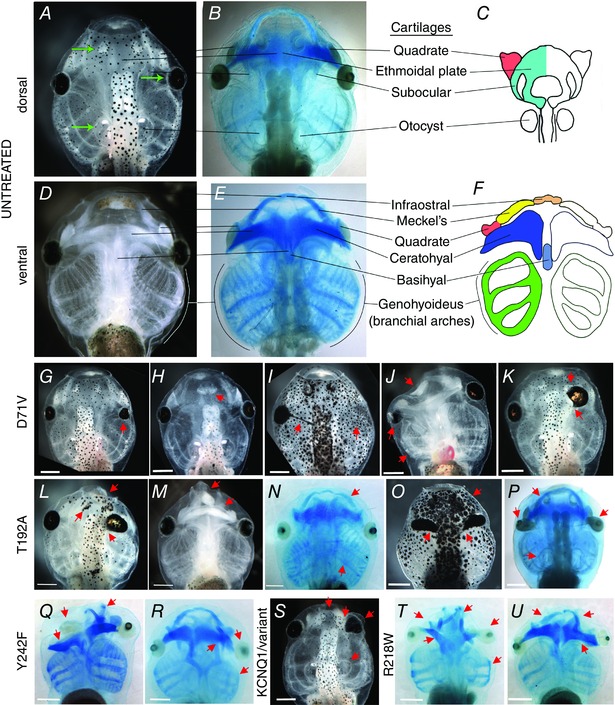
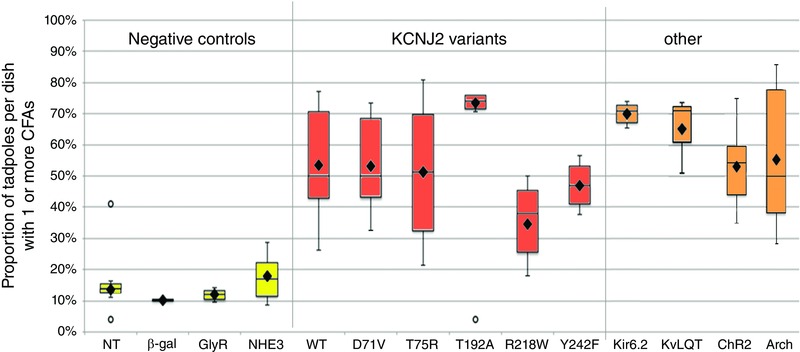
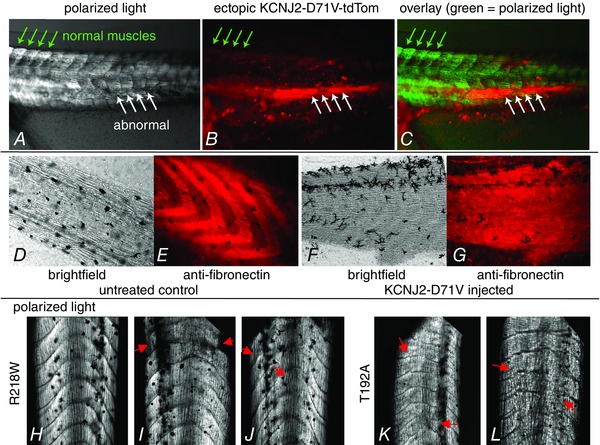
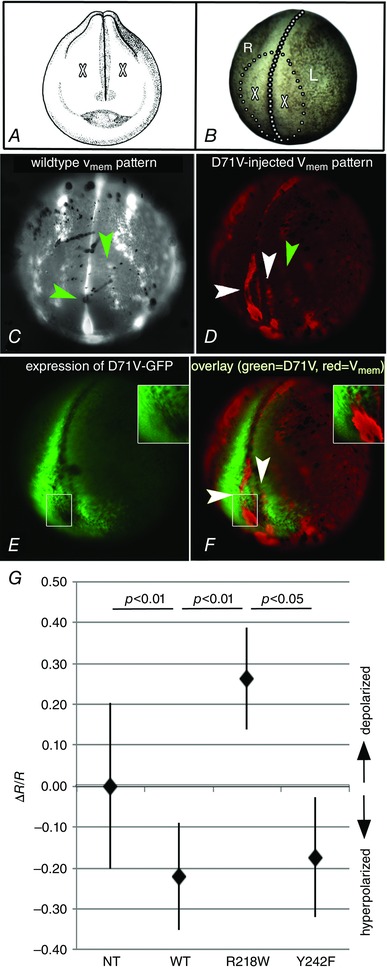
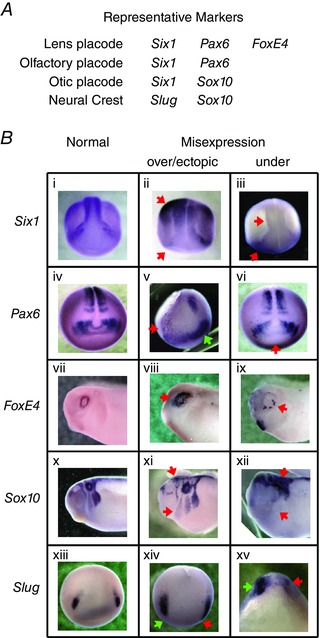
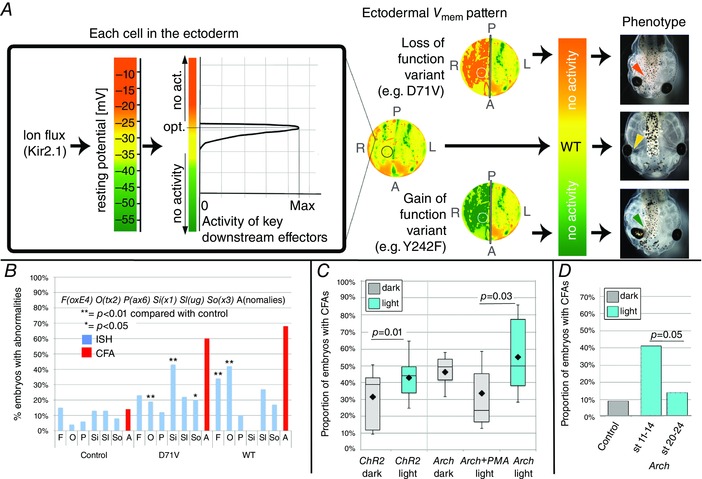
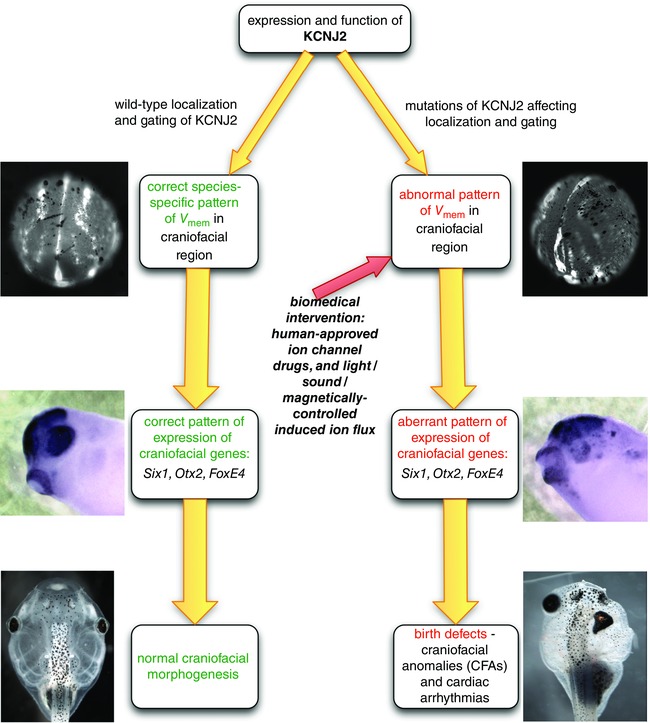
Key points: Xenopus laevis craniofacial development is a good system for the study of Andersen-Tawil Syndrome (ATS)-associated craniofacial anomalies (CFAs) because (1) Kcnj2 is expressed in the nascent face; (2) molecular-genetic and biophysical techniques are available for the study of ion-dependent signalling during craniofacial morphogenesis; (3) as in humans, expression of variant Kcnj2 forms in embryos causes a muscle phenotype; and (4) variant forms of Kcnj2 found in human patients, when injected into frog embryos, cause CFAs in the same cell lineages. Forced expression of WT or variant Kcnj2 changes the normal pattern of Vmem (resting potential) regionalization found in the ectoderm of neurulating embryos, and changes the normal pattern of expression of ten different genetic regulators of craniofacial development, including markers of cranial neural crest and of placodes. Expression of other potassium channels and two different light-activated channels, all of which have an effect on Vmem , causes CFAs like those induced by injection of Kcnj2 variants. In contrast, expression of Slc9A (NHE3), an electroneutral ion channel, and of GlyR, an inactive Cl(-) channel, do not cause CFAs, demonstrating that correct craniofacial development depends on a pattern of bioelectric states, not on ion- or channel-specific signalling. Using optogenetics to control both the location and the timing of ion flux in developing embryos, we show that affecting Vmem of the ectoderm and no other cell layers is sufficient to cause CFAs, but only during early neurula stages. Changes in Vmem induced late in neurulation do not affect craniofacial development. We interpret these data as strong evidence, consistent with our hypothesis, that ATS-associated CFAs are caused by the effect of variant Kcnj2 on the Vmem of ectodermal cells of the developing face. We predict that the critical time is early during neurulation, and the critical cells are the ectodermal cranial neural crest and placode lineages. This points to the potential utility of extant, ion flux-modifying drugs as treatments to prevent CFAs associated with channelopathies such as ATS.

Abstract: Variants in potassium channel KCNJ2 cause Andersen-Tawil Syndrome (ATS); the induced craniofacial anomalies (CFAs) are entirely unexplained. We show that KCNJ2 is expressed in Xenopus and mouse during the earliest stages of craniofacial development. Misexpression in Xenopus of KCNJ2 carrying ATS-associated mutations causes CFAs in the same structures affected in humans, changes the normal pattern of membrane voltage potential regionalization in the developing face and disrupts expression of important craniofacial patterning genes, revealing the endogenous control of craniofacial patterning by bioelectric cell states. By altering cells' resting potentials using other ion translocators, we show that a change in ectodermal voltage, not tied to a specific protein or ion, is sufficient to cause CFAs. By adapting optogenetics for use in non-neural cells in embryos, we show that developmentally patterned K(+) flux is required for correct regionalization of the resting potentials and for establishment of endogenous early gene expression domains in the anterior ectoderm, and that variants in KCNJ2 disrupt this regionalization, leading to the CFAs seen in ATS patients.


Figures

Figure 1
Figure 1. External craniofacial anomalies characteristic of Andersen‐Tawil Syndrome
One of the three features used for diagnosis of ATS, craniofacial anomalies are seen in a majority of patients. These features are variably penetrant, however, with different patients showing different degrees of severity and different subsets of those shown. The characteristics shown here are frequently mentioned; a more inclusive list can be found in Yoon et al. (2006).
Figure 2
Figure 2. WISH for KCNJ2 in Xenopus and mouse embryos
Species are indicated on the left. A, a dorsal‐anterior view of a stage 14 Xenopus embryo dehydrated in methanol following fixation. The KNCJ2 signal is much lighter in the midline and two oval areas on either side at the anterior end, the area outlined by white dots. B, a neurulating Xenopus embryo showing KCNJ2 signal on the anterior neural folds (lower green arrows). Upper green arrow points to expression at the approximate position of the second pharyngeal cleft. Inset is sense strand control. C, stage 27 Xenopus embryo showing strong KCNJ2 staining in the somites (green arrows). Inset is sense strand control. D, in situ hybridization of KCNJ2 mRNA expression in an E8.5 mouse embryo (dorsal view of whole‐mount embryo). KCNJ2 mRNA is detected in the midline of the fusing neural tube, and in a punctate bilateral expression pattern lateral to the midline and in anterior neural tissues (green arrows). E, lateral view of whole‐mount embryo at E9.5 showing KCNJ2 mRNA expression in the craniofacial region including the frontonasal prominence (fnp) and branchial arches 1 and 2, and in the forming somites (green arrows). F, sectioned ISH of E9.5 mouse embryo revealed KCNJ2 expression in the epithelium of the frontonasal prominence (fnp) (green arrows). A schematic in the right top corner indicates the approximate plane of section. G, lateral view of whole‐mount embryo craniofacial region at E10.5 revealed KCNJ2 expression in the frontonasal prominence (fnp), in the mandibular process (ma) (green arrow) including along the border with the maxillary process (mx). H and I, sectioned ISH revealed KCNJ2 mRNA expression in neural crest‐derived mesenchymal cells of the palatal shelves (ps), in mesenchymal cells surrounding the developing Meckel's cartilage (m) and in the olfactory epithelium of nasal cavity (nc) in E13.5 (H) and E15.5 (I) embryos (green arrows). Inserts adapted from d'Amaro et al. (2012). J, at E12.5 KCNJ2 mRNA was detected in condensations of the developing forelimb digits (green arrows). Abbreviations: ba1, branchial arch 1; ba2, branchial arch 2; fb, forebrain; fnp, frontonasal prominence; m, Meckel's cartilage; mb, midbrain; ma, mandibular process; mx, maxillary process; nc, nasal cavity; ns, nasal septum; ps, palatal shelf; t, tongue.
Figure 3
Figure 3. Tadpole craniofacial anomalies caused by injection of mRNA for KCNJ2 variants
Anterior is up in all panels; view is dorsal except in DF, J, M, Q and U. All scale bars = 0.5 mm. AF, normal wildtype head of the stage 46 tadpole. A and D, darkfield; B and E, Alcian blue staining; C and F, after Reisoli et al. (2010). GU, both the range of phenotypes seen and the commonality of the phenotypes resulting from all the variants tested. GK, heads of tadpoles that were injected with the dominant negative Kcnj2 variant D71V. Illustrated are typical anomalies: G, small eye; H, fusion of the two olfactory bulbs; I, pigmented optic nerve and missing eye; J, anomalies restricted to one side include a small misshapen eye with misplaced lens, grossly undersized branchial arches and malformed Meckel's cartilage; K, fusion of the brain eye and olfactory bulb on the right side. LP, heads of tadpoles injected with T192A. L, the leftmost arrow points to a malformed olfactory bulb, while the other two arrows point to the same anomalies seen in D71V‐injected tadpoles J and K, namely malformed Meckel's cartilage and fusion of the brain with the eye. M, another commonly seen malformation is the narrowing of the anterior most end with malformed or absent infraostral and Meckel's cartilages. N, an example of a more subtle phenotype of differences in size of Meckel's cartilages and the branchial arches. O, a commonly seen eye phenotype, shown in an tadpole with bilateral anomalies. In these tadpoles the optic nerve is both pigmented and thickened, looking like an extension of the eye. This embryo also has a malformed olfactory bud. P, this embryo shows the same inequality of Meckel's cartilages seen in N, combined with gross malformations of both eyes. The otic capsule is also misshapen in this tadpole. Q and R, tadpoles expressing the Y242F variant. Q, the ceratohyals of this tadpole are badly distorted, while at least one of Meckel's cartilages is located in the wrong place. The right eye of this tadpole lacked a lens. R, a more subtle effect of Y242F showing distorted ethmoidal plate, a badly positioned eye, and, like the D71V tadpole in J, small branchial arches on one side. S, similar phenotypes are caused by injection of a different potassium channel, including abnormal narrowing anteriorly and concomitant loss of Meckel's cartilages and probably the infraostral cartilage, fusion of the olfactory bulb and eye, misshapen eye, and a misshapen otic capsule, like the T192A‐injected tadpole in P, which lacks an otolith. T and U, tadpoles grown from R218W‐injected embryos. T, this tadpole has distorted Meckel's cartilages and quadrate, malformed eyes, malformed ethmoidal plate, and small branchial arches on one side. U, deformed Meckel's and ceratohyal cartilages, one bad eye and small branchial arches, resulting from R218W injection as well as injection of the other variants.
Figure 4
Figure 4. Box and whisker plots illustrating the differences in proportions of CFAs resulting from injections of different mRNAs
Box plots show median and 1st and 3rd quartiles; the whiskers extend to the 10th and 90th percentiles; the dot indicates the mean. Controls are shown in yellow, KCNJ2 variants in red and other translocators in orange. None of the control mRNAs (β‐gal, GlyR, NHE3) caused a meaningful increase in the proportion of CFAs; the mean proportion of CFAs in negative controls was 14%. All the variants of KCNJ2 caused greater than 30% of tadpoles to develop CFAs, well above our threshold of 24% for biological significance; all of these differences were highly significant (Table 3). Two other potassium channels, Kir6.2 (KCNJ11) and KvLQT (KCNQ1), plus a light‐activated cation channel (ChR2‐D156A) and a light‐activated hydrogen ion pump (Arch) likewise caused meaningful increases in the proportion of tadpoles developing CFAs.
Figure 5
Figure 5. Skeletal muscle phenotype caused by injection of mRNA for variant KCNJ2
Images of the skeletal muscle phenotypes observed in injected tadpole tails; in AC anterior is to the left and dorsal is up, in DG anterior is to the right and dorsal is up and in H–L anterior is up. A, live tadpole tail imaged using polarized light. Normal muscles, indicated by the green arrows, yield clear, organized, light patterns. In contrast, abnormal muscles are obviously disordered. B, expression of D71V‐tdTomato in the same tail. C, overlay of A and B shows the overlap of variant KCNJ2 expression with the position of abnormal muscle structure, and its absence from the normal muscle (now pseudocoloured green). DG, a comparison of the organization of fibronectin in normal tails versus tails injected with variant KCNJ2 lacking a fluorescent protein. In the injected animal (F, G) the normal pattern of expression has been severely disrupted, although the muscles look normally organized in brightfield. H, polarized light image of an R218W‐injected animal that nonetheless shows normal organization of the tail muscles. I and J, tails from R218W‐expressing tadpoles show characteristic alterations to the normal chevron pattern of the muscle blocks. Red arrows indicate especially large deviations. K and L, tails from T192A‐expressing tadpoles also display the same types of deviations from the normal morphology, illustrating a similarity of muscle phenotypes that parallels the similarity of CFAs induced by different variants.
Figure 6
Figure 6. Disruption of the normal regionalization of Vmem domains caused by injection of mRNA encoding D71V
Examples of V mem regionalization in normal and variant injected embryos. During neurulation, Xenopus embryos have a dynamic regionalization of V mem across the ectoderm that is disrupted when variant KCNJ2 is expressed. Green arrowheads indicate normal domains of hyperpolarization (brighter) while white arrows point to abnormal regions of hyperpolarization. The anterior of each embryo is shown, and dorsal is up; the injected embryo is angled slightly to the right. A, drawing from Nieuwkoop & Faber (1994) showing frontal view of a stage 19 embryo. Dorsal is up. The added X's indicate position of cells that will make the eyes. B, brightfield image of a stage 19 embryo in the same orientation as the embryo in C–F. The midline is indicated by large dots, while small dots circle the area that will become the face. A in A, X's indicate the positions of the future eyes. R and L = right and left side of the embryo. C, the normal pattern of V mem variation in a late neurula (stage 19). Brighter indicates relatively hyperpolarized (more negative) while dimmer indicates relatively depolarized (less negative). The upper arrow points to a stripe of hyperpolarized cells found in the region where eyes and olfactory bulbs will form. The lower arrow points to the anterior end of the closing neural tube which is consistently more negative than the surrounding cells. D, the V mem pattern in an embryo injected on the right side with the D71V variant; brighter red reveals cells that are hyperpolarized relative to less bright cells. While expression is mostly on the right side, there is some expression on the left side at the anterior most end of the embryo. The green arrowhead points to a normal region of hyperpolarization, while the white arrowheads indicate two abnormal regions of hyperpolarization, a bend to the right and extra stripe. Inset: diagram showing the stage and orientation of the embryo. E, expression of D71V‐GFP in the same embryo; the dotted line indicates the midline. Note that there are areas within the expression domain of the depolarizing variant Kir2.1 that have much lower expression, or lack expression entirely (inset). F, interestingly, the regions of ectopic hyperpolarization that are present within the overall expression domain of the variant line up with the areas showing low to no expression of the depolarizing variant (white arrowheads and inset). G, relative V mem of ectoderm cells in embryos measured using DiBAC4(3) and Oxonol VI. As predicted, the wild‐type and the gain‐of‐function variant Y242F hyperpolarize while the loss‐of‐function variant R218W depolarizes (Kruskal–Wallis, df = 3, H = 21.34, P < 0.001; Dunn's post hoc as shown; sample sizes were: NT 33 embryos; WT 16; R218W 4; Y242F 7; error bars = standard deviation).
Figure 7
Figure 7. Whole‐mount ISH for well‐known markers of craniofacial development in embryos injected with mRNA encoding D71V
Shown is a subset of the WISHs performed (see also Supplementary Fig. S3). This set represents at least two markers each of the relevant tissues, i.e. neural crest and the three placodes studied. A, chart showing locations of marker expression. B, normal (1st column), over‐expressed (2nd column) and under‐expressed (3rd column) examples from each of five representative markers. Red arrows point to positions of abnormal signal patterns; the green arrow in v points to normal expression on the side opposite the disrupted pattern. The patterns we saw, even in injected embryos that did not have significantly more misexpression than background, are consistent with incorrect or incomplete differentiation (ii, iii, v, vi, viii, ix) and anomalies in neural crest migration (xi, xii, xiv, xv). To date, we have not detected any correlation between the types or magnitudes of disruptions caused and the identity of the ion flux‐perturbing construct injected.
Figure 8
Figure 8. CFA induction
A, diagram illustrating our hypothesis about how either depolarizing or hyperpolarizing a cell membrane away from the optimal V mem for the downstream effectors can lead to the same effect on phenotype. In every cell membrane, flux through ion channels, such as Kir2.1, or pumps sets the resting potential of the membrane. V mem influences downstream effectors by affecting activity levels, in much the same way that temperature influences protein activity, and deviation from the optimum lowers activity. The example in this graph shows an effector that works optimally at a V mem we have assigned the colour yellow, and drops off rapidly either above or below that value. The embryo‐wide distribution of all of the cells’ V mem values (e.g. Fig. 6 C) is the regionalization that we call the ‘electric face’. To illustrate how gain‐ and loss‐of‐function variants, acting in a subset of individual cells, might disrupt the wild‐type pattern and lead to dysmorphia, we have schematically represented changes to ‘V mem’ by using Photoshop to artificially change the colours that represent the different V mem values. The three circular representations of embryos are pseudocoloured copies of the wild‐type embryonic V mem pattern shown in Fig. 6 C. The first is the wild‐type pattern. The upper illustration represents how inhibition of Kir2.1 on the right‐hand side would result in depolarization of that side, as represented by orange, while the lower represents hyperpolarization (green) due to gain of Kir2.1 function. On each of the three schemes is a circle indicating the position of the cells that will form the area between the right eye and the brain. The lack of signalling by downstream effectors in these regions leads to abnormal morphology of the tadpole; the hyperpolarized and the depolarized conditions give rise to the same phenotype because both changes move the V mem out of the range that permits protein activity. The micrographs at the far right side are photos of actual tadpoles that were treated as indicated: the top tadpole was injected with the loss‐of‐function variant D71V, the bottom with the gain‐of‐function variant Y242F. B, a comparison of the proportion of D71V and WT injected tadpoles with misexpressed patterning genes (blue bars), versus the proportion with CFAs (red bars). Data on abnormal WISH patterns were pooled, and thus blue bars represent totals (see Table 4 for statistics); CFAs were counted for each of the biological replicates separately, and therefore the red bars represent means. Only three expression patterns were found to be significantly affected by expression of a variant, Otx2, Six1 and FoxE4 (Table 4). The number of CFAs was found to exceed the number of cases of misexpression of any single patterning gene. C, optogenetics can be used to manipulate V mem. Expression of the light‐activated cation channel ChR2‐D156A causes a higher number of CFAs when injected embryos are exposed to blue light. Because we found evidence that Arch depolarizes in the dark, we compared Arch in the light to the results of pairing Arch with the constitutively active H+ pump PMA1, a protocol that reduced the dark phenotype. Box plots as in Fig. 4. D, optogenetics can be used to explore the timing of important electrophysiological events. Exposure to light causes an increase in the number of CFAs in embryos expressing Arch only if exposure occurs during early neurulation. The same exposure at later stages has no effect on craniofacial morphology (Table 3).
Figure 9
Figure 9. Schematic of hypothesis
Transcription of KCNJ2 in the embryonic face, together with other ion channels, establishes endogenous patterns of V mem across the anterior ectoderm. This pattern can be disrupted by changes in KCNJ2 expression, intracellular localization or gating properties, all of which can be induced by KCNJ2 variants. Because these voltage patterns regulate transcription of downstream genetic targets known to be important for patterning the face, this model predicts how KCNJ2 channelopathies result in craniofacial dysmorphias. As V mem can be altered by many distinct channels, these findings suggest a novel control point for therapeutic intervention, using optogenetics and/or ion channel drugs to manipulate non‐neural bioelectric signalling during embryogenesis and perhaps restore normal patterning despite KCNJ2 variants or other channelopathies.

References

    1. Abe M, Maeda T & Wakisaka S (2008). Retinoic acid affects craniofacial patterning by changing Fgf8 expression in the pharyngeal ectoderm. Dev Growth Differ 50, 717–729. - PubMed
    1. Abello G, Khatri S, Radosevic M, Scotting PJ, Giraldez F & Alsina B (2010). Independent regulation of Sox3 and Lmx1b by FGF and BMP signalling influences the neurogenic and non‐neurogenic domains in the chick otic placode. Dev Biol 339, 166–178. - PubMed
    1. Adams DS (2008). A new tool for tissue engineers: ions as regulators of morphogenesis during development and regeneration. Tissue Eng Part A 14, 1461–1468. - PubMed
    1. Adams DS, Lemire JM, Kramer RH & Levin M (2014). Optogenetics in developmental biology: using light to control ion flux‐dependent signals in Xenopus embryos. Int J Dev Biol 58, 851–861. - PMC - PubMed
    1. Adams DS & Levin M (2012). Measuring resting membrane potential using the fluorescent voltage reporters DiBAC4(3) and CC2‐DMPE. Cold Spring Harb Protoc 2012, 459–464. - PMC - PubMed

Publication types

LinkOut - more resources