

Allopatric divergence of Stuckenia filiformis (Potamogetonaceae) on the Qinghai-Tibet Plateau and its comparative phylogeography with S. pectinata in China
- PMID: 26864465
- PMCID: PMC4750007
- DOI: 10.1038/srep20883
Allopatric divergence of Stuckenia filiformis (Potamogetonaceae) on the Qinghai-Tibet Plateau and its comparative phylogeography with S. pectinata in China
Abstract
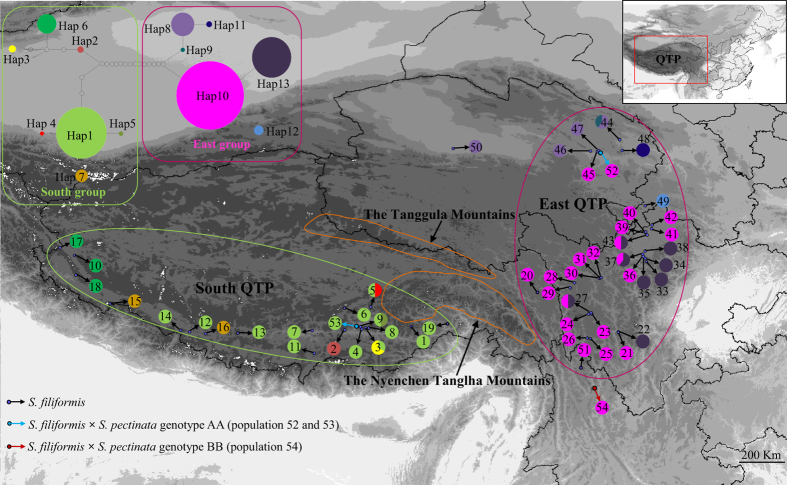
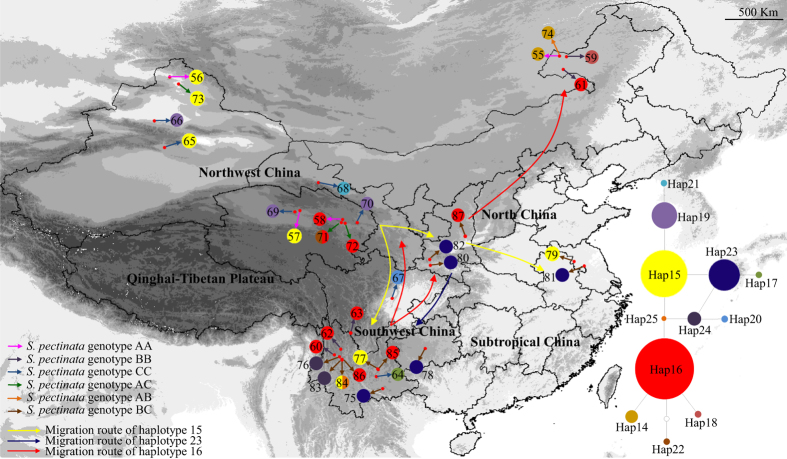
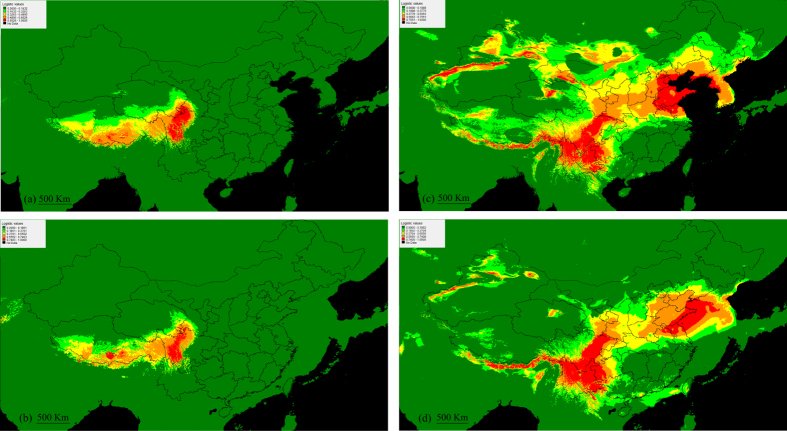
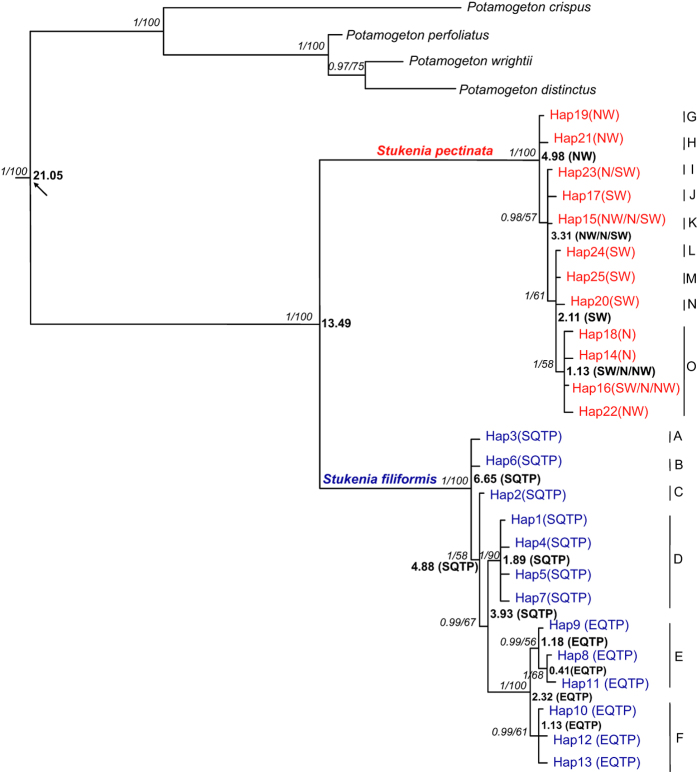
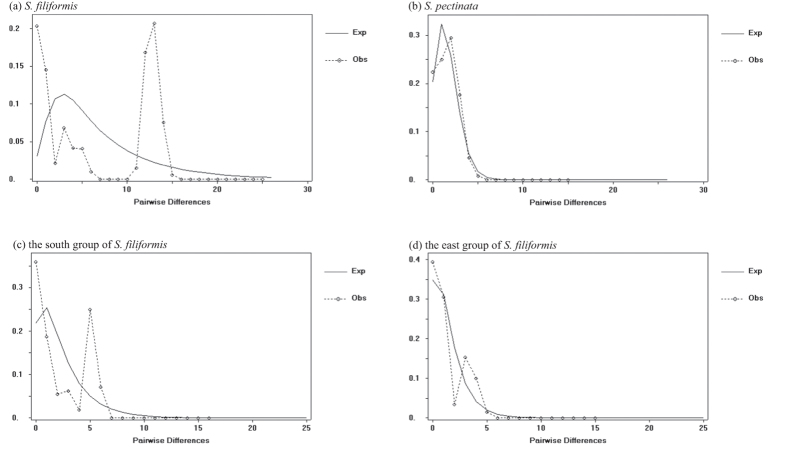
In the aquatic genus Stuckenia, the wide geographic range of S. pectinata and S. filiformis make them suited for examination of topographic and climatic effects on plant evolution. Using nuclear ITS sequence and ten chloroplast sequences, we conducted comparative phylogeographical analyses to investigate their distribution regions and hybrid zones in China, and compare their phylogeographical patterns and demographical histories. These two species were allopatric in China. S. filiformis occurred only on the Qinghai-Tibet Plateau (QTP), whereas S. pectinata occupied a wide range of habitats. These two species formed hybrid zones on the northeastern edge of QTP. Most of the genetic variance of S. filiformis was between the southern and eastern groups on the QTP, showing a significant phylogeographic structure. The geographical isolations caused by the Nyenchen Tanglha Mountains and the Tanggula Mountains promoted intraspecific diversification of alpine plants on the QTP. This study revealed the lack of phylogeographic structure in S. pectinata, due to the continued gene flow among its distribution regions. The ecological niche modeling showed that the distribution ranges of these two herbaceous species did not contract too much during the glacial period.
Figures
References
-
- Liu J. Q., Sun Y. S., Ge X. J., Gao L. M. & Qiu Y. X. Phylogeographical studies of plants in China: Advances in the past and directions in the future. J. Syst. Evol. 50, 267–275 (2012).
-
- Du F. K. et al. Direction and extent of organelle DNA introgression between two spruce species in the Qinghai-Tibetan Plateau. New Phyto. 192, 1024–1033 (2011). - PubMed
-
- Qiu Y. X., Fu C. X. & Comes H. P. Plant molecular phylogeography in China and adjacent regions: Tracing the genetic imprints of Quaternary climate and environmental change in the world’s most diverse temperate flora. Mol. Phylogenet. Evol. 59, 225–244 (2011). - PubMed
-
- Royden L. H., Burchfiel B. C. & van der Hilst R. D. The geological evolution of the Tibetan plateau. Science 321, 1054–1058 (2008). - PubMed
-
- Zhou S. Z., Wang X. L., Wang J. & Xu L. B. A preliminary study on timing of the oldest Pleistocene glaciation in Qinghai-Tibetan Plateau. Quatern. Int. 154–155, 44–51 (2006).
Publication types
MeSH terms
Substances
LinkOut - more resources
Full Text Sources
Other Literature Sources
