

Synergistic infection of two viruses MCMV and SCMV increases the accumulations of both MCMV and MCMV-derived siRNAs in maize
- PMID: 26864602
- PMCID: PMC4808907
- DOI: 10.1038/srep20520
Synergistic infection of two viruses MCMV and SCMV increases the accumulations of both MCMV and MCMV-derived siRNAs in maize
Abstract
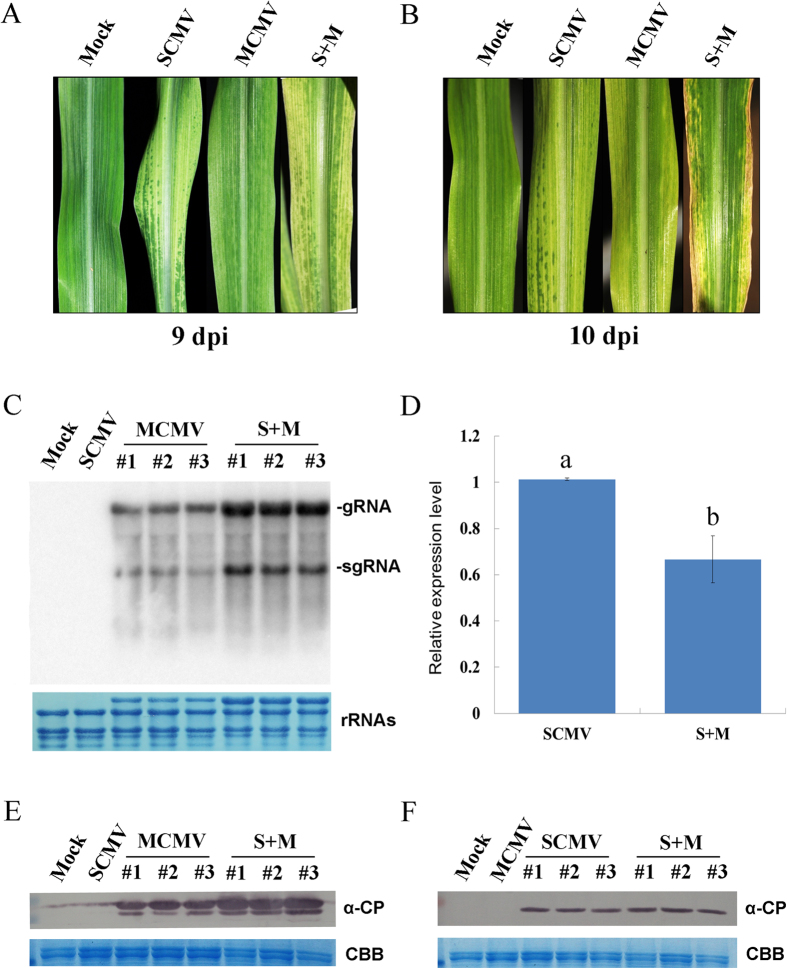
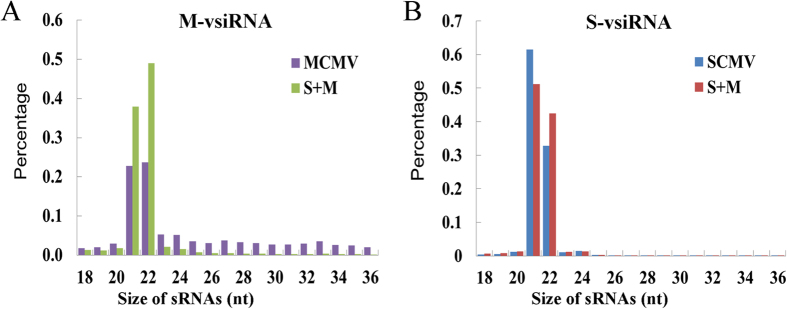
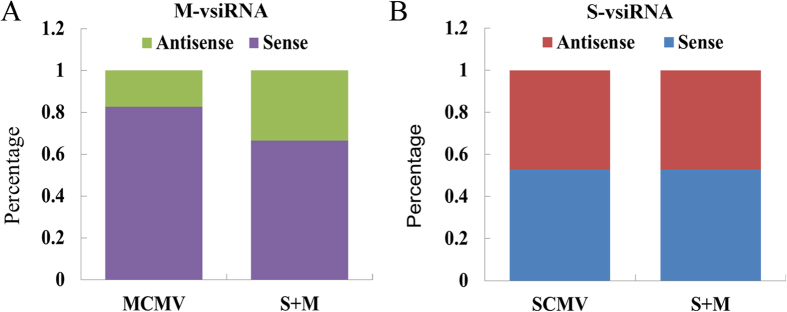
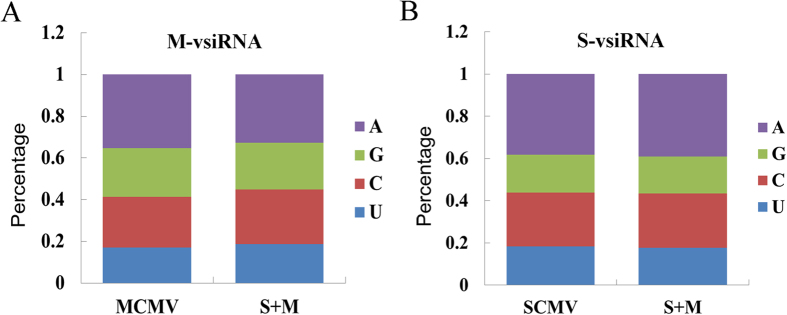
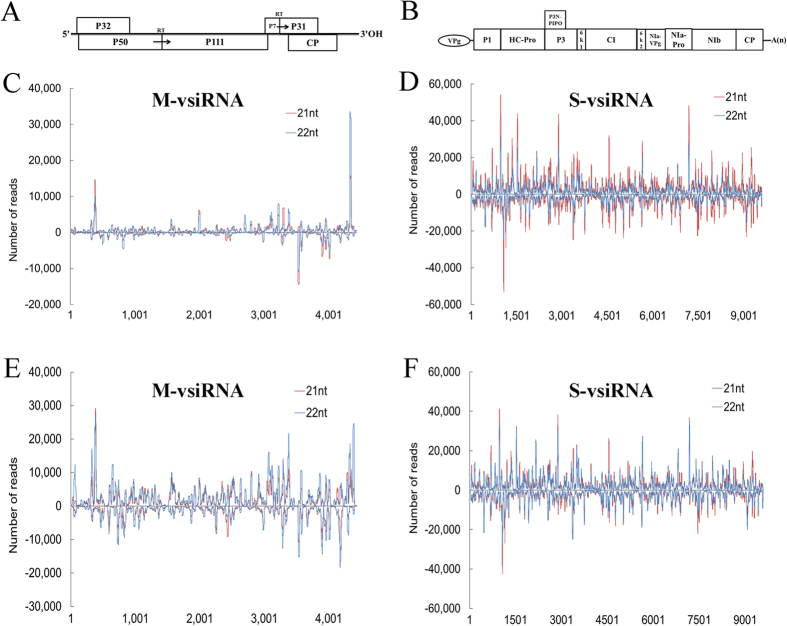
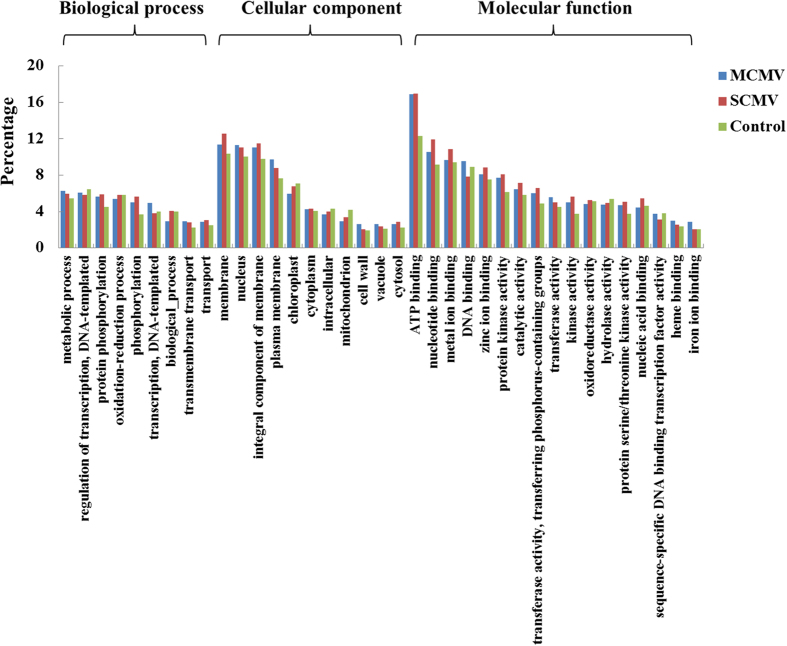
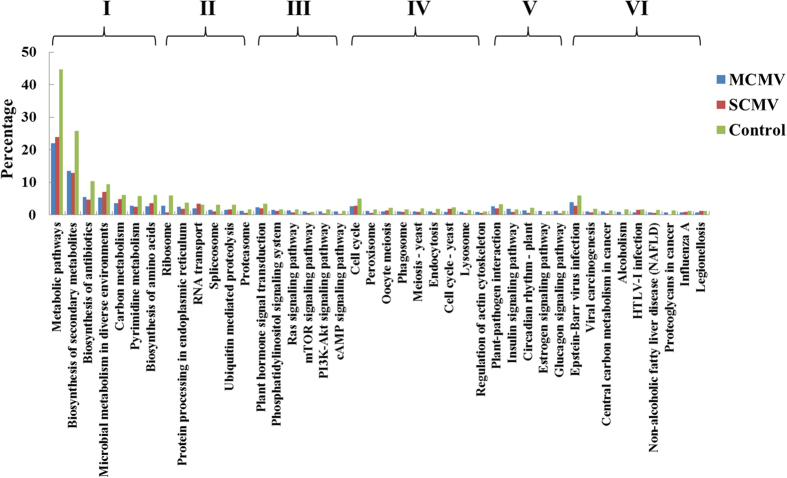
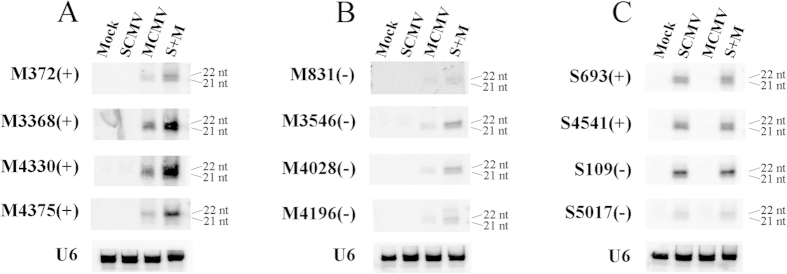
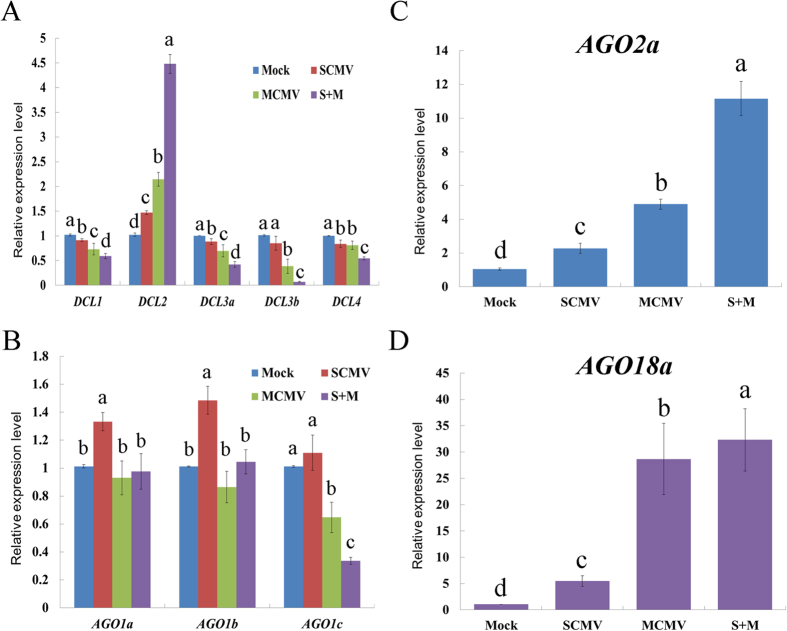
The co-infection of Maize chlorotic mottle virus (MCMV) and Sugarcane mosaic virus (SCMV) can cause maize lethal necrosis. However, the mechanism underlying the synergistic interaction between these two viruses remains elusive. In this study, we found that the co-infection of MCMV and SCMV increased the accumulation of MCMV. Moreover, the profiles of virus-derived siRNAs (vsiRNAs) from MCMV and SCMV in single- and co-infected maize plants were obtained by high-throughput sequencing. Our data showed that synergistic infection of MCMV and SCMV increased remarkably the accumulation of vsiRNAs from MCMV, which were mainly 22 and 21 nucleotides in length. The single-nucleotide resolution maps of vsiRNAs revealed that vsiRNAs were almost continuously but heterogeneously distributed throughout MCMV and SCMV genomic RNAs, respectively. Moreover, we predicted and annotated dozens of host transcript genes targeted by vsiRNAs. Our results also showed that maize DCLs and several AGOs RNAs were differentially accumulated in maize plants with different treatments (mock, single or double inoculations), which were associated with the accumulation of vsiRNAs. Our findings suggested possible roles of vsiRNAs in the synergistic interaction of MCMV and SCMV in maize plants.
Figures
Similar articles
-
Characterization of small interfering RNAs derived from Sugarcane mosaic virus in infected maize plants by deep sequencing.PLoS One. 2014 May 12;9(5):e97013. doi: 10.1371/journal.pone.0097013. eCollection 2014. PLoS One. 2014. PMID: 24819114 Free PMC article.
-
Metagenomic analysis of viruses associated with maize lethal necrosis in Kenya.Virol J. 2018 May 23;15(1):90. doi: 10.1186/s12985-018-0999-2. Virol J. 2018. PMID: 29792207 Free PMC article.
-
Characterization of Maize miRNAs in Response to Synergistic Infection of Maize Chlorotic Mottle Virus and Sugarcane Mosaic Virus.Int J Mol Sci. 2019 Jun 27;20(13):3146. doi: 10.3390/ijms20133146. Int J Mol Sci. 2019. PMID: 31252649 Free PMC article.
-
Maize Lethal Necrosis: An Emerging, Synergistic Viral Disease.Annu Rev Virol. 2018 Sep 29;5(1):301-322. doi: 10.1146/annurev-virology-092917-043413. Epub 2018 Jul 30. Annu Rev Virol. 2018. PMID: 30059641 Review.
-
Maize Lethal Necrosis (MLN), an Emerging Threat to Maize-Based Food Security in Sub-Saharan Africa.Phytopathology. 2015 Jul;105(7):956-65. doi: 10.1094/PHYTO-12-14-0367-FI. Epub 2015 Jul 1. Phytopathology. 2015. PMID: 25822185 Review.
Cited by
-
The coat protein p25 from maize chlorotic mottle virus involved in symptom development and systemic movement of tobacco mosaic virus hybrids.Front Microbiol. 2022 Aug 5;13:951479. doi: 10.3389/fmicb.2022.951479. eCollection 2022. Front Microbiol. 2022. PMID: 35992724 Free PMC article.
-
Maize catalases are recruited by a virus to modulate viral multiplication and infection.Mol Plant Pathol. 2024 Mar;25(3):e13440. doi: 10.1111/mpp.13440. Mol Plant Pathol. 2024. PMID: 38460111 Free PMC article.
-
Small Talk: On the Possible Role of Trans-Kingdom Small RNAs during Plant-Virus-Vector Tritrophic Communication.Plants (Basel). 2023 Mar 22;12(6):1411. doi: 10.3390/plants12061411. Plants (Basel). 2023. PMID: 36987098 Free PMC article. Review.
-
The RNA of Maize Chlorotic Mottle Virus, an Obligatory Component of Maize Lethal Necrosis Disease, Is Translated via a Variant Panicum Mosaic Virus-Like Cap-Independent Translation Element.J Virol. 2020 Oct 27;94(22):e01005-20. doi: 10.1128/JVI.01005-20. Print 2020 Oct 27. J Virol. 2020. PMID: 32847851 Free PMC article.
-
A maize triacylglycerol lipase inhibits sugarcane mosaic virus infection.Plant Physiol. 2022 Jun 1;189(2):754-771. doi: 10.1093/plphys/kiac126. Plant Physiol. 2022. PMID: 35294544 Free PMC article.
References
-
- Incarbone M. & Dunoyer P. RNA silencing and its suppression: novel insights from in planta analyses. Trends Plant Sci 18, 382–392 (2013). - PubMed
-
- Bologna N. G. & Voinnet O. The diversity, biogenesis, and activities of endogenous silencing small RNAs in Arabidopsis. Annu Rev Plant Biol 65, 473–503 (2014). - PubMed
Publication types
MeSH terms
Substances
LinkOut - more resources
Full Text Sources
Other Literature Sources
