. 2016 Apr 1;27(7):1101-19.
doi: 10.1091/mbc.E15-04-0186. Epub 2016 Feb 10.

Confined diffusion of transmembrane proteins and lipids induced by the same actin meshwork lining the plasma membrane

Affiliations

Confined diffusion of transmembrane proteins and lipids induced by the same actin meshwork lining the plasma membrane

Takahiro K Fujiwara et al. Mol Biol Cell. .

Abstract

The mechanisms by which the diffusion rate in the plasma membrane (PM) is regulated remain unresolved, despite their importance in spatially regulating the reaction rates in the PM. Proposed models include entrapment in nanoscale noncontiguous domains found in PtK2 cells, slow diffusion due to crowding, and actin-induced compartmentalization. Here, by applying single-particle tracking at high time resolutions, mainly to the PtK2-cell PM, we found confined diffusion plus hop movements (termed "hop diffusion") for both a nonraft phospholipid and a transmembrane protein, transferrin receptor, and equal compartment sizes for these two molecules in all five of the cell lines used here (actual sizes were cell dependent), even after treatment with actin-modulating drugs. The cross-section size and the cytoplasmic domain size both affected the hop frequency. Electron tomography identified the actin-based membrane skeleton (MSK) located within 8.8 nm from the PM cytoplasmic surface of PtK2 cells and demonstrated that the MSK mesh size was the same as the compartment size for PM molecular diffusion. The extracellular matrix and extracellular domains of membrane proteins were not involved in hop diffusion. These results support a model of anchored TM-protein pickets lining actin-based MSK as a major mechanism for regulating diffusion.


Figures

FIGURE 1:
FIGURE 1:
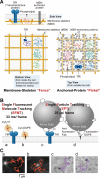
The MSK fence and anchored-TM-protein picket model, and the single-molecule tracking methods used in this study. (A) Fence-and-pickets model. The PM can be partitioned into compartments, and both TM proteins and lipids undergo short-term confined diffusion within a compartment and long-term hop movements between these compartments, which is termed hop diffusion. Temporary confinement within the compartment is induced by the actin-MSK “fences” and the anchored-TM-protein “pickets” anchored to and aligned along the actin MSK. In this study, we examined the movements of DOPE and TfR (a native dimer). Side view, a variety of TM proteins (temporarily) bind to the MSK, and these MSK-anchored TM proteins act like “pickets.” Bottom view, the PM cytoplasmic surface, viewed from inside the cell, showing the MSK “fence” model. Top view, many TM proteins are (temporarily) anchored to and aligned along the actin MSK, exerting hydrodynamic circumferential-slowing (enhanced viscosity) and steric-hindrance effects on PM molecules that approach the anchored TM-proteins. (B) Experimental design for SFMT and SPT. For SFMT, TfR tagged with Cy3-Tf (a) and Cy3-DOPE (b) were used. For SPT, TfR tagged with 40-nm-diameter colloidal gold particles coated with a small number of transferrin molecules were used (c). For colloidal-gold labeling of DOPE (d), gold probes coated with anti-fluorescein antibody Fab fragments were bound to fluorescein-conjugated DOPE, which was preincorporated in the PM. The fluorescein moiety was used as a tag for the antibody Fab rather than a fluorescent probe. (C) Images of Cy3 and colloidal-gold probes and their trajectories at video rate for 3 s, observed on the top surface of PtK2 cells. Here a–d are the same as in B.
FIGURE 2:
FIGURE 2:
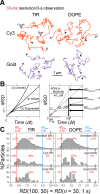
Method for classifying the trajectories into simple-Brownian-, suppressed-, and directed-diffusion modes and its application to TfR and DOPE trajectories (with fluorescent and gold probes) obtained in the PtK2-PM at video rate. (A) Representative trajectories of TfR (left) and DOPE (right) tagged with Cy3 (top) or gold (bottom) probes in the PtK2-PM. (B) Left, theoretical MSD–Δt curves for 1) simple-Brownian, 2) directed, and 3) suppressed diffusion (for the same short-term diffusion coefficients = initial slope at time 0). Right, motional mode classification based on RD(N, n). (C) Distribution of RD(N, n) for N = 100 and n = 30 (1 s), used for the classification of the trajectories into different diffusion modes (left, TfR; right, DOPE). Top, simple-Brownian trajectories generated by Monte Carlo simulation (the same graphs are used for both TfR and DOPE). The 2.5th percentiles of the distribution from both ends, RDmin(100, 30) and RDMAX(100, 30), are shown by red and cyan vertical lines, respectively. Middle, SFMT at normal video rate, using Cy3 as a probe. Bottom, SPT at normal video rate, using gold particles as probes.
FIGURE 3:
FIGURE 3:
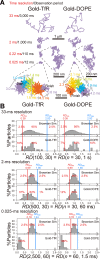
Hop diffusion becomes visible only with enhanced frame rates (improved time resolution). (A) Representative trajectories of gold-TfR (left) and DOPE (right) in the PtK2-cell PM obtained at systematically varied frame times of 33, 2, 0.22, and 0.025 ms. The trajectories obtained at 0.22- and 0.025-ms resolution are enlarged (see scales). Color coding in the 0.025-ms-resolution trajectories represents plausible compartments detected by a computer program (Fujiwara et al., 2002). The residency time within each compartment is shown. The overlaps of trajectories in adjacent compartments occur due to noise (limited single-molecule localization precision of 19.3 nm for both the horizontal and vertical directions of the camera at 0.025-ms resolution; see Materials and Methods). (B) Distributions of RD(n steps, nδt) (δt = time resolution) for gold-TfR and DOPE in the PtK2-cell PM. For the data obtained at time resolution of 33, 2, and 0.025 ms, the values of the (N, n) pair used here were (100, 30), (500, 30), and (2500, 60), respectively, in terms of the number of steps and (3.3 s, 1 s), (2 s, 60 ms), and (62.5 ms, 1.5 ms), respectively, in terms of time. The (N, n) pair of (100, 30) for the 33-ms resolution data was used, for consistency with the data for Cy3-TfR and Cy3-DOPE (Figure 2C). For the analysis of the data obtained at 2- and 0.025-ms resolution, n values were selected so that the analysis time scale of nδt would be useful to detect the non–simple-Brownian nature of the trajectories (Murase et al., 2004). The shapes of the RD distributions for simulated simple-Brownian particles at different time resolutions shown here seem to be quite different because we used the same x-axis scale for all of the RD distributions obtained at different time resolutions, whereas the ratios n/N, which strongly affect the appearance of the RD histograms, used here were quite different for the data obtained on different time scales. To show the shapes of the RD distributions obtained at different time resolutions more clearly, histograms with different x-scales for the same data sets are shown in Supplemental Figure S3.
FIGURE 4:
FIGURE 4:
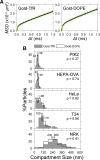
The hop-diffusion fitting of the ensemble-averaged MSD–∆t curves obtained at 0.025-ms resolution supports the proposal that suppressed diffusion is actually induced by hop diffusion (A), and the compartment sizes detected by TfR and DOPE are virtually the same for the five cell lines examined here (B). (A) Ensemble-averaged MSD–∆t plots for gold-TfR (left; n = 54) and gold-DOPE (right; n = 50) obtained at 0.025-ms resolution, with the best-fit curves (green) based on the hop diffusion model (Powles et al., 1992). The error bars represent standard errors. (B) Distributions of the compartment size L for the five different cell lines. Gray bars, TfR (30–101 particles examined for each cell line). Open bars, DOPE (30–77 particles). Arrowheads indicate median values. The difference between TfR and DOPE for each cell line was insignificant (Mann–Whitney U test). The NRK-cell PM is unique, in that it exhibited nested double compartments (Fujiwara et al., 2002; Suzuki et al., 2005). However, we only discuss the smaller compartments in this article. The relationships of the compartment size distributions for gold-DOPE diffusion shown here and those previously reported by us (Fujiwara et al., 2002; Murase et al., 2004) are described in the Supplemental Notes to Figure 4B.
FIGURE 5:
FIGURE 5:
The sizes of the MSK meshwork on the PM cytoplasmic surface determined by electron tomography agree well with the compartment sizes determined from the gold-DOPE diffusion measurements. (A, B) Electron tomography images of the PM cytoplasmic surface of the PtK2 cell. The images on the far left are the 0- to 8.8-nm and 8.8- to 17.6-nm sections, each comprising a stack of eight 1.1-nm sections of 640 × 640 nm. These are from a series of 133 image sections (1.1 nm thick) from the cytoplasmic surface after the tilt and the long-wavelength undulation of the cell surface were corrected. The areas enclosed by the white squares in these images (320 × 320 nm) are expanded on the right, with a section thickness of 2.2 nm (two 1.1-nm sections are superimposed). (C) The outline of each actin filament adjacent to the PM cytoplasmic surface (green, observed in the section of 0–2.2 nm and fading out in the sections of 8.8–11.0 and 11.0–13.2 nm) and the outline of each actin filament that could not be observed in the first and/or second sections (0–2.2, 0–4.4, and 2.2–4.4 nm) from the membrane surface and that does not fade out even in the section of 13.2–15.4 nm from the surface (red), as determined from the sections in A and B (320 × 320 nm). (D) The image of the 0- to 8.8-nm section, that is, the image expanded from the leftmost image in A (640 × 640 nm). (E) The outline of actin filaments in a greater view field (640 × 640 nm). (F) Superimposition of image (D) and the green outline (E). The first-layer actin filaments are outlined in yellow, and the areas surrounded by these actin filaments are green. (G) Comparison of the distributions of the actin-MSK mesh size from electron tomography (green areas in F; open bars) with those of the compartment sizes determined from the gold-DOPE diffusion data (closed bars) for PtK2 (blue) and NRK (magenta; from Morone et al., 2006) cells.
FIGURE 6:
FIGURE 6:
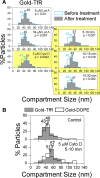
Cytochalasin D, but not latrunculin A, increased the PM compartment size in PtK2 cells, and its effect was greatest 5–10 min after its addition to the cells. Under these conditions, the compartment sizes were increased for both gold-TfR and gold-DOPE, but no statistically significant differences were found between these two probes. (A) Effects of latrunculin A and cytochalasin D on the compartment size for gold-TfR in the PtK2-cell PM, showing the dramatic dependence on the drug type and the cytochalasin D treatment duration. p values were determined by the Mann-Whitney U test. The compartment size distribution for gold-TfR in the intact PM of PtK2 cells (blue histograms) is reproduced in all of the boxes for comparison. This histogram is the same as that shown in Figure 4B, top, and is reproduced here for comparison with those after the treatment with actin-modifying drugs. (B) Compartment size distribution for gold-TfR at 5–10 min after the addition of cytochalasin D (reproduced from the top graph in A) compared with that for gold-DOPE. The data in the top graph show the compartment size distributions in intact cells (control) reproduced here from Figure 4B, top, for comparison.
FIGURE 7:
FIGURE 7:
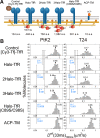
TfR’s Deff(33 ms)100 ms (and thus hop frequency) depends on both its cytoplasmic domain size and dimerization in both PtK2 and T24 cells. (A) Molecules used for this examination. Note that endogenous TfR exists as dimers, and that since the expression levels of modified TfR molecules are much smaller than that of endogenous TfR, most of the expressed molecules are expected to form dimers with endogenous TfR. The numbers indicate the number of amino acids in the cytoplasmic domain of the endogenous human TfR (67 aa), the Halo-tag protein (297 aa), linkers (17 and 20 aa), and the cytoplasmic domain of the ACP-TM (10 aa). The expected total numbers of amino acids in the cytoplasmic domain are shown below (the endogenous TfR in PtK2 cells was assumed to have the same number of amino acids in the cytoplasmic domain as that in human TfR). (B) Distributions of the effective macroscopic diffusion coefficient Deff(33 ms)100 ms for the individual molecules in A in PtK2- and T24-cell PMs. Deff(33 ms)100 ms should be proportional to the hop frequency. For a discussion of the effect of the cross section of a diffusant on its hop characteristics, see Supplemental Notes to Figure 7B.

References

    1. Andrade DM, Clausen MP, Keller J, Mueller V, Wu C, Bear JE, Hell SW, Lagerholm BC, Eggeling C. Cortical actin networks induce spatio-temporal confinement of phospholipids in the plasma membrane—a minimally invasive investigation by STED-FCS. Sci Rep. 2015;5:11454. - PMC - PubMed
    1. Ayscough K. Use of latrunculin-A, an actin monomer-binding drug. Methods Enzymol. 1998;298:18–25. - PubMed
    1. Billaudeau C, Mailfert S, Trombik T, Bertaux N, Rouger V, Hamon Y, He HT, Marguet D. Probing the plasma membrane organization in living cells by spot variation fluorescence correlation spectroscopy. Methods Enzymol. 2013;519:277–302. - PubMed
    1. Bubb MR, Spector I, Beyer BB, Fosen KM. Effects of jasplakinolide on the kinetics of actin polymerization. An explanation for certain in vivo observations. J Biol Chem. 2000;275:5163–5170. - PubMed
    1. Chaudhuri A, Bhattacharya B, Gowrishankar K, Mayor S, Rao M. Spatiotemporal regulation of chemical reactions by active cytoskeletal remodeling. Proc Natl Acad Sci USA. 2011;108:14825–14830. - PMC - PubMed

Publication types