. 2016 Apr 1;27(7):1170-80.
doi: 10.1091/mbc.E16-01-0002. Epub 2016 Feb 10.

Phosphoinositide kinase signaling controls ER-PM cross-talk

Affiliations

Phosphoinositide kinase signaling controls ER-PM cross-talk

Deike J Omnus et al. Mol Biol Cell. .

Abstract

Membrane lipid dynamics must be precisely regulated for normal cellular function, and disruptions in lipid homeostasis are linked to the progression of several diseases. However, little is known about the sensory mechanisms for detecting membrane composition and how lipid metabolism is regulated in response to membrane stress. We find that phosphoinositide (PI) kinase signaling controls a conserved PDK-TORC2-Akt signaling cascade as part of a homeostasis network that allows the endoplasmic reticulum (ER) to modulate essential responses, including Ca(2+)-regulated lipid biogenesis, upon plasma membrane (PM) stress. Furthermore, loss of ER-PM junctions impairs this protective response, leading to PM integrity defects upon heat stress. Thus PI kinase-mediated ER-PM cross-talk comprises a regulatory system that ensures cellular integrity under membrane stress conditions.


Figures

FIGURE 1:
FIGURE 1:
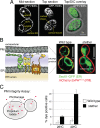
ER-PM junctions maintain PM integrity upon heat stress. (A) The ER forms an extensive network of sheets and tubules. Localization of the ER marker GFP-HDEL in wild-type diploid cells. Cortical ER (cER), cytoplasmic ER (cytoER), and nuclear ER (nER) are labeled. Scale bar, 2 μm. (B) Left, three protein families tether the cortical ER to the PM: the VAP proteins Scs2/22, Ist2, and the tricalbins (Tcb1/2/3). The VAP proteins bind PI4P-binding ORP family members. PB, polybasic domain; SMP, synaptotagmin-like mitochondrial lipid–binding protein. Right, loss of ER-PM tethers alters ER morphology. Localization of the ER marker Sec61-GFP (green) and PM marker mCherry-2xPHPLCδ (red) in wild-type and Δtether cells (ist2Δ, scs2/22Δ, tcb1/2/3Δ). An ER-PM junction is indicated in wild-type cells and collapsed ER in Δtether cells. Scale bars, 3 μm. (C) Cells incubated at 26 or 40°C for 2 h were stained with propidium iodide to monitor PM integrity. Staining of wild-type (white bars) and Δtether (black bars) cells was analyzed by flow cytometry. See Supplemental Figure S1.
FIGURE 2:
FIGURE 2:
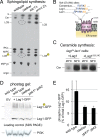
ER-PM junctions regulate sphingolipid synthesis. (A) The yeast biosynthetic pathway for sphingolipid synthesis in the ER and Golgi network. (B) Sphingolipid synthesis in the ER and Golgi complex protects PM integrity during heat stress. Wild-type, lcb1ts, lac1 lag1ts, and aur1ts cells incubated at 26 (white bars) or 40°C for 2 h (black bars) were stained with propidium iodide and analyzed by flow cytometry. (C) Analysis of sphingolipid synthesis in wild-type and Δtether cells. Wild-type and Δtether cells were preincubated at the appropriate temperature for 10 min and labeled with [3H]serine for 60 min. Sphingolipids were extracted and analyzed by TLC. Ceramides (Cer) and the complex sphingolipids IPCs, MIPC, and M(IP)2C are indicated. An unknown lipid, X, was also observed. The hatched areas point out reduced ceramides and MIPC in the Δtether mutant cells. (D) Synthesis of ceramides in wild-type and Δtether cells. Results shown here are from a long exposure from an independent experiment to better visualize ceramides. As in Figure 2C, cells were preincubated at the appropriate temperature for 10 min and labeled with [3H]serine for 60 min. Sphingolipids were extracted and analyzed by TLC. Ceramides (Cer) and an unknown lipid, X, are indicated. (E) Quantitation of ceramide synthesis in wild-type and Δtether cells normalized to wild type at 26°C. The data represent the mean ± SD from three independent experiments.
FIGURE 3:
FIGURE 3:
PI kinase signaling regulates the protein kinase Pkh1. (A) Wild-type, stt4ts, mss4ts, pkh1ts pkh2Δ, and ypk1ts ypk2Δ cells incubated at 26 (white bars) or 42°C for 10 min (black bars) were stained with propidium iodide and analyzed by flow cytometry to monitor PM integrity. (B) Pkh1/2 signaling is modestly impaired in stt4ts and strongly impaired in mss4‑ cells. Wild-type, stt4ts, mss4ts, and pkh1ts pkh2Δ cells were incubated at 26 or 38°C for 2 h. Protein extracts were analyzed by immunoblotting using antisera that recognize phospho-Ypk1(T504). Levels of phospho-Ypk1(T504), normalized to a protein loading control, are shown relative to wild-type cells at 26°C. Results are the mean ± SD from three independent experiments. See Supplemental Figure S3B. (C) Speculative model for regulation of Ypk1/2 signaling by Pkh1/2, TORC2, and the PI isoforms PI4P and PI(4,5)P2. PI(4,5)P2 is essential for Pkh1/2 signaling, but PI4P may be involved in Pkh1/2 regulation as well (dashed arrow).
FIGURE 4:
FIGURE 4:
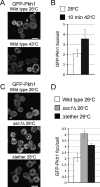
Heat-induced membrane stress and PI metabolism regulate Pkh1 localization. (A) Pkh1 assembles into cortical patches upon heat shock. Wild-type cells expressing GFP-Pkh1 were grown at 26°C (top) and shifted to 42°C for 10 min (bottom). Arrows show examples of small GFP-Pkh1 cortical patches in wild-type cells at 26°C. The majority of GFP-Pkh1 foci are cortical, but internal patches are also observed. Scale bar, 5 μm. See Supplemental Figure S4C. (B) High-content quantitative analysis of GFP-Pkh1 distribution. Maxima for GFP-Pkh1 foci in single focal planes (1482 foci in total from 720 cells at 26 and 3742 foci in total from 1095 cells after heat shock at 42°C) were identified using Fiji. Results show the mean and SD from three independent experiments. (C) PI4P metabolism controls Pkh1 localization. GFP-Pkh1 localization in wild-type, sac1Δ, and Δtether cells. Arrows show examples of small GFP-Pkh1 cortical patches in wild-type cells at 26°C. GFP-Pkh1 puncta are increased in sac1Δ and Δtether cells at 26°C. Scale bar, 5 μm. (D) GFP-Pkh1 puncta are increased in sac1Δ and Δtether cells. Maxima for GFP-Pkh1 foci in single focal planes (1482 in total from 720 wild-type cells, 7258 in total from 1802 sac1Δ cells, and 3921 in total from 1261 Δtether cells at 26°C) were identified using Fiji. Results show the mean and SD from three independent experiments. See Supplemental Figure S4, D–F.
FIGURE 5:
FIGURE 5:
PI4P and PI(4,5)P2 metabolism control TORC2 signaling. (A) TORC2 signaling and Slt2 MAPK phosphorylation in wild-type, stt4ts, and mss4ts cells. Wild-type (WT), stt4ts, and mss4ts cells were incubated at 26 or 38°C for 2 h. Protein extracts were analyzed by immunoblotting using antisera that recognize phospho-Ypk1(T662) or phospho-Slt2. Quantifications below the blot report the difference relative to WT after normalizing to a protein loading control; results are the mean of three independent experiments. (B) TORC2 signaling and Slt2 MAPK phosphorylation in cells lacking the PI4P phosphatase Sac1 or the ER-PM tether proteins. WT, sac1Δ, and Δtether cells were incubated at 26 or 38°C for 2 h. Protein extracts were analyzed by immunoblotting using antisera that recognize phospho-Ypk1(T662) or phospho-Slt2. Quantifications below the blot report the difference relative to WT after normalizing to a protein loading control; results are the mean of three independent experiments. See Supplemental Figure S5. (C) Slm1-GFP localization in WT cells (left) and Δtether cells (right). Bottom, differential interference contrast overlays. Scale bar, 5 μm.
FIGURE 6:
FIGURE 6:
ER-PM cross-talk controls ceramide synthase activity in the ER. (A) Synthesis of ceramides, but not LCBs, is compromised in the Δtether cells. Wild-type, Δtether, sac1Δ, and orm1Δ orm2Δ cells were labeled with [3H]serine for 60 min at 26°C. Sphingolipids were extracted and analyzed by TLC. LCBs, phosphorylated-LCBs (LCB-P), ceramides (Cer), and other sphingolipid species are indicated. The hatched ovals point out elevated LCBs and phosphorylated LCBs in the Δtether mutant cells. In addition, note that ceramides are reduced in the Δtether mutant cells as compared with wild-type cells (Figure 2). The sac1Δ and orm1Δ orm2Δ cells serve as controls for LCBs and phosphorylated LCBs. See Supplemental Figure S6, A and B. (B) Schematic cartoon depicting topology of Lac1 and Lag1 in the ER. Both proteins possess Ypk1/2 consensus sites in their N-terminal cytoplasmic tails. (C) Double-mutant lac1Δ lag1ts cells expressing either wild-type Lag1 or the phosphomimetic form Lag1S23,24E from plasmids were preincubated at the appropriate temperature for 10 min and labeled with [3H]serine for 60 min. Sphingolipids were extracted and analyzed by TLC. (D) Analysis of Lag1-GFP phosphorylation upon heat stress conditions. Wild-type, Δtether, and ypk1ts ypk2Δ cells expressing Lag1-GFP were incubated at 38°C for 2 h. Protein extracts were prepared, separated by Phos-tag gel electrophoresis, and analyzed by immunoblotting using an antibody that specifically recognizes GFP. Wild-type cells carrying empty vector were included as a control for the GFP antisera. SDS–PAGE and immunoblotting were used to determine expressions levels of PGK as a protein loading control. (E) Quantitation of phosphorylated Lag1-GFP level in wild-type and Δtether cells as a percentage of total Lag1-GFP protein levels. The data represent means ± SDs from two independent experiments analyzed in duplicate.
FIGURE 7:
FIGURE 7:
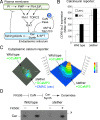
ER-PM junctions modulate cytoplasmic Ca2+ and calcineurin phosphatase activity during heat-induced ceramide synthesis. (A) Speculative model for a homeostatic regulatory loop in ER-PM cross-talk. Changes in membrane order and composition, including heat-induced membrane stress (Audhya and Emr, 2002) and other conditions, such as sphingolipid depletion (Jesch et al., 2010), increased PI kinase signaling up, regulating the Pkh1-TORC2-Ypk1 cascade. Ypk1 stimulates synthesis of LCBs and ceramides in the ER (via activation of serine palmitoyltransferase, SPT, and ceramide synthases) to adjust membrane lipid composition and protect PM integrity. The ER-localized Scs2/22 and Tcb1/2/3 proteins that form ER-PM junctions modulate cytoplasmic Ca2+ and calcineurin activity, which antagonizes sphingolipid synthesis in the ER. On restoration of membrane order, the PI kinase-Pkh1/2-TORC2-Ypk1/2 pathway is maintained at basal signaling levels. (B) Wild-type and Δtether cells carrying a CDRE-lacZ reporter were grown at 26°C and shifted to the indicated temperatures for 2 h, and β-galactosidase activity was determined. Data represent means ± SDs from three independent experiments. See Supplemental Figure S7A. (C) Wild-type and Δtether cells expressing cytoplasmic GCaMP3 were grown at 26°C. Vacuoles in Δtether cells were labeled with the dye CMAC to distinguish mutant cells from wild-type cells. Left, the cultures were mixed and simultaneously observed by fluorescence microscopy. Right, relative GCaMP3 intensities were quantified using soft-WoRx 3.5.0. Scale bar, 3 μm. See Supplemental Figure S7B. (D) Wild-type cells and Δtether cells were labeled with [3H]serine for 60 min at 26°C in the absence or presence of the calcineurin inhibitor FK506. Sphingolipids were extracted and analyzed by TLC. Ceramides (Cer) are indicated; an unknown lipid, X, was also observed.

Similar articles

Cited by

References

    1. Anand K, Maeda K, Gavin AC. Structural analyses of the Slm1-PH domain demonstrate ligand binding in the non-canonical site. PLoS One. 2012;7:e36526. - PMC - PubMed
    1. Aronova S, Wedaman K, Aronov PA, Fontes K, Ramos K, Hammock BD, Powers T. Regulation of ceramide biosynthesis by TOR complex 2. Cell Metab. 2008;7:148–158. - PMC - PubMed
    1. Audhya A, Emr SD. Stt4 PI 4-kinase localizes to the plasma membrane and functions in the Pkc1-mediated MAP kinase cascade. Dev Cell. 2002;2:593–605. - PubMed
    1. Audhya A, Foti M, Emr SD. Distinct roles for the yeast phosphatidylinositol 4-kinases, Stt4p and Pik1p, in secretion, cell growth, and organelle membrane dynamics. Mol Biol Cell. 2000;11:2673–2689. - PMC - PubMed
    1. Audhya A, Loewith R, Parsons AB, Gao L, Tabuchi M, Zhou H, Boone C, Hall MN, Emr SD. Genome-wide lethality screen identifies new PI4,5P2 effectors that regulate the actin cytoskeleton. EMBO J. 2004;23:3747–3757. - PMC - PubMed

Publication types

MeSH terms

Substances