

Radiomics-based differentiation of lung disease models generated by polluted air based on X-ray computed tomography data
- PMID: 26864653
- PMCID: PMC4750279
- DOI: 10.1186/s12880-016-0118-z
Radiomics-based differentiation of lung disease models generated by polluted air based on X-ray computed tomography data
Abstract
Background: Lung diseases (resulting from air pollution) require a widely accessible method for risk estimation and early diagnosis to ensure proper and responsive treatment. Radiomics-based fractal dimension analysis of X-ray computed tomography attenuation patterns in chest voxels of mice exposed to different air polluting agents was performed to model early stages of disease and establish differential diagnosis.
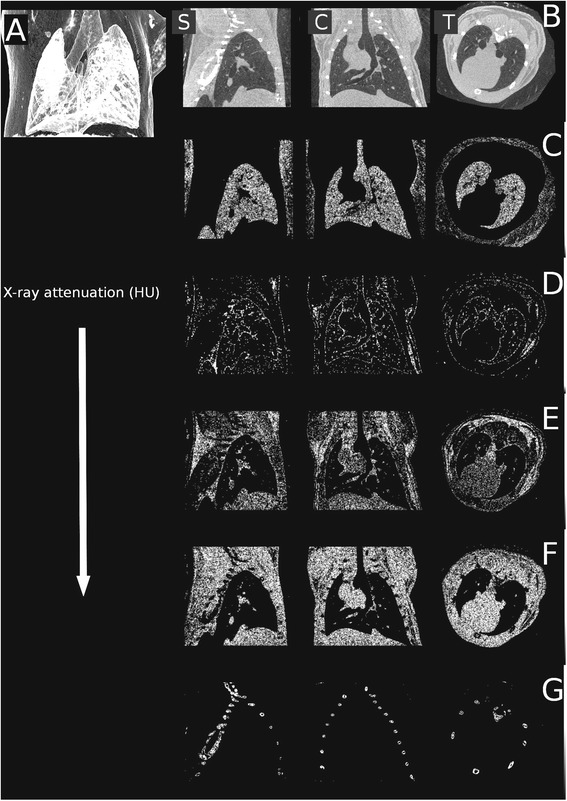
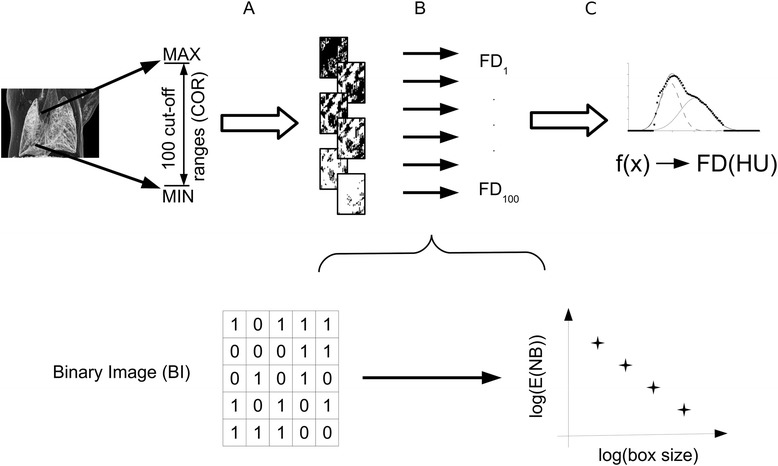
Methods: To model different types of air pollution, BALBc/ByJ mouse groups were exposed to cigarette smoke combined with ozone, sulphur dioxide gas and a control group was established. Two weeks after exposure, the frequency distributions of image voxel attenuation data were evaluated. Specific cut-off ranges were defined to group voxels by attenuation. Cut-off ranges were binarized and their spatial pattern was associated with calculated fractal dimension, then abstracted by the fractal dimension -- cut-off range mathematical function. Nonparametric Kruskal-Wallis (KW) and Mann-Whitney post hoc (MWph) tests were used.
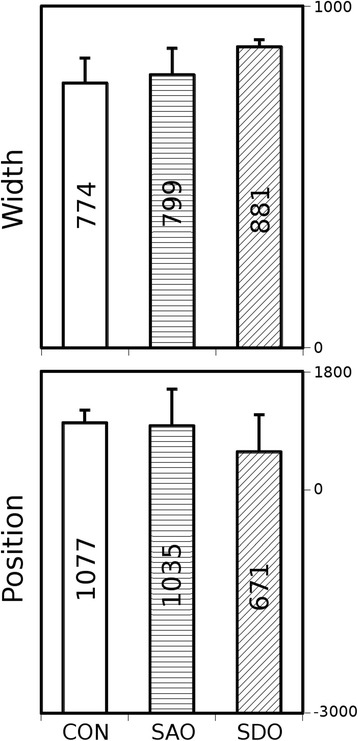
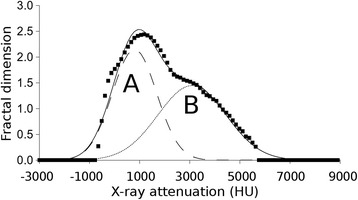
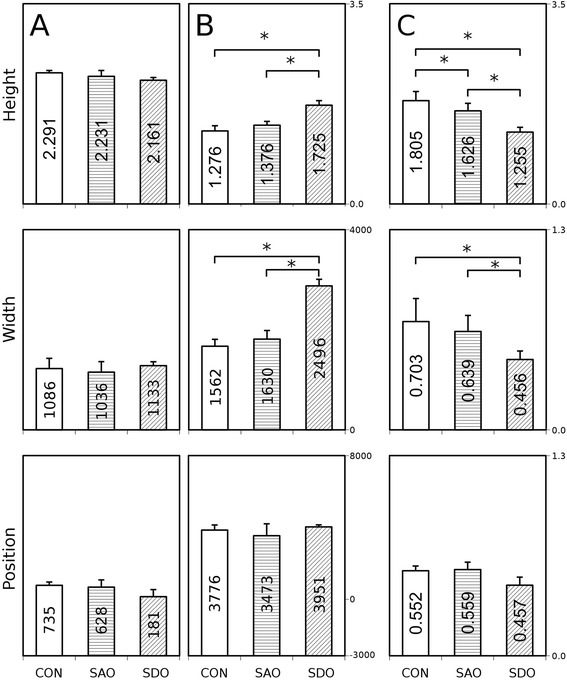
Results: Each cut-off range versus fractal dimension function plot was found to contain two distinctive Gaussian curves. The ratios of the Gaussian curve parameters are considerably significant and are statistically distinguishable within the three exposure groups.
Conclusions: A new radiomics evaluation method was established based on analysis of the fractal dimension of chest X-ray computed tomography data segments. The specific attenuation patterns calculated utilizing our method may diagnose and monitor certain lung diseases, such as chronic obstructive pulmonary disease (COPD), asthma, tuberculosis or lung carcinomas.
Figures
Similar articles
-
Multicity study of air pollution and mortality in Latin America (the ESCALA study).Res Rep Health Eff Inst. 2012 Oct;(171):5-86. Res Rep Health Eff Inst. 2012. PMID: 23311234
-
Effects of long-term exposure to traffic-related air pollution on respiratory and cardiovascular mortality in the Netherlands: the NLCS-AIR study.Res Rep Health Eff Inst. 2009 Mar;(139):5-71; discussion 73-89. Res Rep Health Eff Inst. 2009. PMID: 19554969
-
Methodologic aspects of attenuation distributions from static and dynamic thoracic CT techniques in experimental acute lung injury.Chest. 2005 Oct;128(4):2963-70. doi: 10.1378/chest.128.4.2963. Chest. 2005. PMID: 16236973
-
X-ray-based attenuation correction for positron emission tomography/computed tomography scanners.Semin Nucl Med. 2003 Jul;33(3):166-79. doi: 10.1053/snuc.2003.127307. Semin Nucl Med. 2003. PMID: 12931319 Review.
-
Cigarette smoke and ozone effect on murine inflammatory responses.Ann N Y Acad Sci. 2012 Jul;1259:104-11. doi: 10.1111/j.1749-6632.2012.06605.x. Ann N Y Acad Sci. 2012. PMID: 22758642 Review.
Cited by
-
Novel radiomics evaluation of bone formation utilizing multimodal (SPECT/X-ray CT) in vivo imaging.PLoS One. 2018 Sep 25;13(9):e0204423. doi: 10.1371/journal.pone.0204423. eCollection 2018. PLoS One. 2018. PMID: 30252902 Free PMC article.
-
Radiomics and Radiogenomics in Preclinical Imaging on Murine Models: A Narrative Review.J Pers Med. 2023 Jul 29;13(8):1204. doi: 10.3390/jpm13081204. J Pers Med. 2023. PMID: 37623455 Free PMC article. Review.
-
AI analysis of medical images at scale as a health disparities probe: a feasibility demonstration using chest radiographs.ArXiv [Preprint]. 2025 Apr 8:arXiv:2504.05990v1. ArXiv. 2025. PMID: 40297238 Free PMC article. Preprint.
-
Towards precision medicine: from quantitative imaging to radiomics.J Zhejiang Univ Sci B. 2018 Jan.;19(1):6-24. doi: 10.1631/jzus.B1700260. J Zhejiang Univ Sci B. 2018. PMID: 29308604 Free PMC article. Review.
-
Radiomics approach for identifying radiation-induced normal tissue toxicity in the lung.Sci Rep. 2024 Oct 16;14(1):24256. doi: 10.1038/s41598-024-75993-y. Sci Rep. 2024. PMID: 39415029 Free PMC article.
References
-
- Mandelbrot BB, Blumen A. Fractal Geometry: What is it, and What Does it do? Proc R Soc A. 1989;423:3–16. doi: 10.1098/rspa.1989.0038. - DOI
MeSH terms
Substances
LinkOut - more resources
Full Text Sources
Other Literature Sources
Medical
