

doi: 10.1038/srep20732.
Atlas Toolkit: Fast registration of 3D morphological datasets in the absence of landmarks
Affiliations
- PMID: 26864723
- PMCID: PMC4749973
- DOI: 10.1038/srep20732
Item in Clipboard
Atlas Toolkit: Fast registration of 3D morphological datasets in the absence of landmarks
Sci Rep.
.
Abstract
Image registration is a gateway technology for Developmental Systems Biology, enabling computational analysis of related datasets within a shared coordinate system. Many registration tools rely on landmarks to ensure that datasets are correctly aligned; yet suitable landmarks are not present in many datasets. Atlas Toolkit is a Fiji/ImageJ plugin collection offering elastic group-wise registration of 3D morphological datasets, guided by segmentation of the interesting morphology. We demonstrate the method by combinatorial mapping of cell signalling events in the developing eyes of chick embryos, and use the integrated datasets to predictively enumerate Gene Regulatory Network states.
Figures
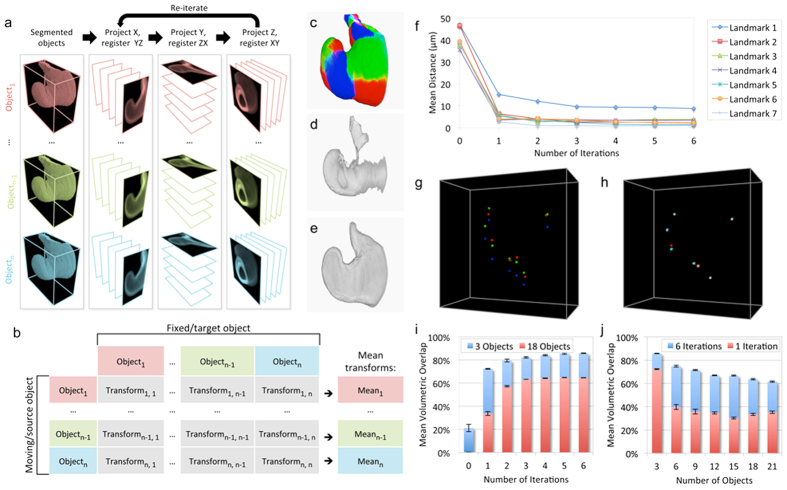
(a) Group-wise registration of multiple 3D objects is achieved by the sequential and iterative registration of orthogonal 2D projections. (b) For each orthogonal plane, the 2D projections are registered group-wise by determining the mean transformation coefficients resulting from multiple pair-wise registrations. (c) 3D reconstruction of three superimposed Optic Vesicle objects (red, green and blue, respectively) segmented from stage HH12 chick embryos before group-wise 3D registration. (d) Intersection of the three Optic Vesicle objects shown in (c) before group-wise 3D registration. (e) Intersection of the three Optic Vesicle objects shown in (c) after group-wise 3D registration using Atlas Toolkit. (f) Graph quantifying the convergence of 7 simulated landmarks in three manually deformed objects, expressed as mean pair-wise distance in microns (μm), with increasing iteration numbers. (g) 3D reconstruction showing the initial distribution of 7 simulated landmarks in the three manually deformed objects (red, green, blue). (h) 3D reconstruction showing the convergence of landmarks in (g) following registration using Atlas Toolkit. (i) Relationship between mean volumetric overlap and increasing iteration number, for three or 18 real Optic Vesicle objects. (j) Relationship between mean volumetric overlap and increasing numbers of real Optic Vesicle objects, for one or six iterations.
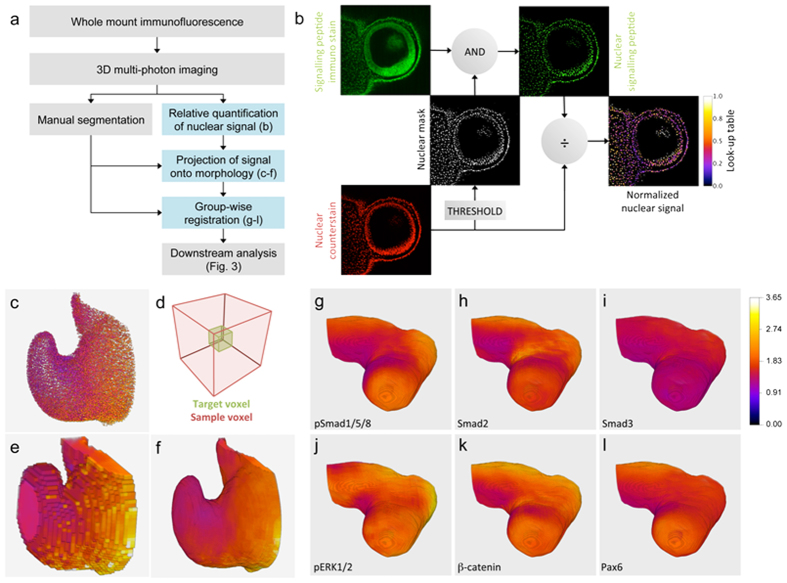
(a) Overview of method workflow with blue boxes highlighting the steps performed by Atlas Toolkit. (b) Method for relative quantification of nuclear protein levels used by the tool ‘Extract Nuclear Signal’. (c–f) Method for projecting nuclear signal onto surface morphology used by the tool ‘Project to Segment Label’: (c) 3D reconstruction of cell nuclei segmented from an HH12 Optic Vesicle, colour-coded according to phospho-ERK1/2 protein levels (cold colours = low signal; warm colours = high signal). (d) Local averaging is used to ‘fill-in’ intra-nuclear space: the image volume is sub-divided into 12 μm target voxels, each of which is assigned the mean nuclear signal level from its surrounding 36 μm ‘sample voxel’. (e) Result of local averaging applied to cell nuclei in (c).(f) Surface morphology is restored by cropping the locally averaged volume in (e) using the segmentation label. (g–l) Group-wise 3D registration of Optic Vesicles segmented from 18 stage HH10 chick embryos stained with six different antibodies (three embryos per antibody). The nuclear signal levels were quantified and projected onto Optic Vesicle morphology prior to registration. The Optic Vesicle morphology shown in (g–l) is the consensus of all 18 embryos, while each antibody stain is the mean average of three embryos (normalised to background): (g) nuclear phospho-Smad1/5/8 (n = 3); (h) nuclear Smad2 (n = 3); (i) nuclear Smad3 (n = 3); (j) nuclear phospho-ERK1/2 (n = 3); (k) nuclear β-catenin (n = 3); (l) nuclear Pax6 (n = 3).
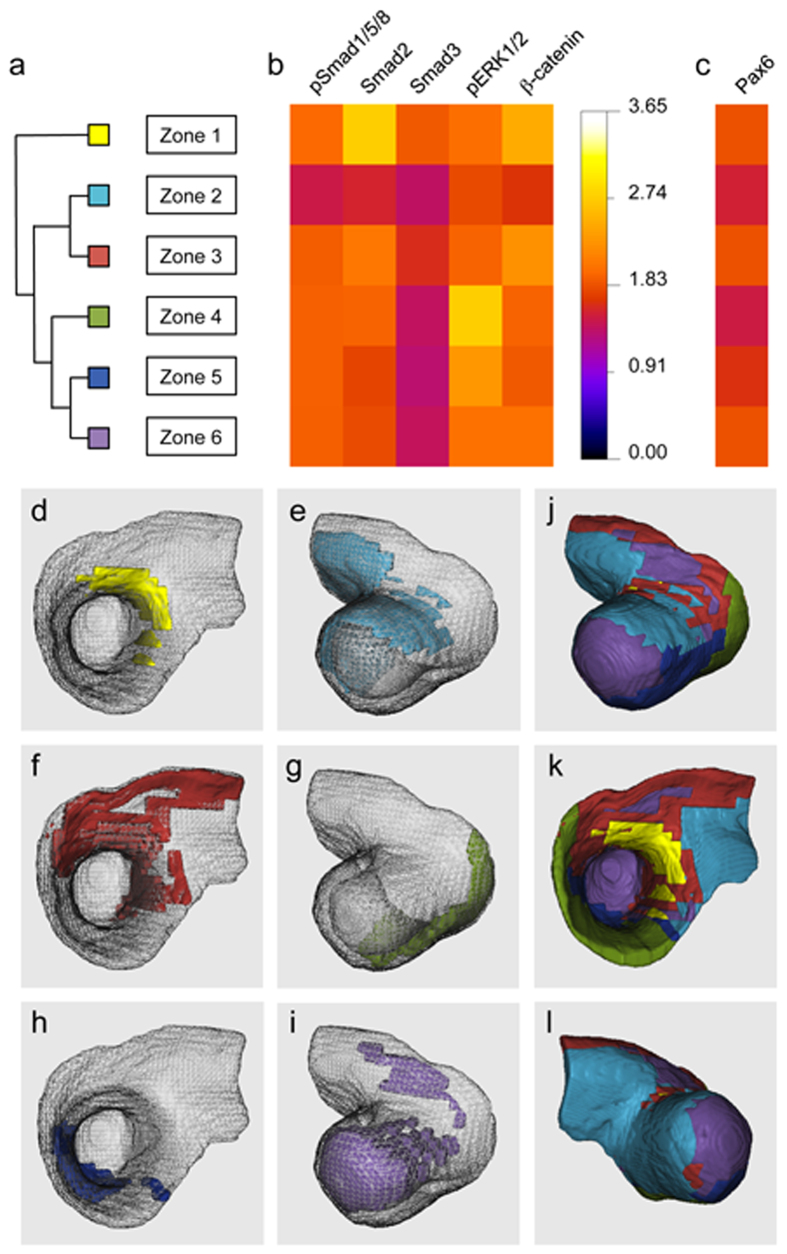
(a) Dendrogram showing the hierarchical relationship of six Optic Vesicle zones with divergent signalling profiles. (b) Heat map showing the mean nuclear signal levels (normalised to background) for each of the identified clusters/zones. (c) Heat map showing mean nuclear Pax6 level (normalised to background) for each cluster/zone. (d–i) 3D reconstruction of each of the six zones shown within the consensus Optic Vesicle morphology. (d) Zone 1, apical/medial view. (e) Zone 2, basal/dorsal-lateral view. (f) Zone 3, apical/medial view. (g) Zone 4, basal/dorsal-lateral view. (h) Zone 5, apical/medial view. (i) Zone 6, basal/dorsal-lateral view. (j–l) Three different views of the wholly reconstructed consensus Optic Vesicle morphology, colour-coded to display the six zones in (d–i). (j) Basal/dorsal-lateral view. (k) Apical/medial view. (l) Basal/caudal-lateral view.
Similar articles
-
Anatomical landmarks for registration of experimental image data to volumetric rodent brain atlasing templates.J Neurosci Methods. 2015 Jan 30;240:161-9. doi: 10.1016/j.jneumeth.2014.11.005. Epub 2014 Nov 18. J Neurosci Methods. 2015. PMID: 25445058
-
Direct non-cell autonomous Pax6 activity regulates eye development in the zebrafish.Neural Dev. 2007 Jan 17;2:2. doi: 10.1186/1749-8104-2-2. Neural Dev. 2007. PMID: 17229313 Free PMC article.
-
3D Analysis of Human Embryos and Fetuses Using Digitized Datasets From the Kyoto Collection.Anat Rec (Hoboken). 2018 Jun;301(6):960-969. doi: 10.1002/ar.23784. Epub 2018 Apr 23. Anat Rec (Hoboken). 2018. PMID: 29682894
-
3-Dimensional modelling of chick embryo eye development and growth using high resolution magnetic resonance imaging.Exp Eye Res. 2009 Oct;89(4):511-21. doi: 10.1016/j.exer.2009.05.014. Epub 2009 Jun 18. Exp Eye Res. 2009. PMID: 19540232
-
Brain templates and atlases.Neuroimage. 2012 Aug 15;62(2):911-22. doi: 10.1016/j.neuroimage.2012.01.024. Epub 2012 Jan 10. Neuroimage. 2012. PMID: 22248580 Review.
Cited by
-
Multimodal assessments of Zika virus immune pathophysiological responses in marmosets.Sci Rep. 2018 Nov 20;8(1):17125. doi: 10.1038/s41598-018-35481-6. Sci Rep. 2018. PMID: 30459473 Free PMC article.
-
The Early Stages of Heart Development: Insights from Chicken Embryos.J Cardiovasc Dev Dis. 2016 Apr 5;3(2):12. doi: 10.3390/jcdd3020012. J Cardiovasc Dev Dis. 2016. PMID: 29367563 Free PMC article. Review.
-
The Pax6 master control gene initiates spontaneous retinal development via a self-organising Turing network.Development. 2020 Dec 23;147(24):dev185827. doi: 10.1242/dev.185827. Development. 2020. PMID: 33214222 Free PMC article.
References
-
- Megason S. G. & Fraser S. E. Imaging in systems biology. Cell. 130, 784–795 (2007). - PubMed
-
- Luengo-Oroz M. A., Ledesma-Carbayo, M. J., Peyriéras, N. & Santos A. Image analysis for understanding embryo development: a bridge from microscopy to biological insights. Curr. Opin. Genet. Dev. 21, 630–637 (2011). - PubMed
Publication types
MeSH terms
Substances
LinkOut - more resources
Full Text Sources
Other Literature Sources
Medical
