Comparative Study
. 2016 Feb 11:17:82.
doi: 10.1186/s12859-016-0924-x.

Explaining the geographic spread of emerging epidemics: a framework for comparing viral phylogenies and environmental landscape data

Affiliations
Comparative Study

Explaining the geographic spread of emerging epidemics: a framework for comparing viral phylogenies and environmental landscape data

Simon Dellicour et al. BMC Bioinformatics. .

Abstract

Background: Phylogenetic analysis is now an important tool in the study of viral outbreaks. It can reconstruct epidemic history when surveillance epidemiology data are sparse, and can indicate transmission linkages among infections that may not otherwise be evident. However, a remaining challenge is to develop an analytical framework that can test hypotheses about the effect of environmental variables on pathogen spatial spread. Recent phylogeographic approaches can reconstruct the history of virus dispersal from sampled viral genomes and infer the locations of ancestral infections. Such methods provide a unique source of spatio-temporal information, and are exploited here.

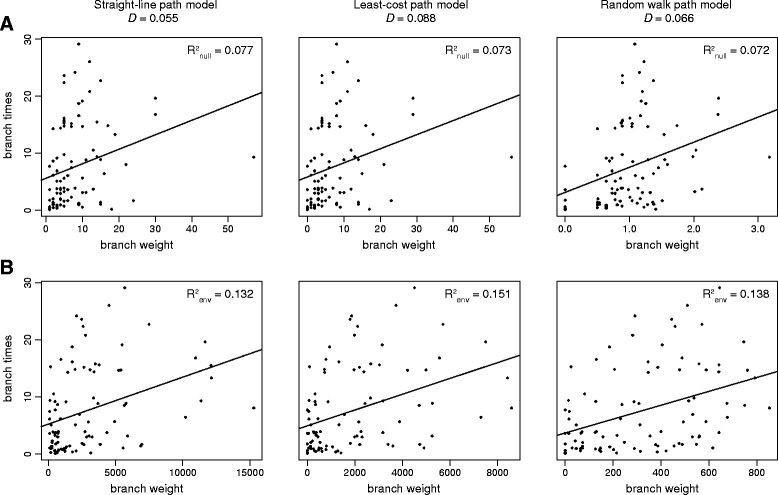
Results: We present and apply a new statistical framework that combines genomic and geographic data to test the impact of environmental variables on the mode and tempo of pathogen dispersal during emerging epidemics. First, the spatial history of an emerging pathogen is estimated using standard phylogeographic methods. The inferred dispersal path for each phylogenetic lineage is then assigned a "weight" using environmental data (e.g. altitude, land cover). Next, tests measure the association between each environmental variable and lineage movement. A randomisation procedure is used to assess statistical confidence and we validate this approach using simulated data. We apply our new framework to a set of gene sequences from an epidemic of rabies virus in North American raccoons. We test the impact of six different environmental variables on this epidemic and demonstrate that elevation is associated with a slower rabies spread in a natural population.

Conclusion: This study shows that it is possible to integrate genomic and environmental data in order to test hypotheses concerning the mode and tempo of virus dispersal during emerging epidemics.


Figures

Fig. 1
Fig. 1
An illustration of the node position randomisation procedure used to generate null distributions of the D statistic. a The original environmental raster (representing, in this case, elevation) upon which is superimposed the movement events extracted from one spatiotemporally-referenced phylogeny. b The result of one randomisation of node positions. This randomisation procedure is performed within a minimum convex hull (shown in blue), which is defined by the node locations of all selected phylogenies
Fig. 2
Fig. 2
The six environmental variables that were tested in the analysis of the raccoon rabies virus data set. The region shown corresponds to the northeast of the USA, centered approximately on Harrisburg, PA. Details of the construction and source data for these rasters is provided in the main text
Fig. 3
Fig. 3
Epidemiological statistics estimated from the raccoon rabies virus data set. a Time-series of the spatial distance between epidemic origin and maximal epidemic wavefront, and b evolution of the patristic distance between epidemic origin and maximal epidemic wavefront, c kernel density estimates of lineage velocity parameters and d kernel density estimates of lineage diffusion coefficient parameters (coefficient of variation “CV” against mean values). In parts a and b the grey area corresponds to the 95 % credible region of the estimated wavefront position. In parts c and d the three contours show, in shades of decreasing darkness, the 25 %, 50 %, and 75 % highest posterior density regions via kernel density estimation
Fig. 4
Fig. 4
Linear regressions between branch durations and branch weights for one phylogenetic tree. Plots in (a) were generated by calculating the branch weights using the “null” raster, whereas plots in (b) were generated by calculating the branch weights using the “elevation” raster treated as a resistance factor. Plots are shown for each of the three path models (straight line, least-cost, and random walk). The D value obtained under each path model is shown at the top. The plots show that the R2 of the regression is approximately doubled when spatial heterogeneity in elevation is taken into account
Fig. 5
Fig. 5
Empirical distributions of the D statistic (in grey), calculated from 100 trees sampled using Bayesian MCMC inference. These are compared with five replicates of the null distribution of D generated by the randomisation procedure (red lines). In (a) the distributions were calculated using the “elevation” raster (as a resistance factor) and in (b) they were calculated using the “forests” raster (as a conductance factor). In both cases the least-cost path model was used. For visual clarity, discrete histograms were converted into density curves using a Gaussian smoothing kernel

References

    1. Magee D, Beard R, Suchard MA, Lemey P, Scotch M. Combining phylogeography and spatial epidemiology to uncover predictors of H5N1 influenza A virus diffusion. Arch Virol. 2015;160(1):215–224. doi: 10.1007/s00705-014-2262-5. - DOI - PMC - PubMed
    1. Faria NR, Rambaut A, Suchard MA, Baele G, Bedford T, Ward MJ, et al. The early spread and epidemic ignition of HIV-1 in human populations. Science. 2014;346(6205):56–61. doi: 10.1126/science.1256739. - DOI - PMC - PubMed
    1. Corman VM, Ithete NL, Richards LR, Schoeman MC, Preiser W, Drosten C, et al. Rooting the phylogenetic tree of Middle East respiratory syndrome coronavirus by characterization of a conspecific virus from an African bat. J Virol. 2014;88(19):11297–11303. doi: 10.1128/JVI.01498-14. - DOI - PMC - PubMed
    1. Carroll MW, Matthews DA, Hiscox JA, Elmore MJ, Pollakis G, Rambaut A, et al. Temporal and spatial analysis of the 2014–2015 Ebola virus outbreak in West Africa. Nature. 2015;2015(524):97–101. doi: 10.1038/nature14594. - DOI - PMC - PubMed
    1. Gire SK, Goba A, Andersen KG, Sealfon RSG, Park DJ, Kanneh L, et al. Genomic surveillance elucidates Ebola virus origin and transmission during the 2014 outbreak. Science. 2014;345(6202):1369–1372. doi: 10.1126/science.1259657. - DOI - PMC - PubMed

Publication types