. 2016 Feb 11:6:20903.
doi: 10.1038/srep20903.

ATP-containing vesicles in stria vascular marginal cell cytoplasms in neonatal rat cochlea are lysosomes

Affiliations

ATP-containing vesicles in stria vascular marginal cell cytoplasms in neonatal rat cochlea are lysosomes

Jun Liu et al. Sci Rep. .

Abstract

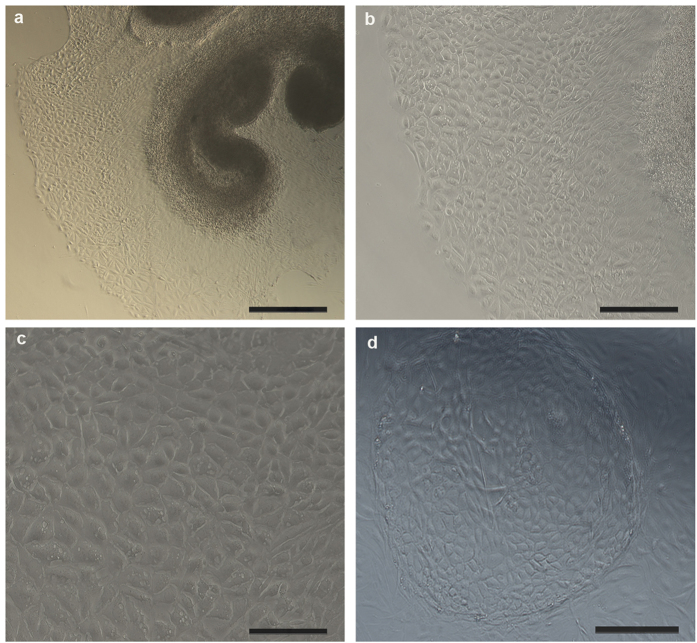
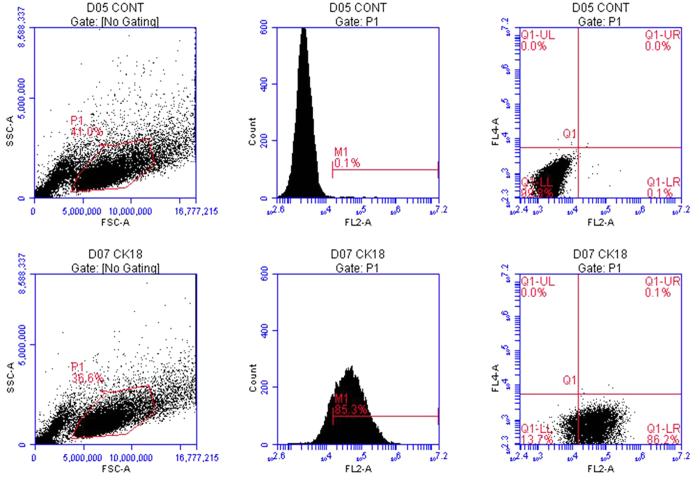
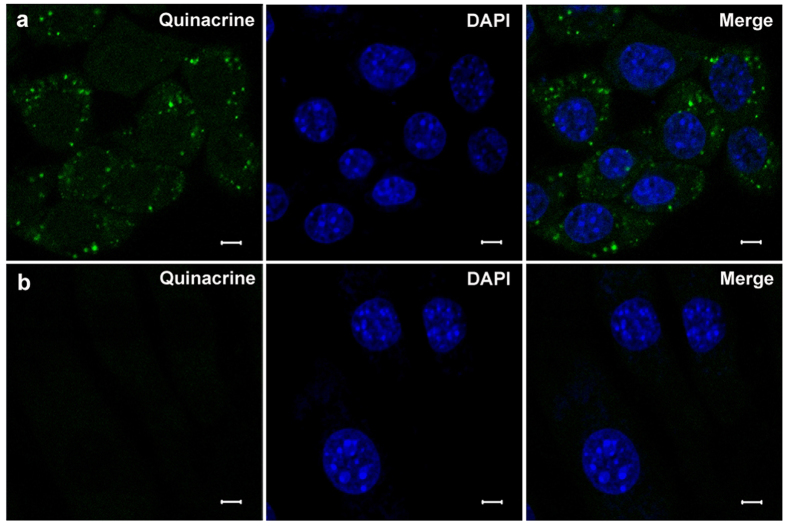
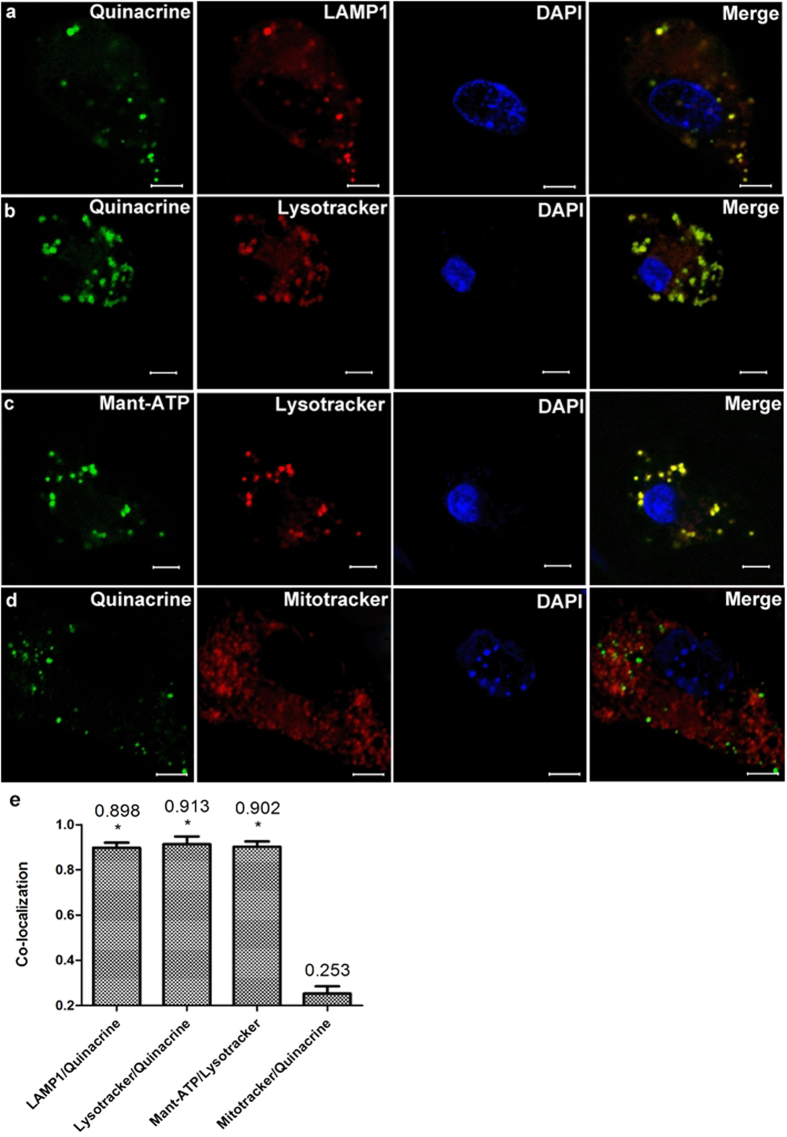
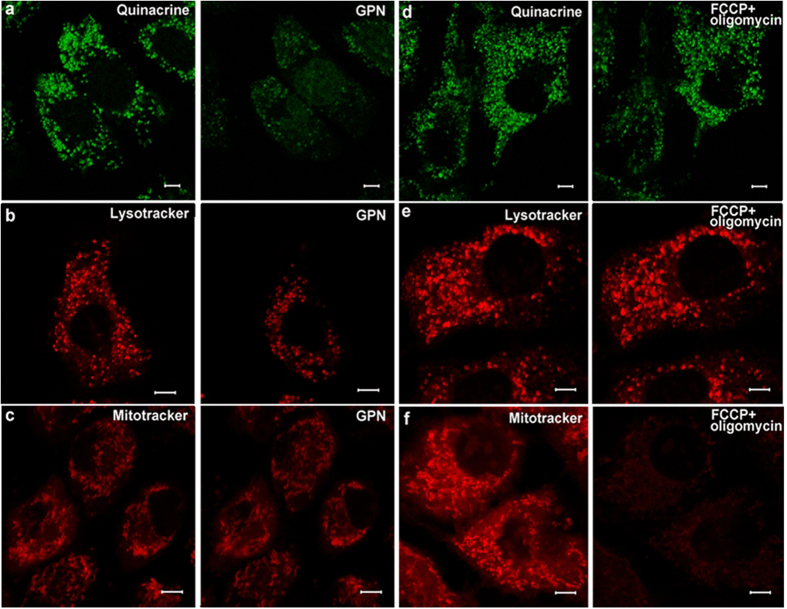
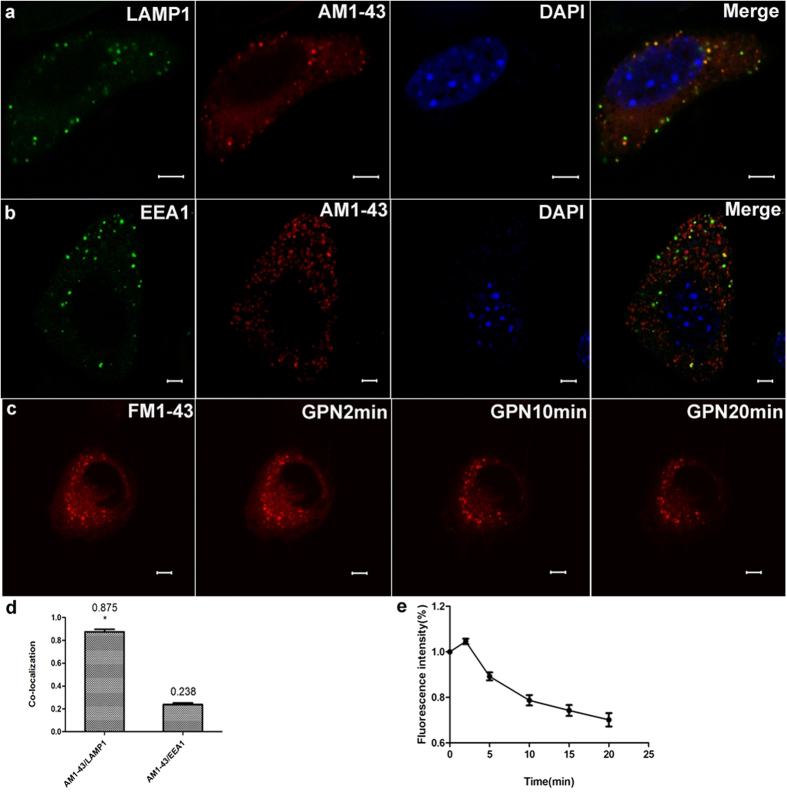
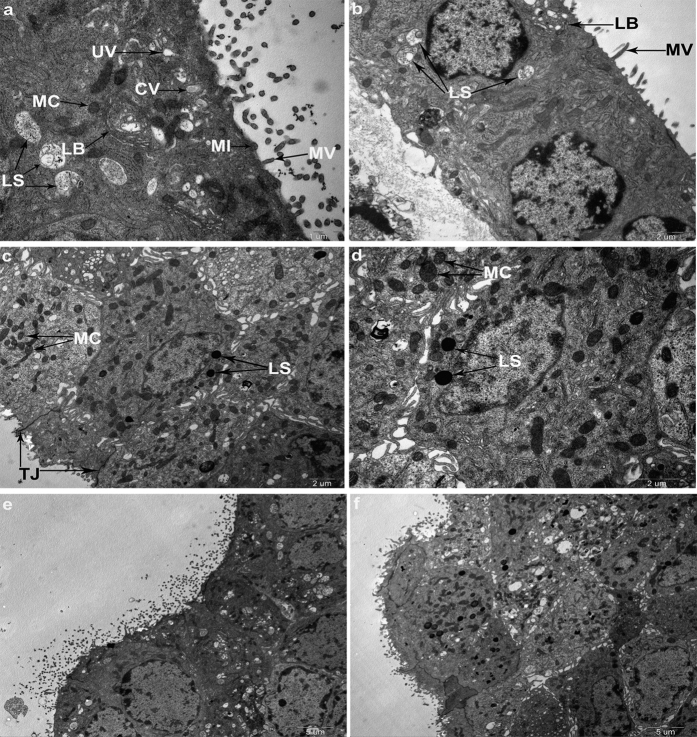
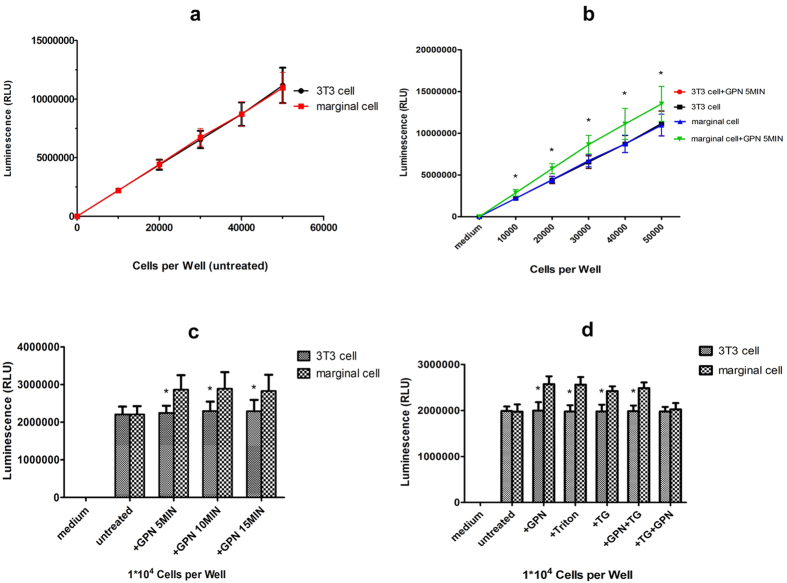
We confirmed that ATP is released from cochlear marginal cells in the stria vascular but the cell organelle in which ATP stores was not identified until now. Thus, we studied the ATP-containing cell organelles and suggest that these are lysosomes. Primary cultures of marginal cells of Sprague-Dawley rats aged 1-3 days was established. Vesicles within marginal cells stained with markers were identified under confocal laser scanning microscope and transmission electron microscope (TEM). Then ATP release from marginal cells was measured after glycyl-L-phenylalanine-ß- naphthylamide (GPN) treatment using a bioluminescent assay. Quinacrine-stained granules within marginal cells were labeled with LysoTracker, a lysosome tracer, and lysosomal-associated membrane protein 1(LAMP1), but not labeled with the mitochondrial tracer MitoTracker. Furthermore, LysoTracker-labelled puncta showed accumulation of Mant-ATP, an ATP analog. Treatment with 200 μM GPN quenched fluorescently labeled puncta after incubation with LysoTracker or quinacrine, but not MitoTracker. Quinacrine-labeled organelles observed by TEM were lysosomes, and an average 27.7 percent increase in ATP luminescence was observed in marginal cells extracellular fluid after GPN treatment. ATP-containing vesicles in cochlear marginal cells of the stria vascular from neonatal rats are likely lysosomes. ATP release from marginal cells may be via Ca(2+)-dependent lysosomal exocytosis.


Conflict of interest statement

The authors declare no competing financial interests.

Figures

Figure 1
Figure 1. Marginal cells culture under light microscope.
(a) Proliferated marginal cells grew outside the stria vascular explant and were arranged like paving stones with polygonal shape after 3 days of culture (50×), Scale bars, 400 μm. (b) Proliferated marginal cells grew outside the stria vascular explant in 3-day old cultures (100×), Scale bars, 200 μm. Larger magnification is shown in (c) (200×), Scale bars, 100 μm. (d) Proliferated marginal cells were arranged like paving stones, and formed a “cell island” in 3 day-old cultures (100×), Scale bars, 200 μm.
Figure 2
Figure 2. Verification of cultured marginal cells by flow cytometry.
Images in the first row are marginal cells treated with FITC AffiniPure Goat Anti-Mouse IgG (H+L) (negative control). The second row contains marginal cells incubated with anti-cytokeratin 18 IgG and FITC AffiniPure Goat Anti-Mouse IgG (H+L). Flow cytometry confirmed that 85.3% of the cells were cytokeratin 18-positive cells.
Figure 3
Figure 3. Positive staining of marginal cells and negative control 3T3 cells.
Row (a) Left: numerous granule-like fluorescent puncta in cultured marginal cell cytoplasm incubated with quinacrine; Middle: nuclear staining with DAPI; Right: merged image of quinacrine and DAPI staining. Row (b) Left: The fluorescent puncta did not appear in 3T3 cells (negative control) in the cytoplasm at the same background fluorescence; Middle: nuclear staining with DAPI; Right: merged image of quinacrine and DAPI staining. Scale bars, 5 μm.
Figure 4
Figure 4. Incubation of marginal cells with specific markers for lysosomes or mitochondria.
Row (a) Left 1: numerous green granules stained by quinacrine appeared in a marginal cell; Left 2: red granules immunostained with LAMP1 were observed in the same cell; Right 1: the cell nucleus stained with DAPI; Right 2: merged image of quinacrine, LAMP1 and DAPI cell staining indicated co-localization of quinacrine with LAMP1 puncta. Row (b) Left 1: green granules stained by quinacrine in a marginal cell; Left 2: red granules labeled by LysoTracker® Deep Red in the same cell; Right 1: the cell nucleus stained with DAPI; Right 2: merged image of quinacrine, LysoTracker and DAPI staining of the cell indicate co-localization of quinacrine with LysoTracker puncta. Row (c) Left 1: green granules stained by Mant-ATP in a marginal cell; Left 2: red granules labeled by LysoTracker® Deep Red in the same cell; Right 1: the cell nucleus stained with DAPI; Right 2: merged image of Mant-ATP, LysoTracker and DAPI staining of the cell showed co-localization of Mant-ATP with LysoTracker puncta. Row (d) Left 1: green granules stained by quinacrine in a marginal cell; Left 2: red granules labeled by MitoTracker® Red CMXRos in the same cell; Right 1: the cell nucleus stained with DAPI; Right 2: merged image of quinacrine, MitoTracker and DAPI staining of the cell showed no co-localization of quinacrine with MitoTracker puncta. Scale bars, 5 μm. (e) Summary of the co-localization of quinacrine or Mant-ATP with different specific markers. The number above each column refers to mean co-localization coefficient. 5 images obtained from 5 independent experiments were calculated for co-localization analysis in each group, error bars indicate SD. (*P < 0.01 compared with Mitotracker/Quinacrine, independent samples t-test). The merge images of quinacrine/LAMP1, quinacrine/LysoTracker or Mant-ATP /LysoTracker showed a high proportion of co-localization.
Figure 5
Figure 5. Images of puncta labeled by dyes treated with 200 μM GPN or FCCP (1 μM) + oligomycin (10 μM) for 15 min.
Row (a) Left: green fluorescent punctas in the cytoplasm in a cultured marginal cell incubated with quinacrine; Right: Quinacrine stained puncta was quenched after treatment with 200 μM GPN for 15 min. Row (b) Left: red punctas in a cultured marginal cell after incubation with LysoTracker® Deep Red; Right: LysoTracker stained puncta within the cell was attenuated after treatment with 200 μM GPN for 15 min. Row (c) Left: red punctas revealed mitochondria in cultured marginal cells incubated with MitoTracker® Red CMXRos; Right: Red fluorescence did not change after treatment with 200 μM GPN for 15 min. Row (d) Left: green fluorescent punctas in the cytoplasm in cultured marginal cells incubated with quinacrine; Right: Quinacrine stained puncta did not change in cells after treatment with FCCP(1 μM) + oligomycin (10 μM) for 15 min. Row (e) Left: red punctas in cultured marginal cells after incubation with LysoTracker® Deep Red; Right: LysoTracker stained puncta within the cell did not change after treatment with FCCP(1 μM) + oligomycin (10 μM). Row (f) Left: red punctas revealed mitochondria in cultured marginal cells incubated with MitoTracker® Red CMXRos; Right: red punctas vanished after treatment with FCCP(1 μM) + oligomycin (10 μM).
Figure 6
Figure 6. Incubation of marginal cells with FM dyes selectively labels lysosomes and GPN-evoked lysosomal exocytosis in marginal cells.
Row (a) Left 1: green granules immunostained with LAMP1 appeared in a marginal cell; Left 2: red granules labeled by AM1-43 were observed in the same cell; Right 1: the cell nucleus stained with DAPI; Right 2: merged image of LAMP1, AM1-43 and DAPI cell staining indicated co-localization of LAMP1 and AM1-43 puncta. Row (b) Left 1: green granules immunostained with EEA1 appeared in a marginal cell; Left 2: red granules labeled by AM1-43 were observed in the same cell; Right 1: the cell nucleus stained with DAPI; Right 2: merged image of LAMP1, AM1-43 and DAPI cell staining indicated no co-localization of EEA1 and AM1-43 puncta. Scale bars, 5 μm. Row (c) Left1: red fluorescent punctas in the cytoplasm in a cultured marginal cell incubated with FM1-43; Left 2: increased staining was monitored in 2 minutes after GPN stimulation; Right 1: decreased staining was monitored after treatment with 200 μM GPN for 10 min. Right 2: decreased staining was monitored after treatment with 200 μM GPN for 20 min. Scale bars, 5 μm. (d) Summary of the co-localization of AM1-43 with different specific markers. The number above each column refers to mean co-localization coefficient. 5 images obtained from 5 independent experiments were calculated for co-localization analysis in each group, error bars indicate SD. (*P < 0.01 compared with AM1-43/EEA1, independent samples t-test). The merge images of AM1-43/LAMP1 showed a high proportion of co-localization. (e) Summary of fluorescence intensity of marginal cells incubated with FM1-43 after GPN stimulation. n = 5, error bars indicate SD.
Figure 7
Figure 7. TEM revealed characteristics of marginal cells and lysosomal exocytosis.
(a) TEM photograph shows characteristics of the marginal cell. Arrows indicate lysosomes (LS), mitochondria (MC), coated vesicles (CV), uncoated vesicles (UV), small invaginations (MI), microvilli-like extensions (MV), lamellar bodies (LB), respectively. Scale bars, 1 μm. (b) Marginal cells under TEM. Arrows indicate LS, MV and LB, respectively. Scale bars, 2 μm. (c,d) TEMs of marginal cells loaded with quinacrine for 30 min. Arrows indicate quinacrine labeled lysosomes and unlabeled mitochondria. Neighboring cells were connected with tight junctions. Scale bars, 2 μm. (e,f) Lysosomal exocytosis was observed in marginal cells that contained granules stained with quinacrine. TEM showed the characteristics of the marginal cells and lysosomal exocytosis. A coated omega-shaped invagination was found in the apical plasma membrane of the marginal cells (e). Scale bars, 5 μm.
Figure 8
Figure 8. ATP release from marginal cells after treatment with GPN, Triton, TG, GPN + TG.
(a) A direct relationship between luminescence kit and the number of 3T3 cells (r1) or marginal cells (r2) from 0 to 50,000. r12 = 0.9996, r22 = 0.9997 (b) Treatment with 200 μM GPN resulted in an increase of average 27.7% of luminescence in serial fivefold dilutions of marginal cells compared with 3T3 control (n = 12, *P < 0.01, independent samples t-test). Error bars indicate SD. (c) Time course of ATP release in marginal cells and 3T3 cells after 200 μM GPN exposure (n = 12, *P < 0.01, independent samples t-test). Error bars indicate SD. (d) Respective treatment with different reagents (200 μM GPN, 1% Triton X-100, 10 μM TG, 200 μM GPN + 5 μM TG) for 5 min resulted in ATP release from marginal cells compared with 3T3 control (n = 12, *P < 0.01, independent samples t-test). However, GPN (200 μM) did not cause ATP release from marginal cells compared with 3T3 control after TG treatment (5 μM) for 5 min (n = 12, P > 0.05, independent samples t-test). Error bars indicate SD.

Similar articles

Cited by

References

    1. Tritsch N. X., Yi E., Gale J. E., Glowatzki E. & Bergles D. E. The origin of spontaneous activity in the developing auditory system. Nature 450, 50–55 (2007). - PubMed
    1. Housley G. D. Extracellular nucleotide signaling in the inner ear. Mol Neurobiol. 16, 21–48 (1998). - PubMed
    1. Housley G. D. et al. Expression of the P2X(2) receptor subunit of the ATP-gated ion channel in the cochlea: implications for sound transduction and auditory neurotransmission. J Neurosci. 19, 8377–8388 (1999). - PMC - PubMed
    1. Thorne P. R. et al. Potential role of purinergic signalling in cochlear pathology. Audiol Neurootol. 7, 180–184 (2002). - PubMed
    1. Vlajkovic S. M. et al. Noise exposure induces up-regulation of ecto-nucleoside triphosphate diphosphohydrolases 1 and 2 in rat cochlea. Neuroscience. 126, 763–773 (2004). - PubMed

Publication types

MeSH terms