. 2016 Feb 11:15:17.
doi: 10.1186/s12940-016-0115-2.

Impact of ambient fine particulate matter (PM2.5) exposure on the risk of influenza-like-illness: a time-series analysis in Beijing, China

Affiliations

Impact of ambient fine particulate matter (PM2.5) exposure on the risk of influenza-like-illness: a time-series analysis in Beijing, China

Cindy Feng et al. Environ Health. .

Abstract

Background: Air pollution in Beijing, especially PM2.5, has received increasing attention in the past years. Although exposure to PM2.5 has been linked to many health issues, few studies have quantified the impact of PM2.5 on the risk of influenza-like illness (ILI). The aim of our study is to investigate the association between daily PM2.5 and ILI risk in Beijing, by means of a generalized additive model.

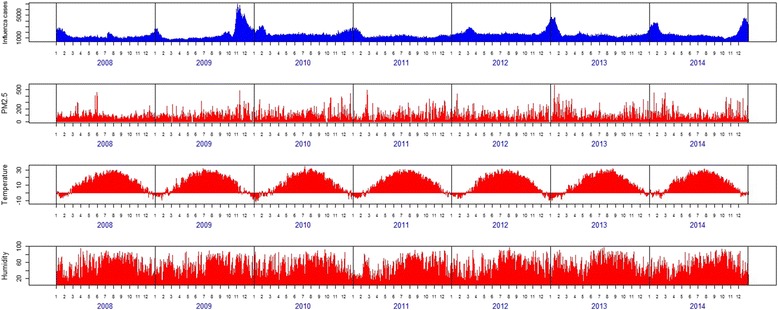
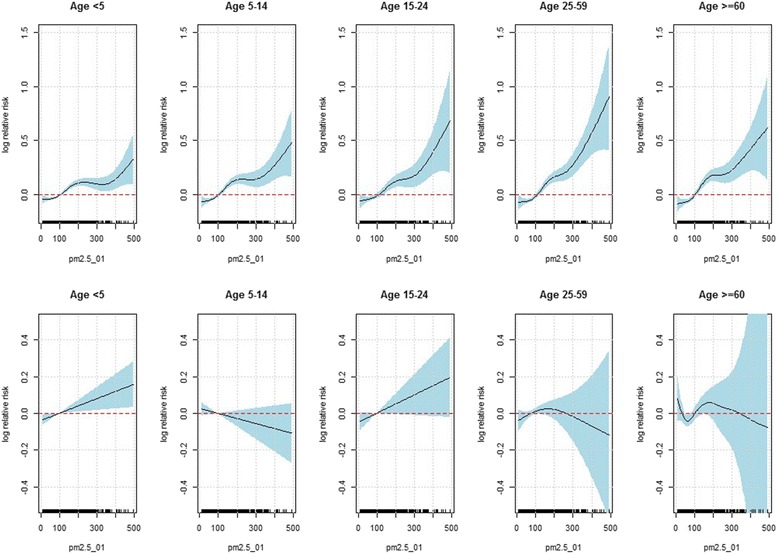
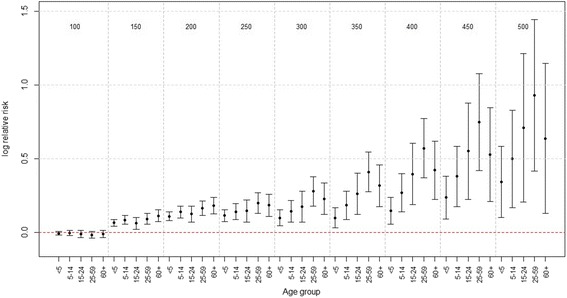
Methods: Daily PM2.5, meteorological factors, and influenza-like illness (ILI) counts during January 1, 2008 to December 31, 2014 were retrieved. An inverse Gaussian generalized additive model with log link function was used to flexibly model the nonlinear relationship between the PM2.5 (single- and multiday lagged exposure) and ILI risk, adjusted for the weather conditions, seasonal and year trends. We also assessed if the effect of PM2.5 differs during flu season versus non-flu season by including the interaction term between PM2.5 and flu season in the model. Furthermore, a stratified analysis by age groups was conducted to investigate how the effect of PM2.5 differs across age groups.

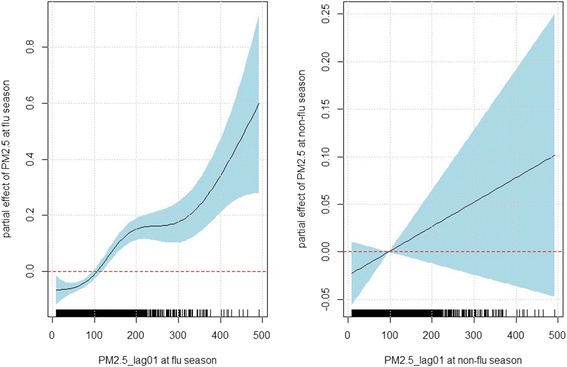
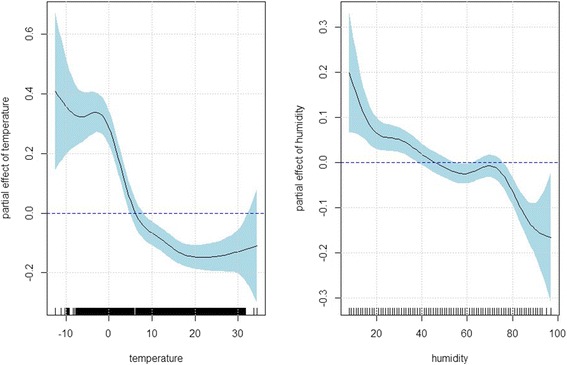
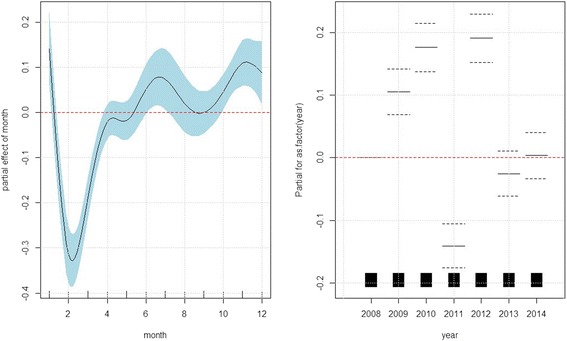
Results: Our findings suggested a strong positive relationships between PM2.5 and ILI risk at the flu season (October-April) (p-value < 0.001), after adjusting for the effects of ambient daily temperature and humidity, month and year; whereas no significant association was identified at the non-flu season (May-September) (p-value = 0.174). A short term delayed effect of PM2.5 was also identified with 2-day moving average (current day to the previous day) of PM2.5 yielding the best predictive power. Furthermore, PM2.5 was strongly associated with ILI risk across all age groups (p-value < 0.001) at the flu season, but the effect was the most pronounced among adults (age 25-59), followed by young adults (age 15-24), school children (age 5-14) and the elderly (age 60+) and the effect of PM2.5 was the least pronounced for children under 5 years of age (age < 5).

Conclusions: Ambient PM2.5 concentrations were significantly associated with ILI risk in Beijing at the flu season and the effect of PM2.5 differed across age groups, in Beijing, China.


Figures

Fig. 1
Fig. 1
The time course of daily influenza cases, daily PM2.5, daily temperature and average humidity from January 1, 2008 to December 31, 2014
Fig. 2
Fig. 2
The panels display the estimated partial effect of 2-day moving average (current day to the previous day) of PM2.5 at the flu season (October-April) and non-flu season (May-September), based on the inverse Gaussian generalized additive model: logμt=α0+lognt+f1PM2.5,lag01Ifluseasont+f2PM2.5,lag01Inonfluseasont+f3temperaturet+f4humidityt+f5montht+kβkIyeart=k. The X-axis is the PM2.5 concentration (2-day moving average). The solid lines indicate the estimated log relative risk of ILI and the dashed lines indicate the corresponding 95 % confidence intervals
Fig. 3
Fig. 3
The panels display the estimated partial effect of temperature and humidity based on the inverse Gaussian generalized additive model: logμt=α0+lognt+f1PM2.5,lag01Ifluseasont+f2PM2.5,lag01Inonfluseasont+f3temperaturet+f4humidityt+f5montht+kβkIyeart=k. The x-axis tick labels in the panels represent the observed values temperature and humidity, respectively. The solid lines indicate the estimated log relative risk of ILI and the dashed lines indicate the corresponding 95 % confidence intervals
Fig. 4
Fig. 4
The panels display the estimated partial effect for month and year, based on the inverse Gaussian generalized additive model: logμt=α0+lognt+f1PM2.5,lag01Ifluseasont+f2PM2.5,lag01Inonfluseasont+f3temperaturet+f4humidityt+f5montht+kβkIyeart=k. The solid lines indicate the estimated log relative risk of ILI and the dashed lines indicate the corresponding 95 % confidence intervals. For the effect of year, year 2008 is set as baseline
Fig. 5
Fig. 5
Estimated partial effect of PM2.5 based on the stratified analysis for each age group at the flu season (top panels) and non-flu season (bottom panels), based on the inverse Gaussian generalized additive model: logμt=α0+lognt+f1PM2.5,lag01Ifluseasont+f2PM2.5,lag01Inonfluseasont+f3temperaturet+f4humidityt+f5montht+kβkIyeart=k. The X-axis is the PM2.5 concentration (2-day moving average). The solid lines indicate the estimated log relative risk of ILI and the dashed lines indicate the corresponding 95 % confidence intervals
Fig. 6
Fig. 6
The log relative risk of ILI in association with PM2.5 when PM2.5 was set as 100 μg/m 3 to 500 μg/m 3 at an increment of 50 μg/m 3, by age groups, when all the other covariates were held at their mean levels

Similar articles

Cited by

References

    1. Polichetti G, Cocco S, Spinali A, Trimarco V, Nunziata A. Effects of particulate matter (PM(10), PM(2.5) and PM(1)) on the cardiovascular system. Toxicology. 2009;261(1-2):1–8. doi: 10.1016/j.tox.2009.04.035. - DOI - PubMed
    1. Janssen NA, Fischer P, Marra M, Ameling C, Cassee FR. Short-term effects of PM2.5, PM10 and PM2.5-10 on daily mortality in The Netherlands. Sci Total Environ. 2013;463–464:20–26. doi: 10.1016/j.scitotenv.2013.05.062. - DOI - PubMed
    1. Brunekreef B, Holgate ST. Air pollution and health. Lancet (London, England) 2002;360(9341):1233–1242. doi: 10.1016/S0140-6736(02)11274-8. - DOI - PubMed
    1. Delfino RJ, Sioutas C, Malik S. Potential role of ultrafine particles in associations between airborne particle mass and cardiovascular health. Environ Health Perspect. 2005;113(8):934–946. doi: 10.1289/ehp.7938. - DOI - PMC - PubMed
    1. Laden F, Neas LM, Dockery DW, Schwartz J. Association of fine particulate matter from different sources with daily mortality in six U.S. cities. Environ Health Perspect. 2000;108(10):941–947. doi: 10.1289/ehp.00108941. - DOI - PMC - PubMed

Publication types