

Temporal retinal transcriptome and systems biology analysis identifies key pathways and hub genes in Staphylococcus aureus endophthalmitis
- PMID: 26865111
- PMCID: PMC4749995
- DOI: 10.1038/srep21502
Temporal retinal transcriptome and systems biology analysis identifies key pathways and hub genes in Staphylococcus aureus endophthalmitis
Abstract
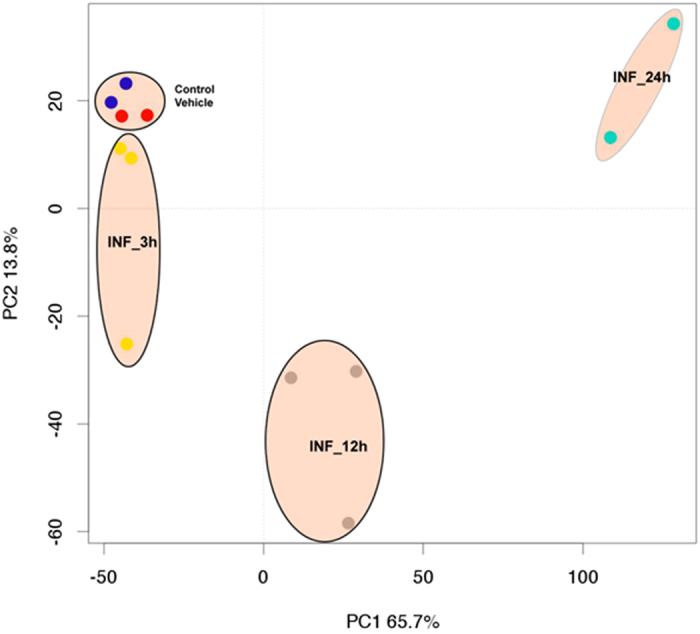
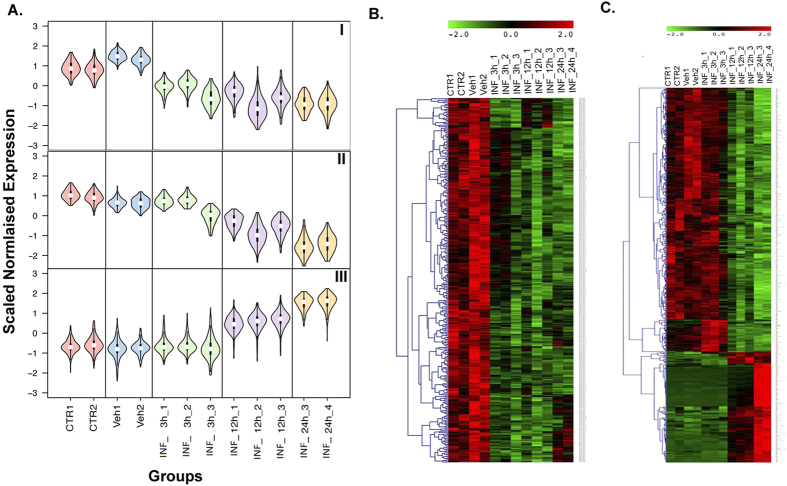
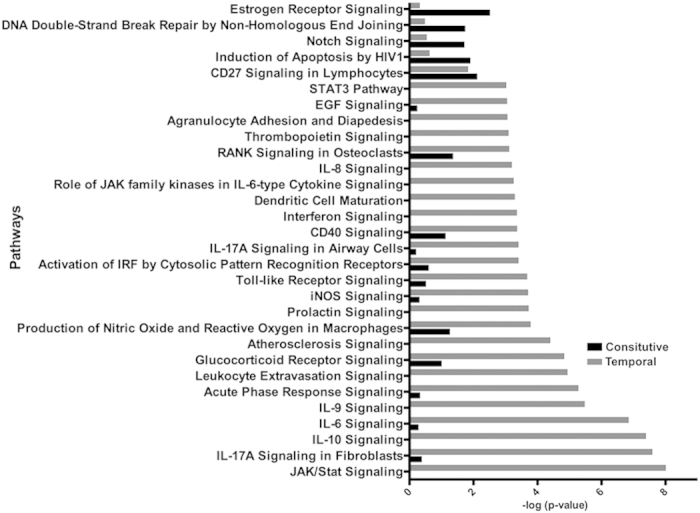
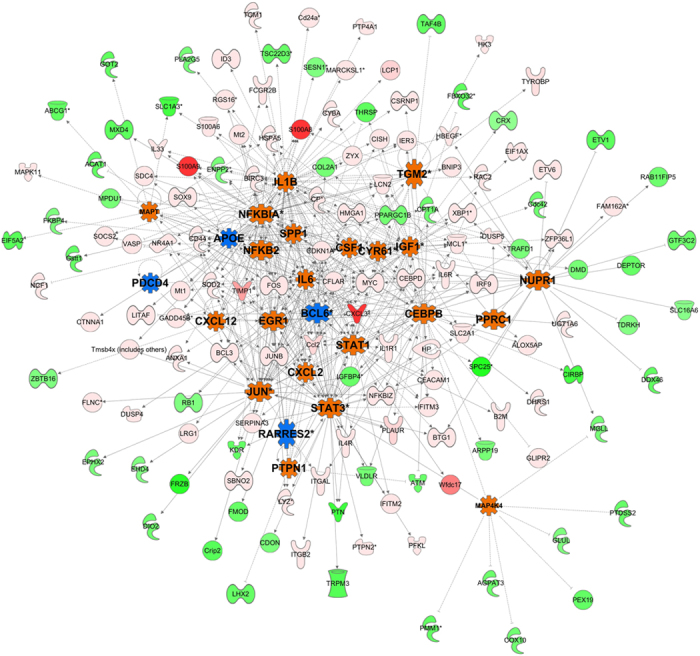
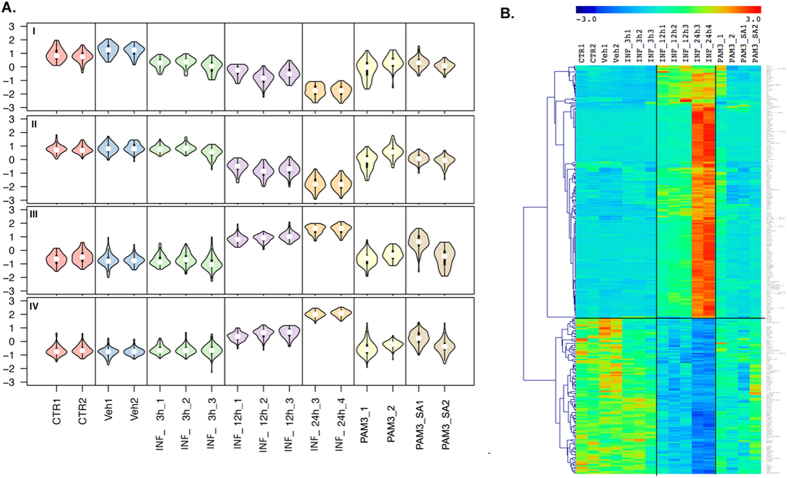
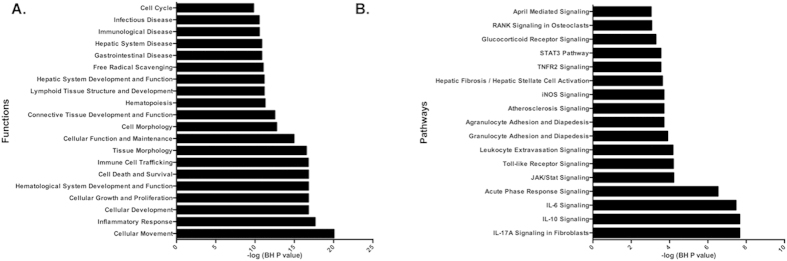
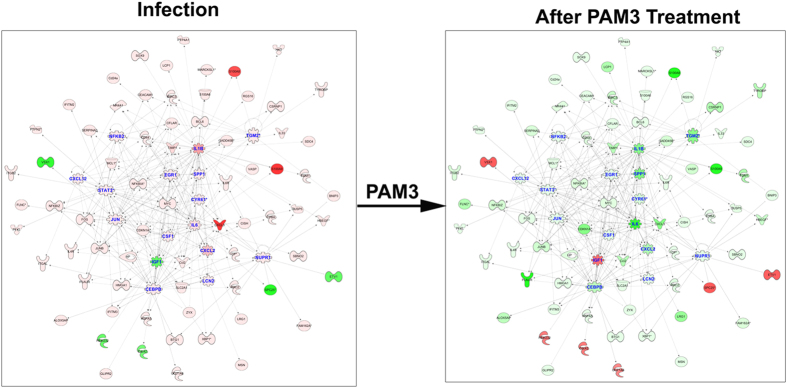
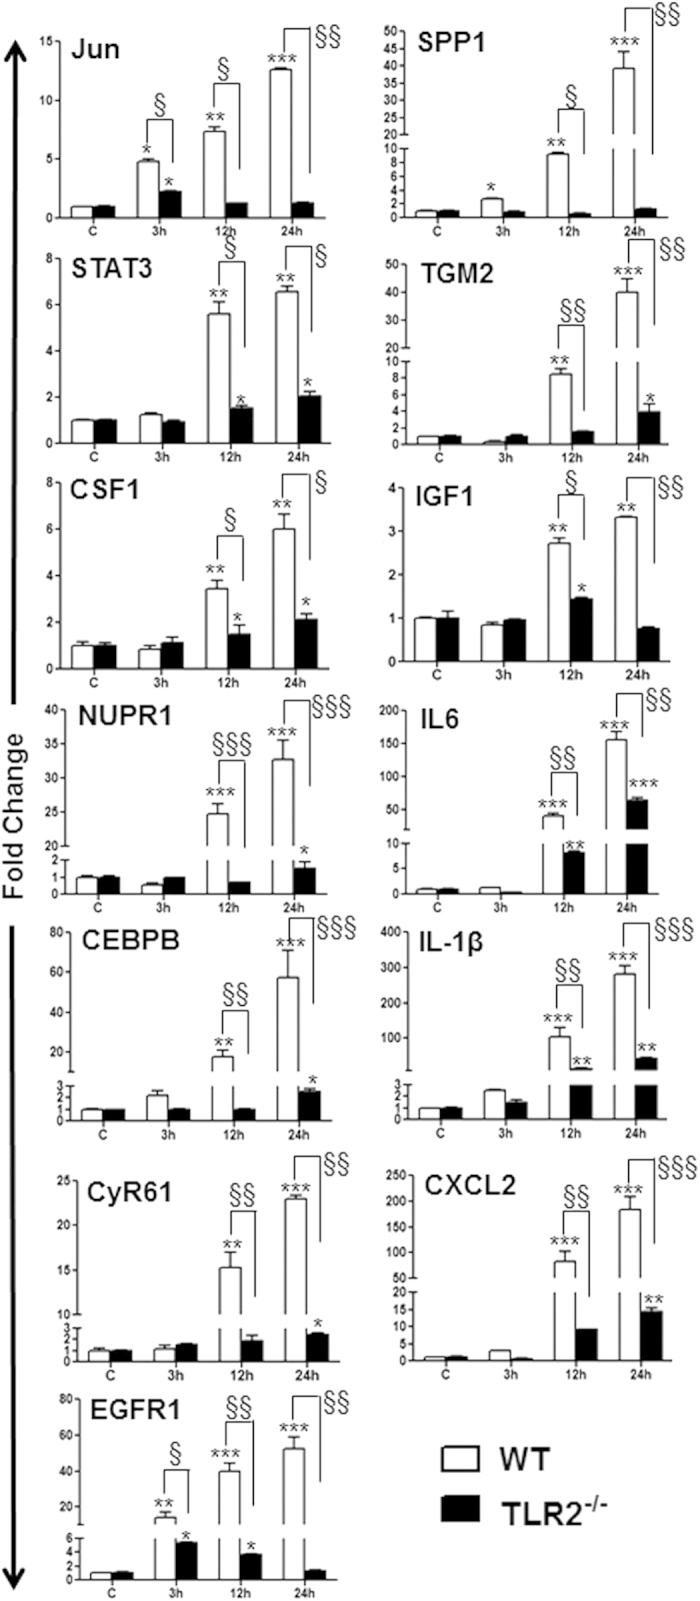
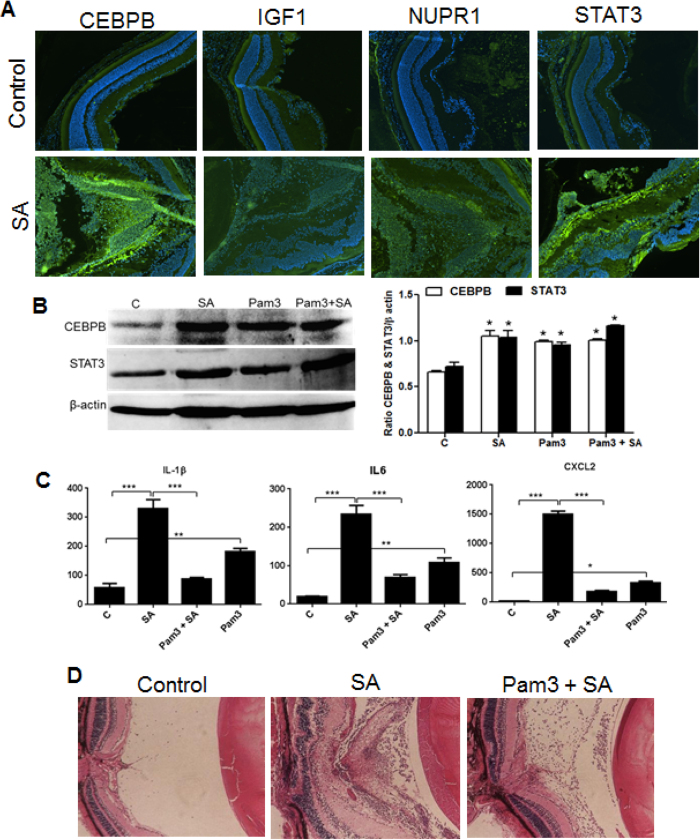
Bacterial endophthalmitis remains a devastating inflammatory condition associated with permanent vision loss. Hence, assessing the host response in this disease may provide new targets for intervention. Using a mouse model of Staphylococcus aureus (SA) endophthalmitis and performing retinal transcriptome analysis, we discovered progressive changes in the expression of 1,234 genes. Gene ontology (GO) and pathway analyses revealed the major pathways impacted in endophthalmitis includes: metabolism, inflammatory/immune, antimicrobial, cell trafficking, and lipid biosynthesis. Among the immune/inflammation pathways, JAK/Stat and IL-17A signaling were the most significantly affected. Interactive network-based analyses identified 13 focus hub genes (IL-6, IL-1β, CXCL2, STAT3, NUPR1, Jun, CSF1, CYR61, CEBPB, IGF-1, EGFR1, SPP1, and TGM2) within these important pathways. The expression of hub genes confirmed by qRT-PCR, ELISA (IL-6, IL-1β, and CXCL2), and Western blot or immunostaining (CEBP, STAT3, NUPR1, and IGF1) showed strong correlation with transcriptome data. Since TLR2 plays an important role in SA endophthalmitis, counter regulation analysis of TLR2 ligand pretreated retina or the use of retinas from TLR2 knockout mice showed the down-regulation of inflammatory regulatory genes. Collectively, our study provides, for the first time, a comprehensive analysis of the transcriptomic response and identifies key pathways regulating retinal innate responses in staphylococcal endophthalmitis.
Conflict of interest statement
The authors declare no competing financial interests.
Figures
Similar articles
-
Toll-like receptor 2 (TLR2) engages endoplasmic reticulum stress sensor IRE1α to regulate retinal innate responses in Staphylococcus aureus endophthalmitis.FASEB J. 2020 Oct;34(10):13826-13838. doi: 10.1096/fj.202001393R. Epub 2020 Aug 19. FASEB J. 2020. PMID: 32813318 Free PMC article.
-
In Vivo Role of TLR2 and MyD88 Signaling in Eliciting Innate Immune Responses in Staphylococcal Endophthalmitis.Invest Ophthalmol Vis Sci. 2015 Feb 12;56(3):1719-32. doi: 10.1167/iovs.14-16087. Invest Ophthalmol Vis Sci. 2015. PMID: 25678692 Free PMC article.
-
5-Aminoimidazole-4-carboxamide ribonucleoside-mediated adenosine monophosphate-activated protein kinase activation induces protective innate responses in bacterial endophthalmitis.Cell Microbiol. 2016 Dec;18(12):1815-1830. doi: 10.1111/cmi.12625. Epub 2016 Jul 26. Cell Microbiol. 2016. PMID: 27264993 Free PMC article.
-
Experimental staphylococcal endophthalmitis.Ophthalmologica. 2001 Sep-Oct;215(5):321-36. doi: 10.1159/000050882. Ophthalmologica. 2001. PMID: 11528258 Review.
-
Immunology of Staphylococcal biofilm infections in the eye: new tools to study biofilm endophthalmitis.DNA Cell Biol. 2002 May-Jun;21(5-6):405-13. doi: 10.1089/10445490260099692. DNA Cell Biol. 2002. PMID: 12167243 Review.
Cited by
-
Integrative metabolomics and transcriptomics identifies itaconate as an adjunct therapy to treat ocular bacterial infection.Cell Rep Med. 2021 May 18;2(5):100277. doi: 10.1016/j.xcrm.2021.100277. eCollection 2021 May 18. Cell Rep Med. 2021. PMID: 34095879 Free PMC article.
-
TLR4 modulates inflammatory gene targets in the retina during Bacillus cereus endophthalmitis.BMC Ophthalmol. 2018 Apr 16;18(1):96. doi: 10.1186/s12886-018-0764-8. BMC Ophthalmol. 2018. PMID: 29661181 Free PMC article.
-
Transcriptomics and systems biology identify non-antibiotic drugs for the treatment of ocular bacterial infection.iScience. 2022 Aug 2;25(9):104862. doi: 10.1016/j.isci.2022.104862. eCollection 2022 Sep 16. iScience. 2022. PMID: 36034221 Free PMC article.
-
Dual RNA-seq study of the dynamics of coding and non-coding RNA expression during Clostridioides difficile infection in a mouse model.mSystems. 2024 Dec 17;9(12):e0086324. doi: 10.1128/msystems.00863-24. Epub 2024 Nov 27. mSystems. 2024. PMID: 39601557 Free PMC article.
-
Toll-like receptor 2 (TLR2) engages endoplasmic reticulum stress sensor IRE1α to regulate retinal innate responses in Staphylococcus aureus endophthalmitis.FASEB J. 2020 Oct;34(10):13826-13838. doi: 10.1096/fj.202001393R. Epub 2020 Aug 19. FASEB J. 2020. PMID: 32813318 Free PMC article.
References
-
- Chiquet C. et al. Eubacterial PCR for bacterial detection and identification in 100 acute postcataract surgery endophthalmitis. Invest Ophthalmol Vis Sci 49, 1971–1978 (2008). - PubMed
Publication types
MeSH terms
Substances
Grants and funding
LinkOut - more resources
Full Text Sources
Other Literature Sources
Medical
Molecular Biology Databases
Research Materials
Miscellaneous
