. 2016 Apr;57(4):660-70.
doi: 10.1111/epi.13335. Epub 2016 Feb 10.

Profile of retigabine-induced neuronal apoptosis in the developing rat brain

Affiliations

Profile of retigabine-induced neuronal apoptosis in the developing rat brain

Lindsay Brown et al. Epilepsia. 2016 Apr.

Abstract

Objective: Acute neonatal exposure to some, but not all, anticonvulsant drugs induces a profound increase in neuronal apoptosis in rats. Phenobarbital and phenytoin induce apoptosis at a therapeutically relevant dose range, lamotrigine and carbamazepine do so only at supratherapeutic doses or in polytherapy, and valproate does so even at subtherapeutic doses. Levetiracetam is devoid of pro-apoptotic effects. Retigabine, a new-generation drug, acts uniquely by enhancing the M-type potassium current. Because its safety profile in developing animals is unstudied, we sought to determine if retigabine would induce apoptosis.

Methods: Postnatal day (P) 7 rat pups were treated with retigabine (5-30 mg/kg), vehicle (saline), or comparator drugs (phenobarbital, lamotrigine, levetiracetam, or carbamazepine). Cell death was assessed using amino-cupric-silver staining. A separate group of animals was treated repeatedly (three times over 24 h) with retigabine (15 mg/kg) or vehicle. To establish a pharmacokinetic profile for retigabine, we measured plasma and brain levels after drug treatment.

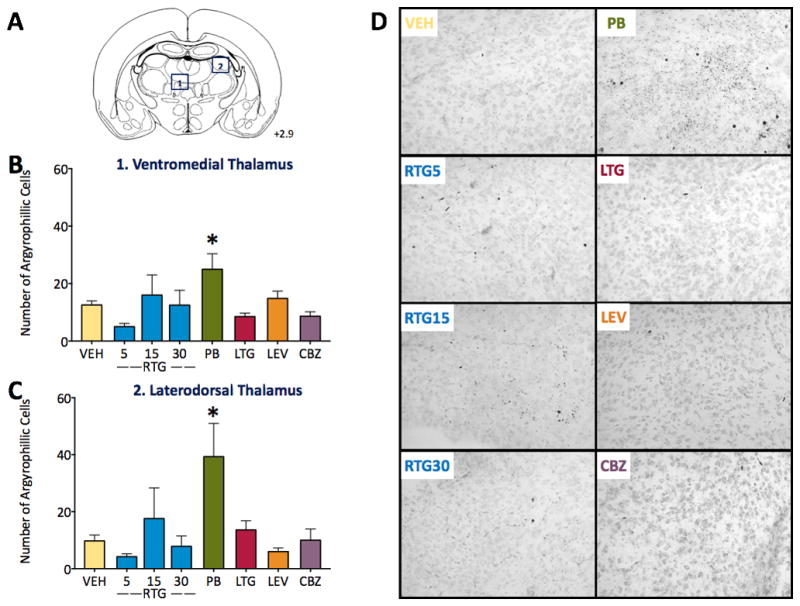
Results: Consistent with prior studies from our group and others, we found phenobarbital-induced cell death throughout thalamus, nucleus accumbens, and several neocortical areas. By contrast, levetiracetam, lamotrigine, and carbamazepine were found to have no appreciable apoptotic effect on the aforementioned structures. Acute (single) exposure to retigabine, even at doses of 30 mg/kg, was also without effect on apoptosis. However, repeated (three times) exposure to retigabine triggered apoptosis in a subset of brain areas. The half-life of retigabine in plasma was 2.5 h, with appreciable concentrations reached in the brain within 1 h of administration.

Significance: These data demonstrate that retigabine, like many other anticonvulsant drugs, is capable of triggering neuronal apoptosis in the developing rat brain. Unlike other drugs, repeated dosing of retigabine was necessary to induce this effect. This may be due to its shorter half-life as compared to other drugs, such as phenobarbital.

Keywords: Cell death; Gestational; Neonatal; Teratogen.


Conflict of interest statement

of Conflicts of Interest No authors report conflicts of interest.

Figures

Figure 1
Figure 1. Profile of cell death induced in orbitofrontal cortex
(A) Number of silver stained neurons as a function of treatment: vehicle (VEH), retigabine (RTG, 5, 15, and 30 mg/kg), phenobarbital (PB, 75 mg/kg), lamotrigine (LTG, 20 mg/kg), levetiracetam (LEV, 200 mg/kg), and carbamazepine (CBZ, 100 mg/kg). * indicates significantly (P<0.05) greater than VEH. (B) Atlas plane showing the approximate location of the region analyzed, with location relative to bregma. (C) Representative photomicrographs for each treatment. rf = rhinal fissure. Bars show means + standard error of the mean.
Figure 2
Figure 2. Profile of cell death induced in the nucleus accumbens
(A) Number of silver stained neurons as a function of treatment: vehicle (VEH), retigabine (RTG, 5, 15, and 30 mg/kg), phenobarbital (PB, 75 mg/kg), lamotrigine (LTG, 20 mg/kg), levetiracetam (LEV, 200 mg/kg), and carbamazepine (CBZ, 100 mg/kg). * indicates significantly (P<0.05) greater than VEH. (B) Atlas plane showing the approximate location of the region analyzed. (C) Representative photomicrographs for each treatment, with location relative to bregma. ac = anterior commissure is outlined in each section. Bars show means + standard error of the mean.
Figure 3
Figure 3. Profile of cell death induced in the thalamus
(A) Atlas plane showing the approximate location of the region analyzed, with location relative to bregma. (B) Number of silver stained neurons in ventromedial thalamus as a function of treatment: vehicle (VEH), retigabine (RTG, 5, 15, and 30 mg/kg), phenobarbital (PB, 75 mg/kg), lamotrigine (LTG, 20 mg/kg), levetiracetam (LEV, 200 mg/kg), and carbamazepine (CBZ, 100 mg/kg). (C) Number of silver stained neurons in laterodorsal thalamus, abbreviations as in (B). (D) Representative photomicrographs of ventromedial thalamus for each treatment. * indicates significantly (P<0.05) greater than VEH. Bars show means + standard error of the mean.
Figure 4
Figure 4. Profile of cell death induced in the frontal (motor) and cingulate cortices
(A) atlas plane showing the approximate location of the region analyzed. (B) Number of silver stained neurons in cingulate cortex as a function of treatment: vehicle (VEH), retigabine (RTG, 5, 15, and 30 mg/kg), phenobarbital (PB, 75 mg/kg), lamotrigine (LTG, 20 mg/kg), levetiracetam (LEV, 200 mg/kg), and carbamazepine (CBZ, 100 mg/kg). (C) Number of silver stained neurons in motor cortex, abbreviations as in (B). (D) Representative photomicrographs for each treatment in motor cortex. * indicates significantly (P<0.05) greater than VEH. Bars show means + standard error of the mean.
Figure 5
Figure 5. Profile of cell death induced in the retrosplenial and somatosensory cortices
(A) atlas plane showing the approximate location of the region analyzed. (B) Number of silver stained neurons in retrosplenial cortex as a function of treatment: vehicle (VEH), retigabine (RTG, 5, 15, and 30 mg/kg), phenobarbital (PB, 75 mg/kg), lamotrigine (LTG, 20 mg/kg), levetiracetam (LEV, 200 mg/kg), and carbamazepine (CBZ, 100 mg/kg). (C) Number of silver stained neurons in somatosensory cortex, abbreviations as in (B). (D) Representative photomicrographs for each treatment in retrosplenial cortex. * indicates significantly (P<0.05) greater than VEH. Bars show means + standard error of the mean.
Figure 6
Figure 6. Profile of cell death induced by repeated retigabine administration
(A) Graph showing number of silver-stained neurons in dorsolateral thalamus after vehicle (VEH) or retigabine (RTG 3 x 15 mg/kg) treatment. Panels below show representative photomicrographs. Similar profiles are shown for (B) cingulate cortex, (C) motor cortex, (D) retrosplenial cortex and (E) somatosensory cortex. * indicates significantly (P<0.05) greater than VEH. Bars show means + standard error of the mean.

References

    1. Gedzelman E, Meador K. Neurological and psychiatric sequelae of developmental exposure to antiepileptic drugs. Front Neur. 2012;3:182. - PMC - PubMed
    1. Turski CA, Ikonomidou C. Neuropathological sequelae of developmental exposure to antiepileptic and anesthetic drugs. Front Neur. 2012;3:120. - PMC - PubMed
    1. Bittigau P, Sifringer M, Genz K, et al. Antiepileptic drugs and apoptotic neurodegeneration in the developing brain. Proc Natl Acad Sci U S A. 2002;99:15089–94. - PMC - PubMed
    1. Forcelli PA, Kim J, Kondratyev A, Gale K. Pattern of antiepileptic drug-induced cell death in limbic regions of the neonatal rat brain. Epilepsia. 2011;52:e207–11. - PMC - PubMed
    1. Katz I, Kim J, Gale K, Kondratyev A. Effects of lamotrigine alone and in combination with MK-801, phenobarbital, or phenytoin on cell death in the neonatal rat brain. J Pharmacol Exp Ther. 2007;322:494–500. - PubMed

Publication types

LinkOut - more resources