

A computational approach to studying ageing at the individual level
- PMID: 26865300
- PMCID: PMC4760160
- DOI: 10.1098/rspb.2015.2346
A computational approach to studying ageing at the individual level
Abstract
The ageing process is actively regulated throughout an organism's life, but studying the rate of ageing in individuals is difficult with conventional methods. Consequently, ageing studies typically make biological inference based on population mortality rates, which often do not accurately reflect the probabilities of death at the individual level. To study the relationship between individual and population mortality rates, we integrated in vivo switch experiments with in silico stochastic simulations to elucidate how carefully designed experiments allow key aspects of individual ageing to be deduced from group mortality measurements. As our case study, we used the recent report demonstrating that pheromones of the opposite sex decrease lifespan in Drosophila melanogaster by reversibly increasing population mortality rates. We showed that the population mortality reversal following pheromone removal was almost surely occurring in individuals, albeit more slowly than suggested by population measures. Furthermore, heterogeneity among individuals due to the inherent stochasticity of behavioural interactions skewed population mortality rates in middle-age away from the individual-level trajectories of which they are comprised. This article exemplifies how computational models function as important predictive tools for designing wet-laboratory experiments to use population mortality rates to understand how genetic and environmental manipulations affect ageing in the individual.
Keywords: ageing; heterogeneity; mortality; reproduction; stochastic models.
© 2016 The Author(s).
Figures


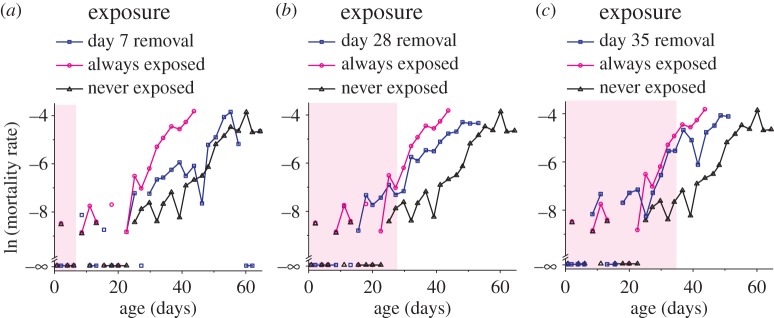
 by log-rank comparing day 28 or day 35 and non-fem groups). However, both the day 28 and day 35 groups are significantly longer lived than the lifelong feminized exposure group (p < 0.0001 and p = 0.012, respectively, by log-rank). N = [94 : 100] for all groups. Log-rank statistical tests compare entirety of lifespans. Shading in panels represent when pheromones were present for switch group (blue lines).

Similar articles
-
Measurement of lifespan in Drosophila melanogaster.J Vis Exp. 2013 Jan 7;(71):50068. doi: 10.3791/50068. J Vis Exp. 2013. PMID: 23328955 Free PMC article.
-
Sex-specific effects of social isolation on ageing in Drosophila melanogaster.J Insect Physiol. 2017 Oct;102:12-17. doi: 10.1016/j.jinsphys.2017.08.008. Epub 2017 Aug 19. J Insect Physiol. 2017. PMID: 28830760
-
Applying the genetic theories of ageing to the cytoplasm: cytoplasmic genetic covariation for fitness and lifespan.J Evol Biol. 2009 Apr;22(4):818-27. doi: 10.1111/j.1420-9101.2009.01692.x. Epub 2009 Feb 14. J Evol Biol. 2009. PMID: 19226414
-
Phenome and genome based studies into human ageing and longevity: An overview.Biochim Biophys Acta Mol Basis Dis. 2018 Sep;1864(9 Pt A):2742-2751. doi: 10.1016/j.bbadis.2017.09.017. Epub 2017 Sep 22. Biochim Biophys Acta Mol Basis Dis. 2018. PMID: 28951210 Review.
-
Courtship, aggression and avoidance: pheromones, receptors and neurons for social behaviors in Drosophila.Fly (Austin). 2011 Jan-Mar;5(1):58-63. doi: 10.4161/fly.5.1.13794. Epub 2011 Jan 1. Fly (Austin). 2011. PMID: 20962580 Review.
Cited by
-
Non-mammalian Hosts and Photobiomodulation: Do All Life-forms Respond to Light?Photochem Photobiol. 2019 Jan;95(1):126-139. doi: 10.1111/php.12951. Epub 2018 Jul 23. Photochem Photobiol. 2019. PMID: 29882348 Free PMC article. Review.
-
Measuring and modeling interventions in aging.Curr Opin Cell Biol. 2018 Dec;55:129-138. doi: 10.1016/j.ceb.2018.07.004. Epub 2018 Aug 10. Curr Opin Cell Biol. 2018. PMID: 30099284 Free PMC article. Review.
-
Aging and Veterinary Care of Cats, Dogs, and Horses through the Records of Three University Veterinary Hospitals.Front Vet Sci. 2017 Feb 14;4:14. doi: 10.3389/fvets.2017.00014. eCollection 2017. Front Vet Sci. 2017. PMID: 28261586 Free PMC article.
References
Publication types
MeSH terms
Substances
Grants and funding
LinkOut - more resources
Full Text Sources
Other Literature Sources
Medical
Molecular Biology Databases
Research Materials
