. 2016 Feb 11:6:20775.
doi: 10.1038/srep20775.

Comprehensive behavioral analysis of RNG105 (Caprin1) heterozygous mice: Reduced social interaction and attenuated response to novelty

Affiliations

Comprehensive behavioral analysis of RNG105 (Caprin1) heterozygous mice: Reduced social interaction and attenuated response to novelty

Rie Ohashi et al. Sci Rep. .

Abstract

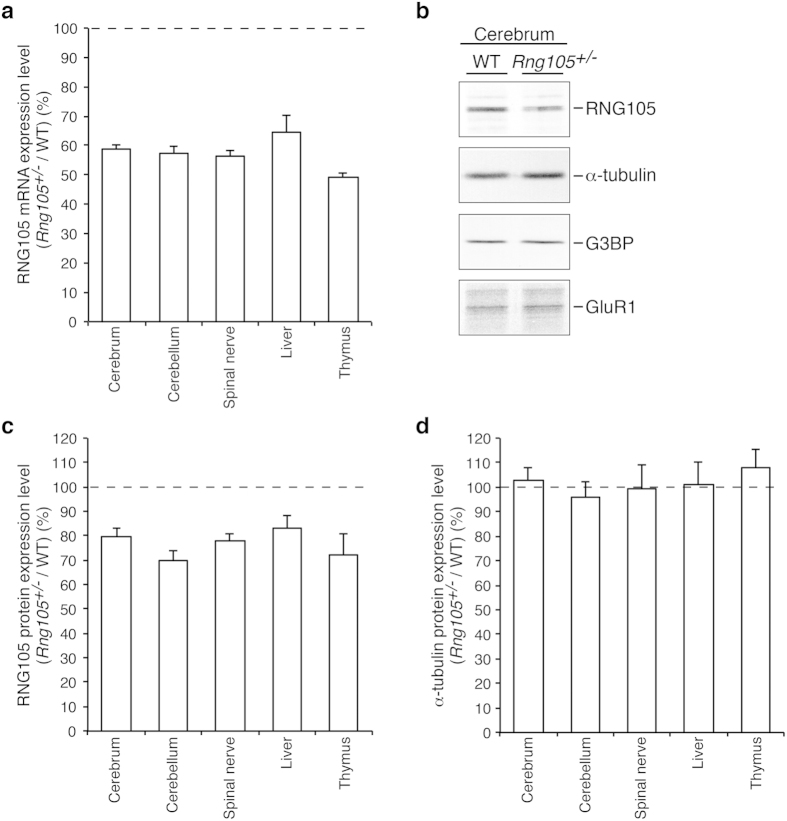
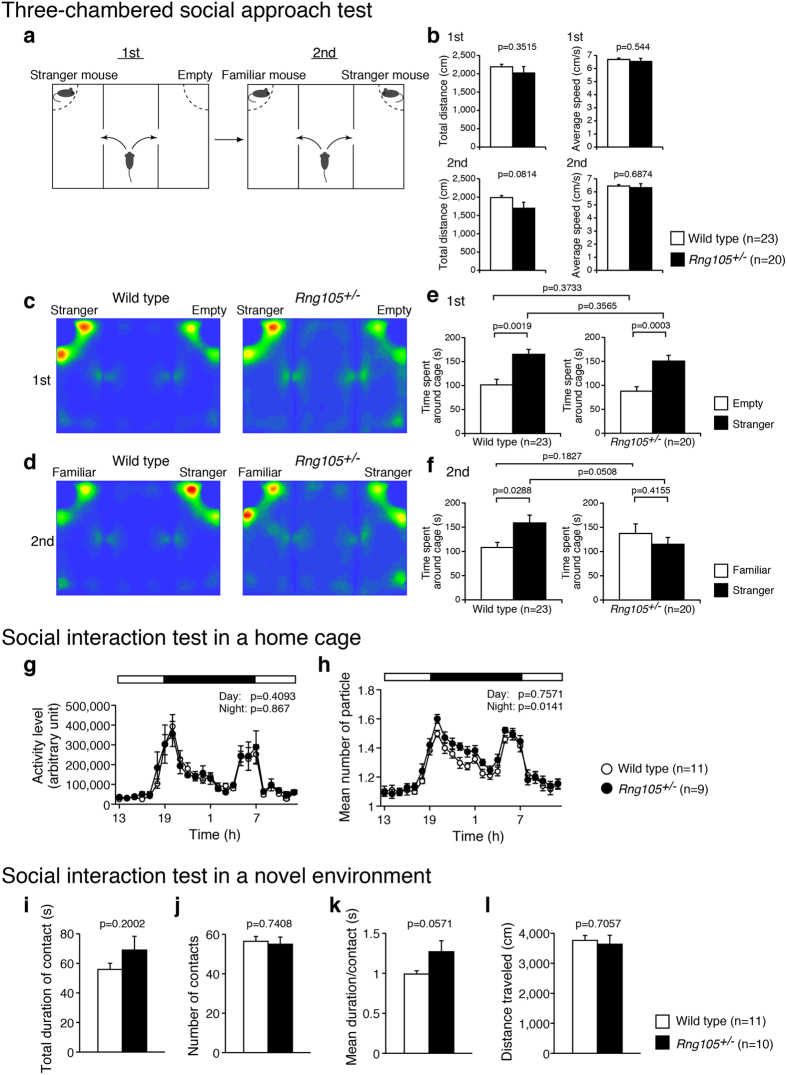
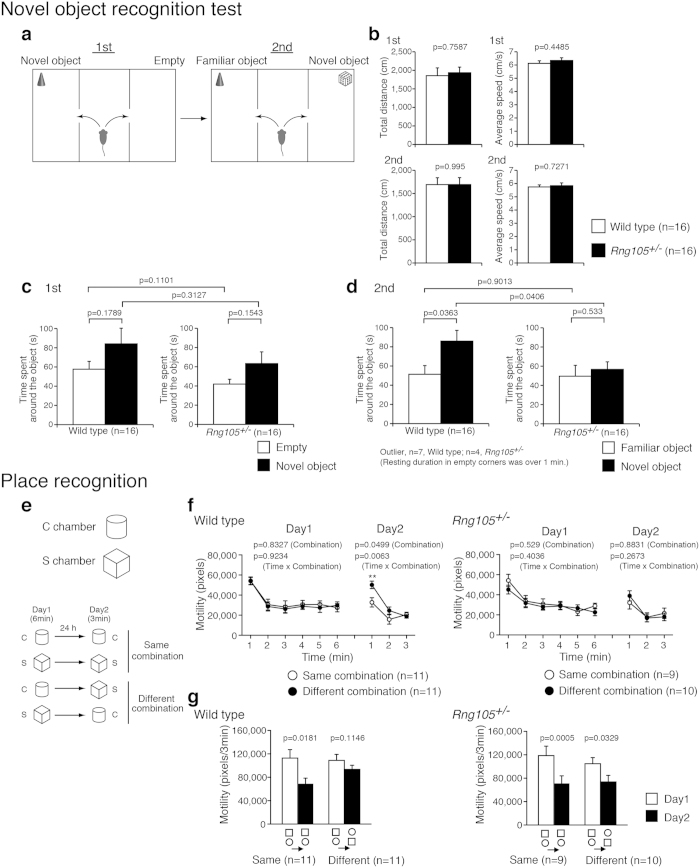
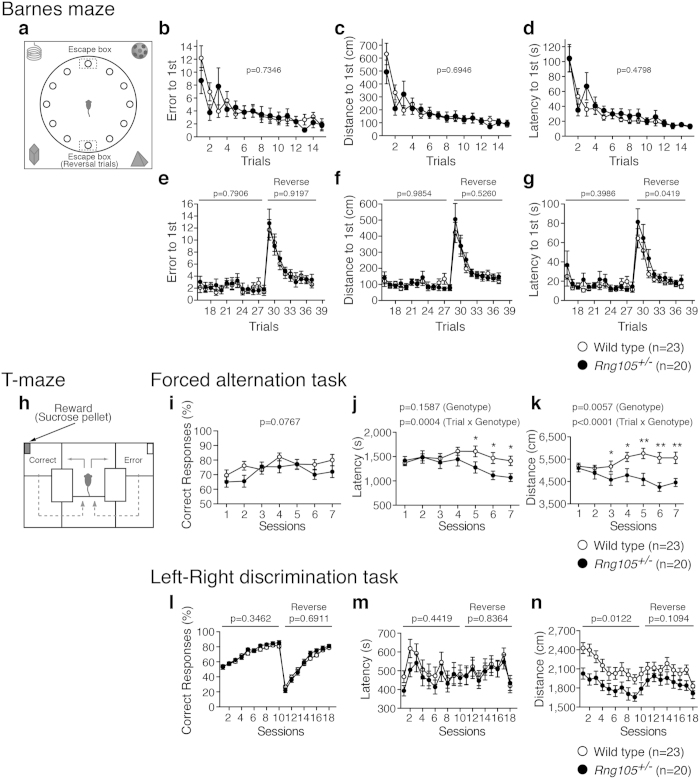
RNG105 (also known as Caprin1) is a major RNA-binding protein in neuronal RNA granules, and is responsible for mRNA transport to dendrites and neuronal network formation. A recent study reported that a heterozygous mutation in the Rng105 gene was found in an autism spectrum disorder (ASD) patient, but it remains unclear whether there is a causal relation between RNG105 deficiency and ASD. Here, we subjected Rng105(+/-) mice to a comprehensive behavioral test battery, and revealed the influence of RNG105 deficiency on mouse behavior. Rng105(+/-) mice exhibited a reduced sociality in a home cage and a weak preference for social novelty. Consistently, the Rng105(+/-) mice also showed a weak preference for novel objects and novel place patterns. Furthermore, although the Rng105(+/-) mice exhibited normal memory acquisition, they tended to have relative difficulty in reversal learning in the spatial reference tasks. These findings suggest that the RNG105 heterozygous knockout leads to a reduction in sociality, response to novelty and flexibility in learning, which are implicated in ASD-like behavior.


Figures

Figure 1
Figure 1. RNG105 mRNA and protein expression level in Rng105+/− mice.
(a) The ratio of RNG105 mRNA expression level in Rng105+/− mice to that in wild-type mice. mRNA expression was measured by quantitative reverse transcription (RT)-PCR in each tissue from Rng105+/− and wild-type mice. n = 4. (b) Western blotting for RNG105 and control proteins (α-tubulin, G3BP, GluR1) in the cerebrum from wild-type and Rng105+/− mice. The same amount of extracts between wild-type and Rng105+/− mice (40 μg per lane for RNG105, G3BP and GluR1; 0.25 μg per lane for α-tubulin) was loaded on each lane. (c,d) The ratio of the expression levels of RNG105 protein (c) and α-tubulin protein (d) in Rng105+/− mice to that in wild-type mice. Protein expression was quantified by Western blotting of extracts from each tissue with an anti-RNG105 antibody and an anti-α-tubulin antibody (see Supplementary Fig. S1). n = 4. Data are presented as mean ± standard error of the mean (S.E.M).
Figure 2
Figure 2. Social interaction abnormalities in Rng105+/− mice.
(af) Three-chambered social approach test. (a) Schematic diagram of the test. In the first session, one of the cages contains a stranger mouse. In the second session, the stranger mouse becomes familiar to the test mouse, and the other stranger mouse is put in the other cage. (b) Total distance traveled and the average locomotor speed in the first and the second sessions. (c,d) Heat maps showing the average traces of 23 wild-type mice (left panels) and 20 Rng105+/− mice (right panels) in the first session (c) and the second session (d). (e,f) Time spent around either the empty cage or the stranger mouse cage in the first session (e) and either the familiar or stranger mouse cage in the second session (f). (g,h) Social interaction test in a home cage. White and black bars indicate lights on and off, respectively. The data are represented as the average of five days (day 3 to day 7) from a 7-day experiment. (g) Locomotor activity in the home cage test. (h) Social interaction of two mice as judged by the number of the particle. When the mice are apart from each other, the particle number is two, and the particle number is one when they are close to each other. Therefore, larger number of particle indicates less interactions. n = 11 and 9 pairs for wild-type and Rng105+/− mice, respectively. (il) Social interaction test in a novel environment. Pairs of the same genotype mice were tested. (i) Total duration of contact with each other. (j) The number of contacts. (k) Mean duration per contact. (l) Total distance traveled. n = 11 and 10 pairs for wild-type and Rng105+/− mice, respectively. Data are presented as mean ± S.E.M. P-values from one-way ANOVA (b, between different genotypes in e and f, and i-l), paired t-test (between the same genotypes in e,f) and two-way repeated measures ANOVA (g,h) are indicated.
Figure 3
Figure 3. Response to novel objects and novel place patterns was reduced in Rng105+/− mice.
(ad) Novel object recognition test. (a) Schematic diagram of the test. In the first session, an object is put in a corner of a chamber. In the second session, the object becomes familiar to the test mouse, and a different type of object is put in a corner of the other chamber. (b) Total distance traveled and the average locomotor speed in the first and the second sessions. (c,d) Time spent around either the empty corner or the novel object in the first session (c) and either the familiar or novel object in the second session (d). (eg) Place recognition test. (e) Schematic diagram of the test. Mice were put into the C chamber (circle) or the S chamber (square) for 6 min on day 1. On day 2, they were put into the same chamber (same combination) or the other chamber (different combination) for 3 min. (f) Motility of wild-type mice (left panel) and Rng105+/− mice (right panel) put into the same or different combination of the chambers on day 1 and day 2. (g) The sum of the motility in the first 3 minutes on day 1 (white bars) and 3 minutes on day 2 (black bars) for each group of mice. Data are presented as mean ± S.E.M. P-values from one-way ANOVA (b, between different genotypes in c and d), paired t-test (between the same genotypes in c and d, and g), and p-values for the main effect of the chamber combination and the interaction effect (time × chamber combination) in two-way repeated measures ANOVA (f) are indicated. **p < 0.01, one-way ANOVA at the same time point.
Figure 4
Figure 4. Rng105+/− mice performed well on the initial acquisition of memory, but had relative difficulty in reversal learning.
(ag) Barnes maze test. (a) Schematic diagram of the test. Mice are trained to find a target hole connected to an escape box in initial trials. The escape box is moved to the opposite side of the maze in the reversal trials. (bd) Initial trials. The number of errors (b), total distance traveled (c), and latency (d), to the first visit to the correct hole in the initial training period (trials 1–15). (eg) After a one-month retention interval, the same tests were performed (trials 16–28), followed by the reversal trial (trials 29–37). (hn) T-maze test. (h) Schematic diagram of the test. In the left-right discrimination task, mice are trained to select a fixed arm with a reward. The rewarded arm is changed to the other side in the reversal sessions. (ik) Forced alternation task. Percentage of correct responses to select the arm with the reward (i), latency to finish each session (j), and total distance traveled (k). (ln) Left-right discrimination task. Percentage of correct responses to select the arm with the reward (l), latency to finish each session (m), and total distance traveled (n) in the initial training period (sessions 1–10) and reversal training period (sessions 11–18). Data are presented as mean ± S.E.M. P-values for the genotype effect (bg,in) and the interaction effect between genotype and session (j,k) in two-way repeated measures ANOVA are indicated. *p < 0.05, **p < 0.01, one-way ANOVA at the same sessions.
Figure 5
Figure 5. AMPA receptor subunit GluR1 surface distribution was reduced in dendrites of RNG105-deficient neurons.
(a) Immunostaining for GluR1 in cultured neurons (9 DIV) from cerebral cortexes of E17.5 wild-type, Rng105+/− and Rng105−/− mice. A cell soma is located on the left side and a primary dendrite elongates toward the right side in each panel. GluR1 staining before permeabilization (green, surface expression), after permeabilization (magenta), and merged images (total expression) are shown. GluR1 is distributed in a punctate manner both in the soma and dendrites. Scale bar, 10 μm. (b,c) The number of surface (b) and total (c) GluR1 puncta in dendrites of wild-type, Rng105+/− and Rng105−/− neurons. (d) The ratio of surface/total number of GluR1 puncta in dendrites. Data are presented as means ± S.E.M. Wild type, n = 19; Rng105+/−, n = 19; Rng105−/−, n = 21; *p < 0.05, one-way ANOVA followed by Turkey-Kramer test.

References

    1. Kang H. & Schuman E. M. A requirement for local protein synthesis in neurotrophin-induced hippocampal synaptic plasticity. Science 273, 1402–1406 (1996). - PubMed
    1. Costa-Mattioli M., Sossin W. S., Klann E. & Sonenberg N. Translational control of long-lasting synaptic plasticity and memory. Neuron 61, 10–26 (2009). - PMC - PubMed
    1. Holt C. E. & Schuman E. M. The central dogma decentralized: new perspectives on RNA function and local translation in neurons. Neuron 80, 648–657 (2013). - PMC - PubMed
    1. Knowles R. B. et al. Translocation of RNA granules in living neurons. J. Neurosci. 16, 7812–7820 (1996). - PMC - PubMed
    1. Kiebler M. A. & Bassell G. J. Neuronal RNA granules: movers and makers. Neuron 51, 685–690 (2006). - PubMed

Publication types

MeSH terms