. 2016 May 1;24(13):667-79.
doi: 10.1089/ars.2015.6495. Epub 2016 Mar 16.

Studies of Hematopoietic Cell Differentiation with a Ratiometric and Reversible Sensor of Mitochondrial Reactive Oxygen Species

Affiliations

Studies of Hematopoietic Cell Differentiation with a Ratiometric and Reversible Sensor of Mitochondrial Reactive Oxygen Species

Amandeep Kaur et al. Antioxid Redox Signal. .

Abstract

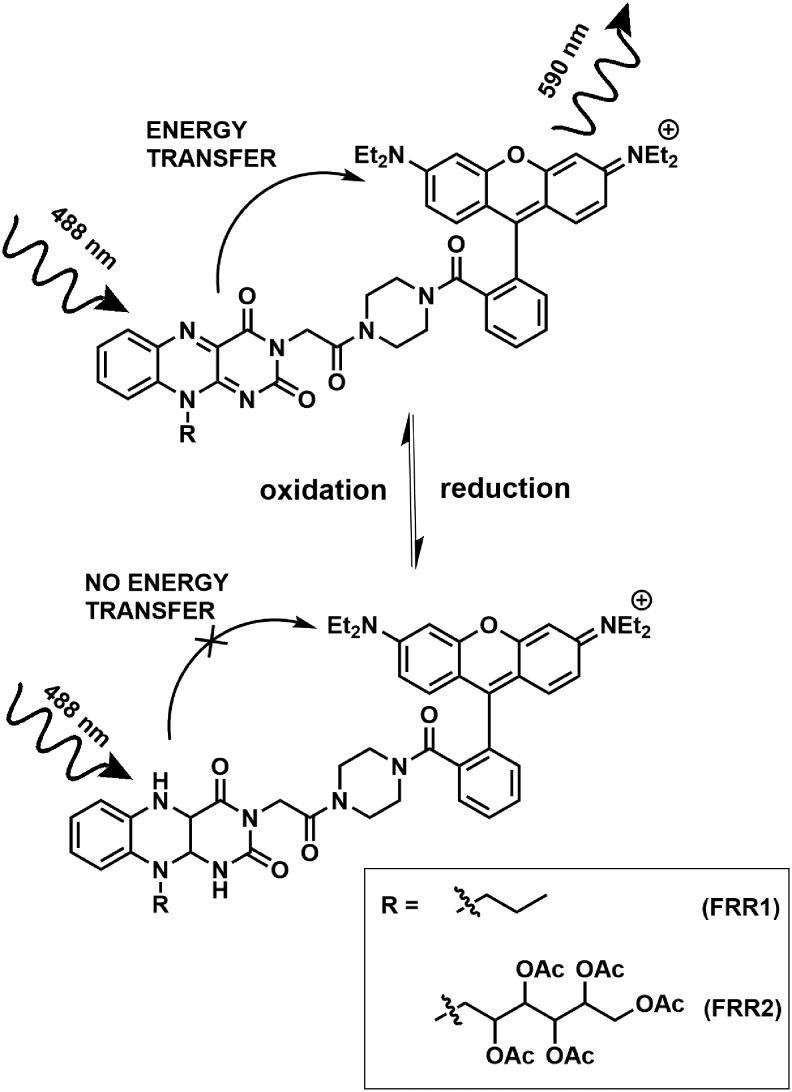
Aims: Chronic elevations in cellular redox state are known to result in the onset of various pathological conditions, but transient increases in reactive oxygen species (ROS)/reactive nitrogen species (RNS) are necessary for signal transduction and various physiological functions. There is a distinct lack of reversible fluorescent tools that can aid in studying and unraveling the roles of ROS/RNS in physiology and pathology by monitoring the variations in cellular ROS levels over time. In this work, we report the development of ratiometric fluorescent sensors that reversibly respond to changes in mitochondrial redox state.

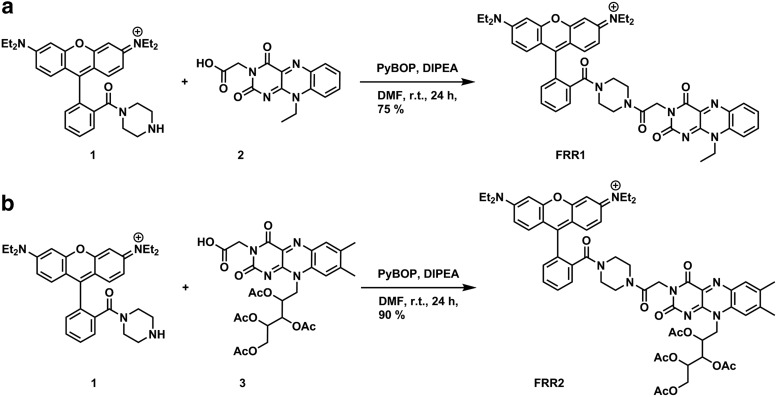
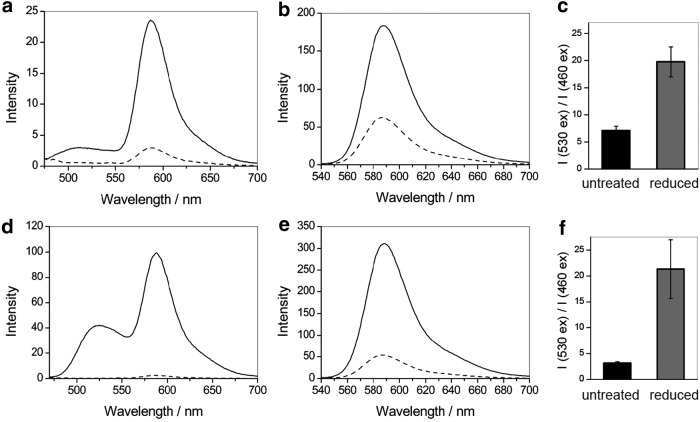
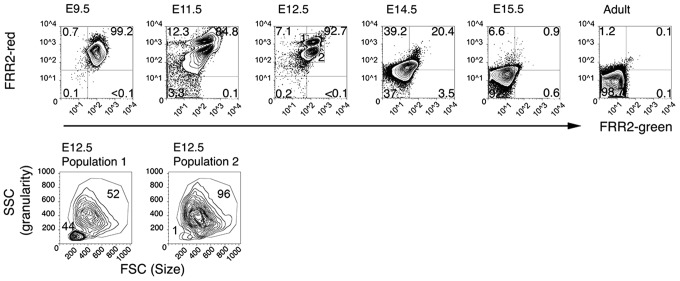
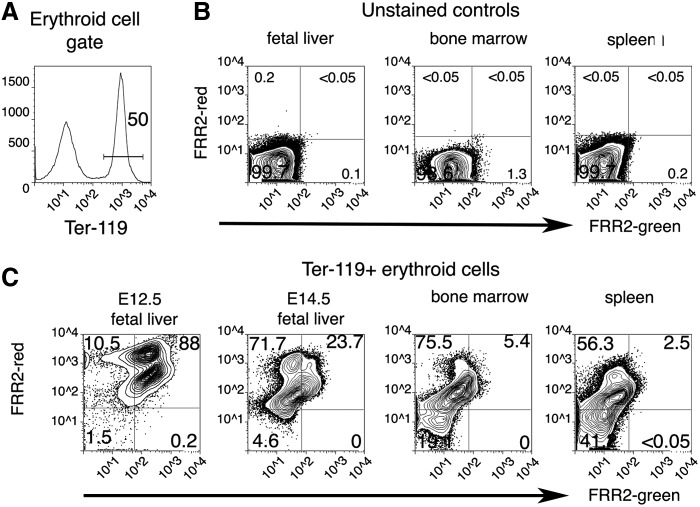
Results: Photophysical studies of the developed flavin-rhodamine redox sensors, flavin-rhodamine redox sensor 1 (FRR1) and flavin-rhodamine redox sensor 2 (FRR2), confirmed the reversible response of the probes upon reduction and re-oxidation over more than five cycles. The ratiometric output of FRR1 and FRR2 remained unaltered in the presence of other possible cellular interferants (metals and pH). Microscopy studies indicated clear mitochondrial localization of both probes, and FRR2 was shown to report the time-dependent increase of mitochondrial ROS levels after lipopolysaccharide stimulation in macrophages. Moreover, it was used to study the variations in mitochondrial redox state in mouse hematopoietic cells at different stages of embryonic development and maturation.

Innovation: This study provides the first ratiometric and reversible probes for ROS, targeted to the mitochondria, which reveal variations in mitochondrial ROS levels at different stages of embryonic and adult blood cell production.

Conclusions: Our results suggest that with their ratiometric and reversible outputs, FRR1 and FRR2 are valuable tools for the future study of oxidative stress and its implications in physiology and pathology. Antioxid. Redox Signal. 24, 667-679.


Figures

<b>FIG. 1.</b>
FIG. 1.
The Förster resonance energy transfer processes taking place in FRR redox-responsive probes. FRR, flavin–rhodamine redox sensor.
<b>FIG. 2.</b>
FIG. 2.
Synthesis of (a) FRR1 and (b) FRR2. FRR1, flavin–rhodamine redox sensor 1; FRR2, flavin–rhodamine redox sensor 2.
<b>FIG. 3.</b>
FIG. 3.
Fluorescence responses of FRR1 and FRR2 to reduction. Fluorescence emission spectra of (a, b) FRR1 (10 μM) and (d, e) FRR2 (10 μM) in oxidized (black line) and reduced (dashed line) forms upon excitation at 460 nm (a, d) and 530 nm (b, e). Probes were reduced using 200 equivalents of Na2S2O4. The ratio of the emission of FRR1 (c) and FRR2 (f) at 580 nm upon excitation at 530 versus 460 nm in oxidized (black) and reduced (gray) forms. All data were acquired in 100 mM HEPES buffer, pH 7.4. Error bars represent standard deviation (n = 3).
<b>FIG. 4.</b>
FIG. 4.
Ratiometric fluorescence response of (a) FRR1 (5 μM) and (b) FRR2 (5 μM) to cycles of oxidation and reduction. Data points represent ratio of the emission of FRR1 and FRR2 at 580 nm upon excitation at 530 versus 460 nm. Reduction and oxidation were achieved with 200 equivalents of Na2S2O4 and 400 equivalents of H2O2, respectively. All data were acquired in 100 mM HEPES buffer, pH 7.4. Error bars represent standard deviation (n = 3).
<b>FIG. 5.</b>
FIG. 5.
FRR1 and FRR2 can be oxidized by various ROS/RNS, and fluorescence ratios are unaffected by pH changes, or by the presence of metal ions. Fluorescence ratio of (a) FRR1 (10 μM) and (d) FRR2 (10 μM) after oxidation by a range of ROS and reactive nitrogen species for untreated (black), reduced (white), and re-oxidized probe (hatched). Fluorescence response of FRR1 and FRR2 (b, e) over a range of pH values (100 mM buffers) and (c, f) in the presence of metals (100 μM). Bars represent the ratio of the emission of FRR1 and FRR2 at 580 nm upon excitation at 530 versus 460 nm. All data were acquired in 100 mM HEPES buffer, pH 7.4. Error bars represent standard deviation (n = 3). ROS, reactive oxygen species; RNS, reactive nitrogen species.
<b>FIG. 6.</b>
FIG. 6.
Colocalization images of macrophages (RAW 264.7) treated with FRR1 (20 μM) or FRR2 (20 μM), costained with MitoTracker Deep Red (100 nM) and LysoTracker Deep Red (100 nM). FRR1/FRR2 emission is in channel 1 (λex = 488 nm, λem = 495–620 nm) and MitoTracker/LysoTracker emission in channel 2 (λex = 633 nm, λem = 650–750 nm). Merged images indicate good colocalization of MitoTracker with both probes. To see this illustration in color, the reader is referred to the web version of this article at www.liebertpub.com/ars
<b>FIG. 7.</b>
FIG. 7.
Response of FRR2 to macrophages (RAW 264.7) stimulated with LPS from 0 to 6 h (black) and those restimulated with LPS after the 2 h timepoint (gray). Bars represent the mean fluorescence intensity of red emission (585/42 nm) when excited with a 488 nm laser. Error bars represent standard error of mean, **p < 0.01, ****p < 0.001. LPS, lipopolysaccharide.
<b>FIG. 8.</b>
FIG. 8.
Circulating blood cells show high levels of FRR2-green and FRR2-red fluorescence. As the fetus matures (14.5 dpc onward), FRR2 fluorescence is lost. By 15.5 dpc, most circulating blood cells resemble the adult circulating cells with essentially no FRR2 fluorescence. At 12.5 dpc, two distinct populations can be detected according to FRR2 fluorescence. Population 1 shows higher FRR2-red fluorescence compared to population 2. The bottom panel shows the size (forward scatter: FSC) versus cytoplasmic granularity (side scatter: SSC) of populations 1 and 2 at 12.5 dpc. Population 1 shows nearly half the cells being small and agranular, whereas nearly all cells in population 2 are large and granular. The numbers in the top right corner indicates the frequency of large granular cells in all live circulating blood cells. The number in the bottom left corner represents the frequency of small agranular cells in the live circulating blood cells. Flow cytometric profiles shown are representative of blood cells from 3 to 6 individual embryos at each stage and six adult mice. dpc, days post-coitum.
<b>FIG. 9.</b>
FIG. 9.
Embryonic and adult blood production is distinguished by mitochondrial ROS levels. (A) Gating strategy for selection of Ter-119+ developing erythroid cells. The gate chosen is shown as the horizontal line. In (A), 50% of bone marrow cells are expressing Ter-119. (B) Typical flow cytometry profiles of unstained fetal liver, bone marrow, and spleen samples, (C) fluorescence of FRR2-green (488 nm) and FRR2-red (546 nm) in early and later fetal liver erythroid cells compared to adult bone marrow and spleen Ter-119+ erythroid populations. Numbers in each corner refer to the frequency of live Ter-119+ cells in that quadrant. Flow cytometric profiles shown are representative of fetal livers from 3 to 6 individual embryos at each stage and bone marrow and spleens from six adult mice.
<b>FIG. 10.</b>
FIG. 10.
CD4+ helper T cells exhibit reduced mitochondrial ROS. (A) Left panel: FRR2-red and green fluorescence on total live gated bone marrow cells identifies three distinct populations (labeled 1, 2, and 3). Right panels show size (forward scatter, FSC) and granularity (side scatter, SSC) for populations 1, 2, and 3 as gated in the left panel. (B) Live bone marrow and spleen cells were stained with antibodies against specific surface markers. Cells positive for the surface marker were then assessed for FRR2 fluorescence. The number shown in the corners represents the frequency of live-gated cells within that quadrant. Data shown are representative of three independent experiments.

References

    1. Angeloni C, Maraldi T, and Vauzour D. Redox signaling in degenerative diseases: from molecular mechanisms to health implications. BioMed Res Int 2014: 2, 2014 - PMC - PubMed
    1. Johnson I, Spence MTZ. (eds). Molecular Probes Handbook, A Guide to Fluorescent Probes and Labeling Technologies, 11th edn. Carlsbad, CA: Life Technologies
    1. Antas VI, Brigden KW, Prudence AJ, and Fraser ST. Gastrokine-2 is transiently expressed in the endodermal and endothelial cells of the maturing mouse yolk sac. Gene Expr Patterns 16: 69–74, 2014 - PubMed
    1. Arai Y. and Nagai T. Extensive use of FRET in biological imaging. Microscopy 62: 419–428, 2013 - PubMed
    1. Banekovich C. and Matuszczak B. 2′,3′,4′,5′-Tetraacetyl-N(3)-carboxymethylriboflavin derivatives: synthesis and fluorescence studies. Tetrahedron Lett 46: 5053–5056, 2005

Publication types

LinkOut - more resources