. 2016 Feb 11:6:20646.
doi: 10.1038/srep20646.

Scavenger receptor B1, the HDL receptor, is expressed abundantly in liver sinusoidal endothelial cells

Affiliations

Scavenger receptor B1, the HDL receptor, is expressed abundantly in liver sinusoidal endothelial cells

Latha P Ganesan et al. Sci Rep. .

Abstract

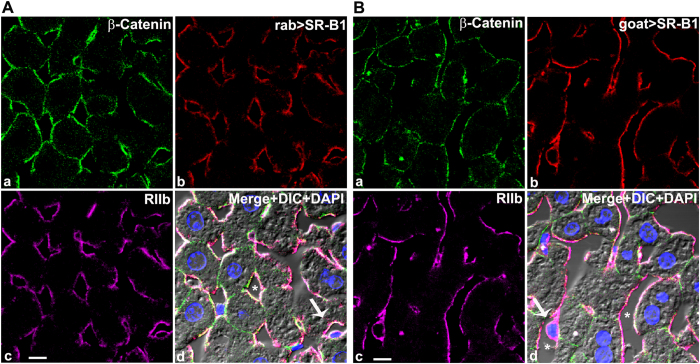
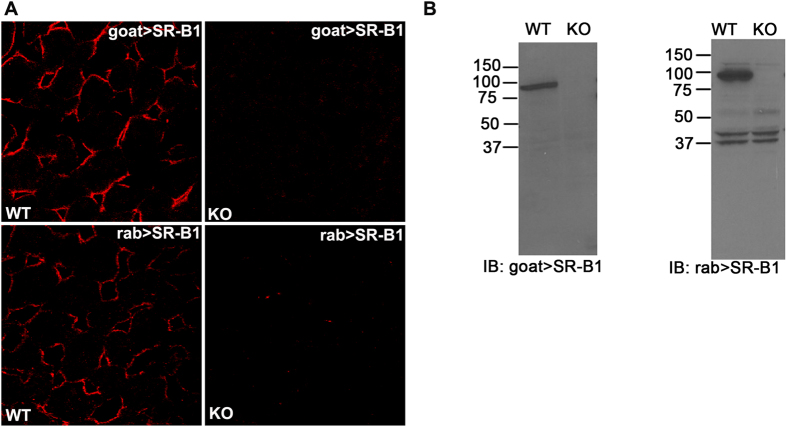
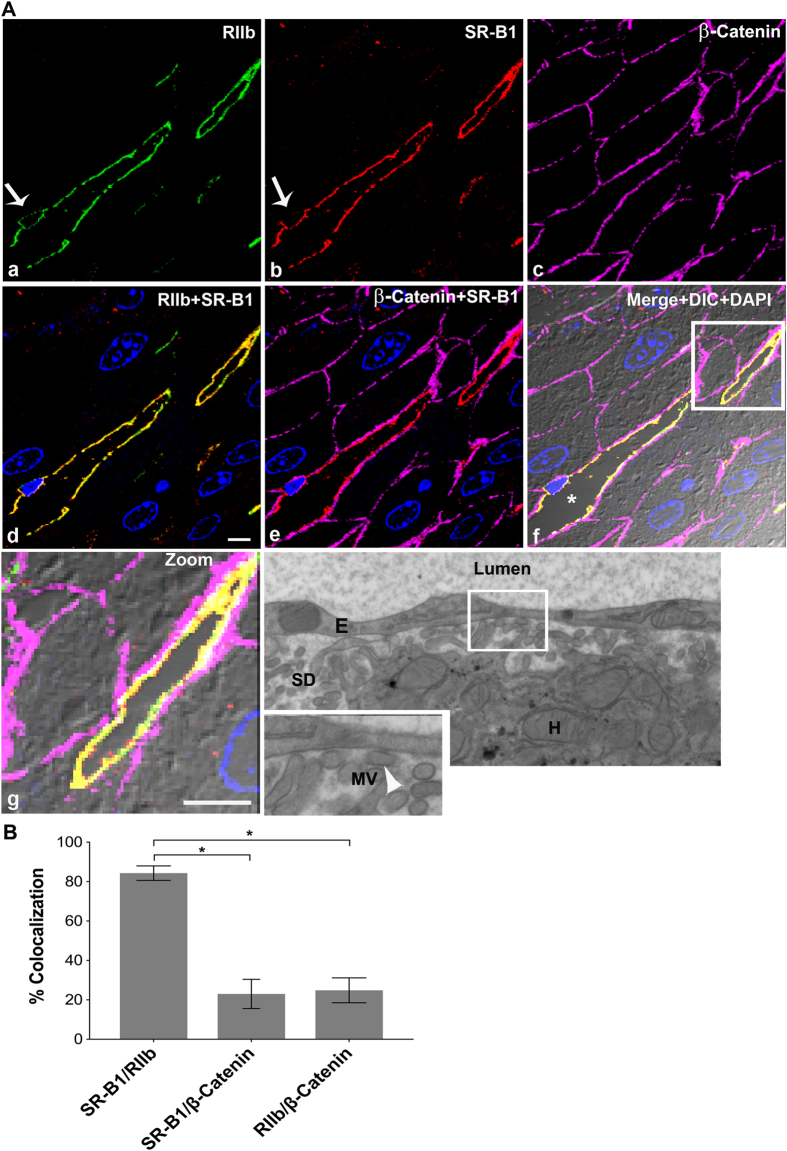
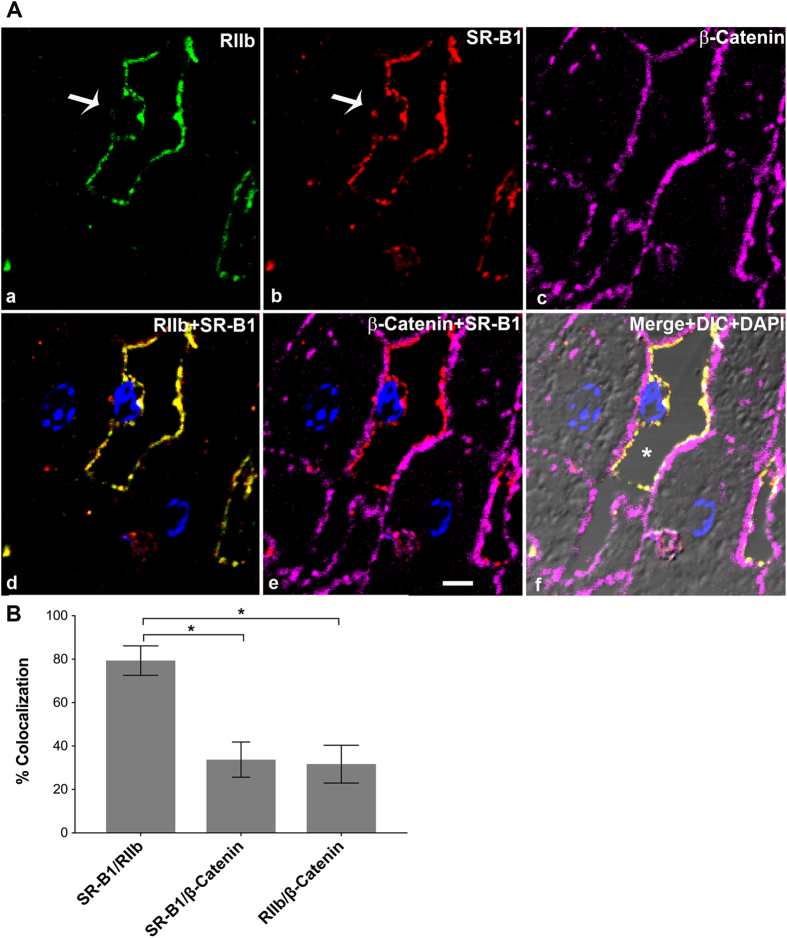
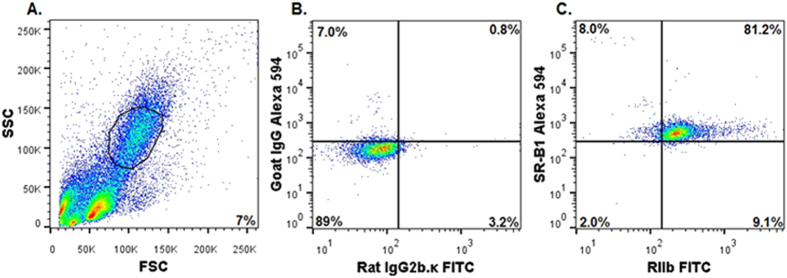
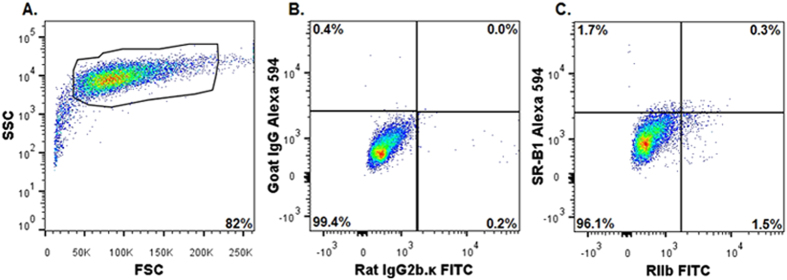
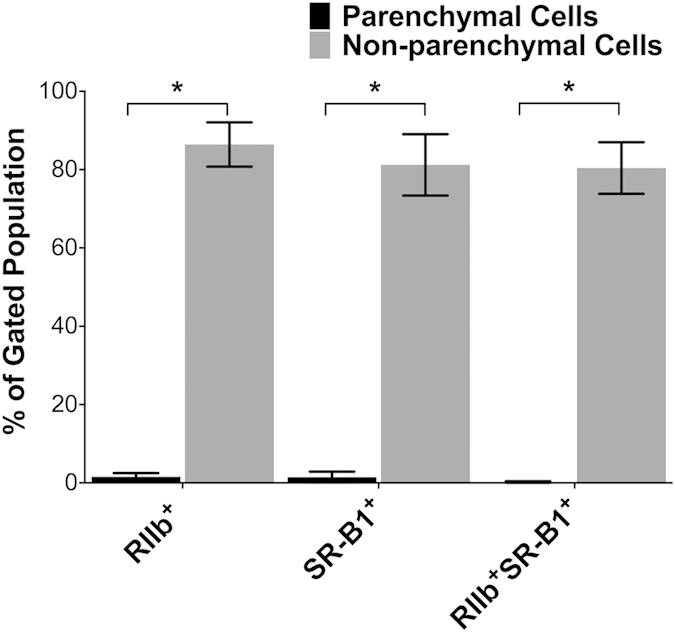
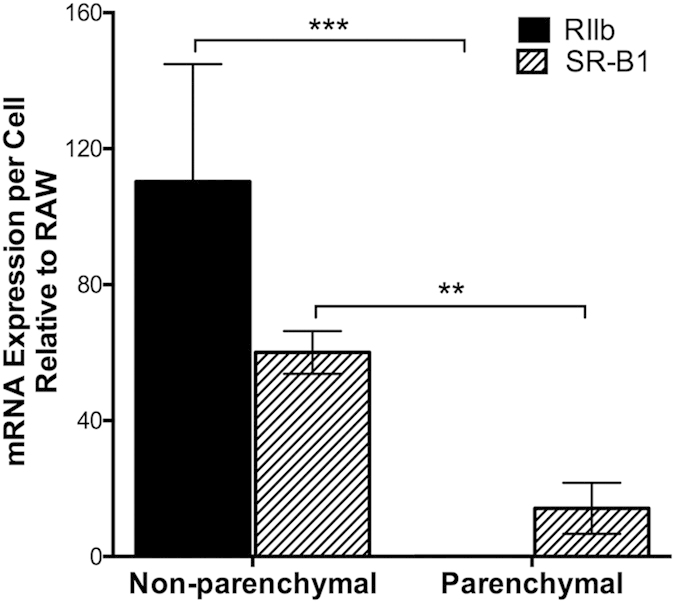
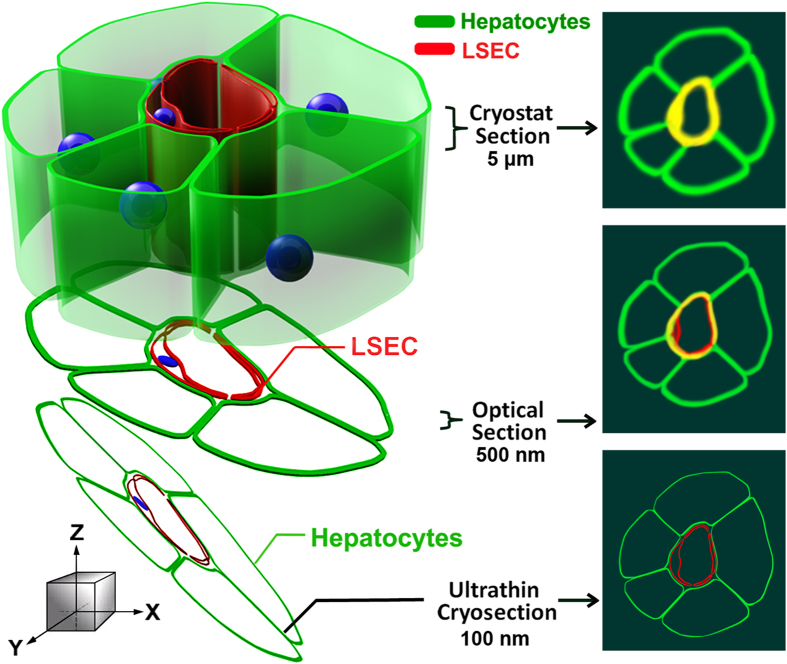
Cholesterol from peripheral tissue, carried by HDL, is metabolized in the liver after uptake by the HDL receptor, SR-B1. Hepatocytes have long been considered the only liver cells expressing SR-B1; however, in this study we describe two disparate immunofluorescence (IF) experiments that suggest otherwise. Using high-resolution confocal microscopy employing ultrathin (120 nm) sections of mouse liver, improving z-axis resolution, we identified the liver sinusoidal endothelial cells (LSEC), marked by FcγRIIb, as the cell within the liver expressing abundant SR-B1. In contrast, the hepatocyte, identified with β-catenin, expressed considerably weaker levels, although optical resolution of SR-B1 was inadequate. Thus, we moved to a different IF strategy, first separating dissociated liver cells by gradient centrifugation into two portions, hepatocytes (parenchymal cells) and LSEC (non-parenchymal cells). Characterizing both portions for the cellular expression of SR-B1 by flow cytometry, we found that LSEC expressed considerable amounts of SR-B1 while in hepatocytes SR-B1 expression was barely perceptible. Assessing mRNA of SR-B1 by real time PCR we found messenger expression in LSEC to be about 5 times higher than in hepatocytes.


Figures

Figure 1
Figure 1. Where in liver is SR-B1 expressed?
(A) Confocal microscopic images of a 5 μm thick mouse liver section stained with fluor-tagged mouse IgG anti-β-catenin, rabbit IgG anti-SR-B1, mab 2.4G2 IgG anti-RIIb, and DAPI. (a) Hepatocyte membrane marker β-catenin (green). (b) anti-SR-B1 antibody (red). (c) LSEC membrane marker RIIb (pseudo colored magenta). (d) The panel shows the merged color images plus DIC and DAPI staining of nuclei. Note that SR-B1 colocalizes with the sinusoidal domain of hepatocytes and throughout the LSEC. The scale bar in panel c equals 5 μm (ad). (B) Confocal microscopic images of a 5 μm thick mouse liver section stained with fluor-tagged mouse rabbit IgG anti-β-catenin, goat IgG anti-SR-B1, mab 2.4G2 IgG anti-RIIb, and DAPI. (a) Hepatocyte membrane marker β-catenin (green). (b) anti-SR-B1 antibody (red). (c) LSEC membrane marker RIIb (pseudo colored magenta). (d) Merged color images plus DIC and DAPI staining of nuclei. Note that the SR-B1 colocalizes with the sinusoidal domain of hepatocytes and throughout the LSEC. The 5 μm bar in panel c applies to all panels. Arrow in panel d points to the nucleus of an LSEC circumferentially lined by both RIIb and SR-B1. In panel d * identifies the sinusoidal lumen.
Figure 2
Figure 2. Validation of SR-B1 antibodies.
(A) Confocal microscopic image of WT (left panels) and SR-B1 KO (right panels) liver sections labeled with goat IgG anti-SR-B1 (top row) and rabbit IgG anti-SR-B1(bottom row). (B) ECL immunoblots developed using goat (left) and rabbit (right) anti-SR-B1 showing the presence and absence of the SR-B1 band (molecular weight ~ 82 kDa) in WT and KO liver lysates, respectively. Numbers are MW markers in kDa. Note the presence of low MW non-specific bands of equal intensity in WT and KO, supporting equal protein loading (10 μg) in both lanes. Gel images are not cropped except for the irrelevant lateral lanes.
Figure 3
Figure 3. High resolution confocal image illustrates that SR-B1 is predominantly expressed in LSEC.
(A) High-resolution 4-color immunofluorescence images of an ultrathin (120 nm) cryosection from BALB/c liver localizing mab 2.4G2 anti-RIIb (green) in panel a, goat IgG anti-SR-B1 (red) in panel b, mouse IgG anti-β-Catenin (magenta) in panel c, a merge of panels a and b in panel d, and a merge of panels b and c in panel e. Panel f shows merges of the 4 color images plus DIC and DAPI staining. Panel g shows the zoomed area outlined in panel f. Panel h shows a high magnification transmission electron micrograph of mouse liver showing the lumen of the sinusoid lined by LSEC. The Space of Disse (SD), containing numerous microvilli (MV) (arrow head) projecting from the membrane of hepatocytes (H), touching the LSEC membrane is shown in the zoomed panel of g. Arrow in panels a and b points to the nucleus of an LSEC circumferentially lined by both RIIb and SR-B1. In panel f, * identifies the sinusoidal lumen. The scale bar in panel d (a–g) equals 5 μm. (B) The bar graph plots the percentage of signal from anti-SR-B1 (red) colocalizing with signal from anti-RIIb (green) or anti-β-catenin (magenta) and also colocalization of both LSEC (green) and hepatocyte marker β-catenin (magenta). Using the student’s t-test, the data of bars 1 and 2 and also bars 2 and 3 were compared. *p < 0.0001.
Figure 4
Figure 4. High resolution confocal imaging shows localization of SR-B1 predominantly to LSEC.
(A) High-resolution 4-color immunofluorescence images of an ultrathin (120 nm) cryosection from C57B/6 liver localizing anti-RIIb (green) in panel a, goat IgG anti-SR-B1 (red) in panel b, anti-β-Catenin (magenta) in panel c, a merge of panels a and b in panel d, and in panel e the merge of (b,c). (f) Merge of the 4 color images plus DIC and DAPI staining. The bar in panel e indicates 5 μm (a–f). Arrow in panel a and b points to the nucleus of an LSEC circumferentially lined by RIIb and SR-B1. In panel f, * points to the lumen. (B) The bar graph plots the percentage of signal from anti-SR-B1 (red) colocalizing with signal from anti-RIIb (green) or with signal from anti-β-catenin (magenta) and also anti-RIIb (green) signal colocalizing with signal from anti-β-catenin (magenta). Using student’s t-test, the data from bars 1 and 2 and also between bar 2 and 3 were analyzed. *p < 0.0001.
Figure 5
Figure 5. NPC of liver express abundant SR-B1, ex vivo.
(A) A representative flow cytometric acquisition plot showing forward scatter (FSC) vs side scatter (SSC) of an NPC preparation, with the gate (NPC) indicated. Note the linear Y axis scale for SSC indicating smaller cells. (B) A two-color flow cytometric analysis of gated NPC for isotype controls FITC-rat IgG2b.κ and Alexa 594-goat IgG. (C) A two-color flow cytometric analysis of gated NPC using FITC-2.4G2 mab IgG anti-RIIb and Alexa 594-goat IgG anti-SR-B1. In (A–C) events are represented as blue points, with areas of very high density and high density colored red and yellow, respectively. The percentage of events showing single or double positive expression is indicated in respective quadrants. The results are representative of 4 different experiments.
Figure 6
Figure 6. Three color flow cytometric analysis of PC of liver show negligible expression of SR-B1, ex vivo.
(A) A representative flow cytometric acquisition plot showing forward scatter (FSC) vs side scatter (SSC) of a PC preparation, with the gate (PC) indicated. Note the log Y axis scale for SSC, indicating large cells. (B) Two-color flow cytometric analysis of gated PC for isotype controls FITC-rat IgG2b.κ and Alexa 594 goat IgG. (C) A two-color analysis of gated PC using FITC-mab 2.4G2 IgG anti-RIIb and Alexa 594 goat IgG anti-SR-B1. Two color flow cytometric analysis of gated PC for isotype controls Alexa 594 goat IgG and Alexa 647 mouse IgG1. (E) Two-color flow cytometric analysis of gated PC for Alexa 647 anti β-Catenin and Alexa 594 goat IgG anti-SR-B1. In (A–E), events are represented as blue points, with areas of very high density and high density colored red and yellow, respectively. As in Fig. 5, the percentage of events showing single or double positive expression is indicated in respective quadrants. The results are representative of 3 different experiments.
Figure 7
Figure 7. In liver, SR-B1 is expressed mostly in NPC rather than PC.
Shown is a bar graph comparison of SR-B1-expression by PC and NPC: The multi-color flow-cytometry experiments described and displayed as in Fig. 5 and 6 were each repeated 4 times. The events indicated in the upper right quadrant of the 4 experiments were averaged for each cell-type and expressed in the bar-graph as mean ± SD after correcting for (subtracting) the intensity of isotype-control antibodies. *p < 0.0001.
Figure 8
Figure 8. In liver, SR-B1 mRNA expression is markedly higher in NPC than PC.
Freshly isolated NPC and PC preparations were sorted, and mRNA expression was analyzed using reverse transcriptase quantitative real-time PCR. Relative fluorescence units (RFU) were taken as a quantitative measure of mRNA expression. mRNA expression for both NPC and PC were displayed in a bar graph as mean ± SD mRNA expression per cell after normalization to RAW 264.7 cell RIIb and SR-B1. Statistical significance was analyzed with student’s t-test analysis, **p < 0.01 ***p < 0.05.
Figure 9
Figure 9. Model illustrating the advantages of using ultrathin cryosections for high-resolution IF microscopy.
The figure illustrates plasma membrane structures of LSEC and hepatocytes labeled with fluor-tagged mab 2.4G2 (red) and anti-β-catenin antibody (green). (Left) Schematic model of immunostained liver sinusoid cut into sections of different thicknesses (cryostat section, optical section, and ultrathin cryosection). (Right) Fluorescence signals in the x- and y-dimensions (top view in the z direction). In a top view of conventional cryostat sections (>5 μm thick), 2.4G2 and β-catenin fluorescence signals are indistinguishable, thus presenting false co-localization (yellow). In a confocal view of optical sections (~500 nm thick), the potential for false co-localization is reduced due to less signal diffusion compared to thicker cryostat sections. However, a detailed relationship of LSEC and hepatocytes is still difficult to resolve due to blurring of 2.4G2 and β-catenin fluorescence signals. In a confocal view of ultrathin cryosections (50–150 nm thick), the signal diffusion of fluorescence signals is minimized and the two cells are distinct.

Similar articles

Cited by

References

    1. Miller N. E. & Miller G. J. Letter: High-density lipoprotein and atherosclerosis. Lancet 1, 1033 (1975). - PubMed
    1. Krieger M. Charting the fate of the “good cholesterol”: identification and characterization of the high-density lipoprotein receptor SR-BI. Annu. Rev. Biochem. 68, 523–558 (1999). - PubMed
    1. Trigatti B. L., Krieger M. & Rigotti A. Influence of the HDL receptor SR-BI on lipoprotein metabolism and atherosclerosis. Arterioscler. Thromb. Vasc. Biol. 23, 1732–1738 (2003). - PubMed
    1. Varban M. L. et al. Targeted mutation reveals a central role for SR-BI in hepatic selective uptake of high density lipoprotein cholesterol. Proc. Natl. Acad. Sci. USA 95, 4619–4624 (1998). - PMC - PubMed
    1. Fruhwurth S. et al. High-density lipoprotein endocytosis in endothelial cells. World J. Biol. Chem. 4, 131–140 (2013). - PMC - PubMed

Publication types

MeSH terms