

Serially Transplanted Nonpericytic CD146(-) Adipose Stromal/Stem Cells in Silk Bioscaffolds Regenerate Adipose Tissue In Vivo
- PMID: 26865460
- PMCID: PMC5886026
- DOI: 10.1002/stem.2325
Serially Transplanted Nonpericytic CD146(-) Adipose Stromal/Stem Cells in Silk Bioscaffolds Regenerate Adipose Tissue In Vivo
Abstract
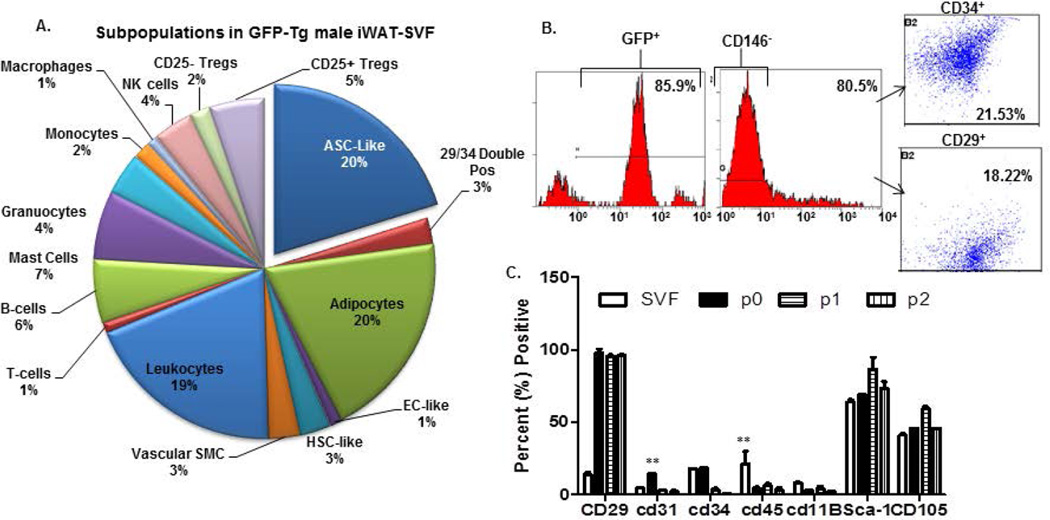
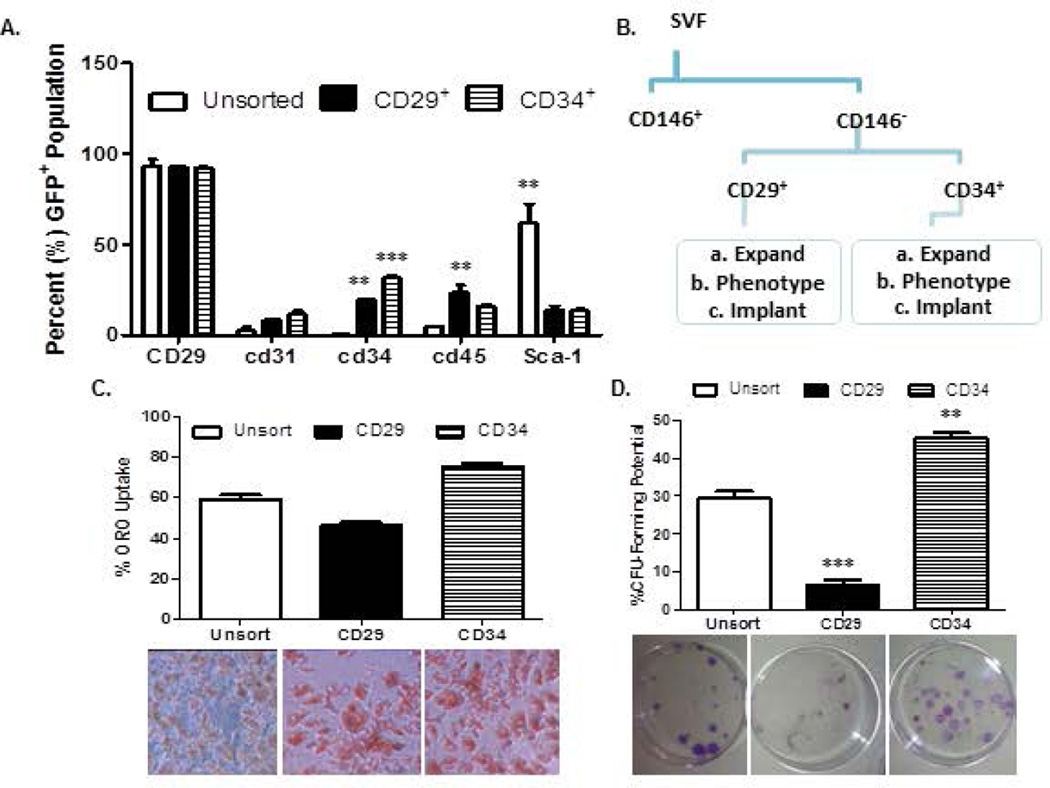
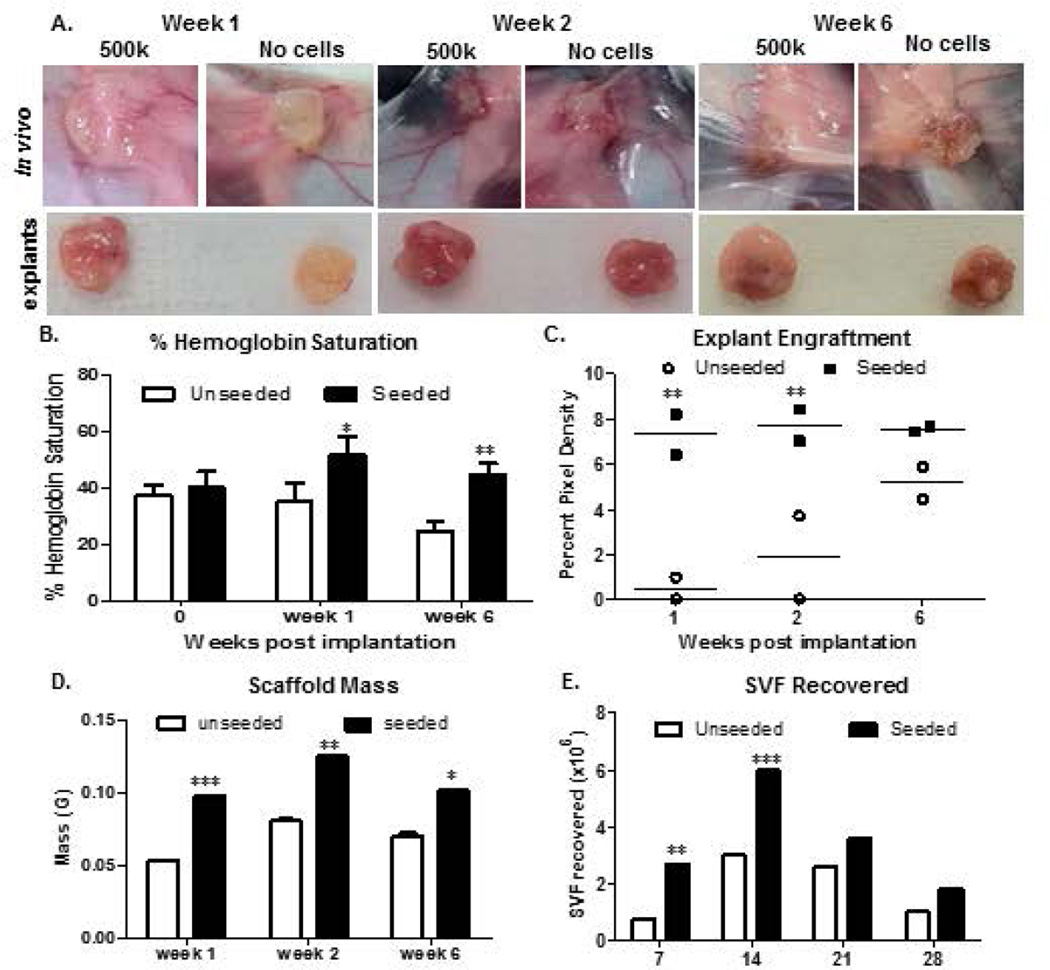
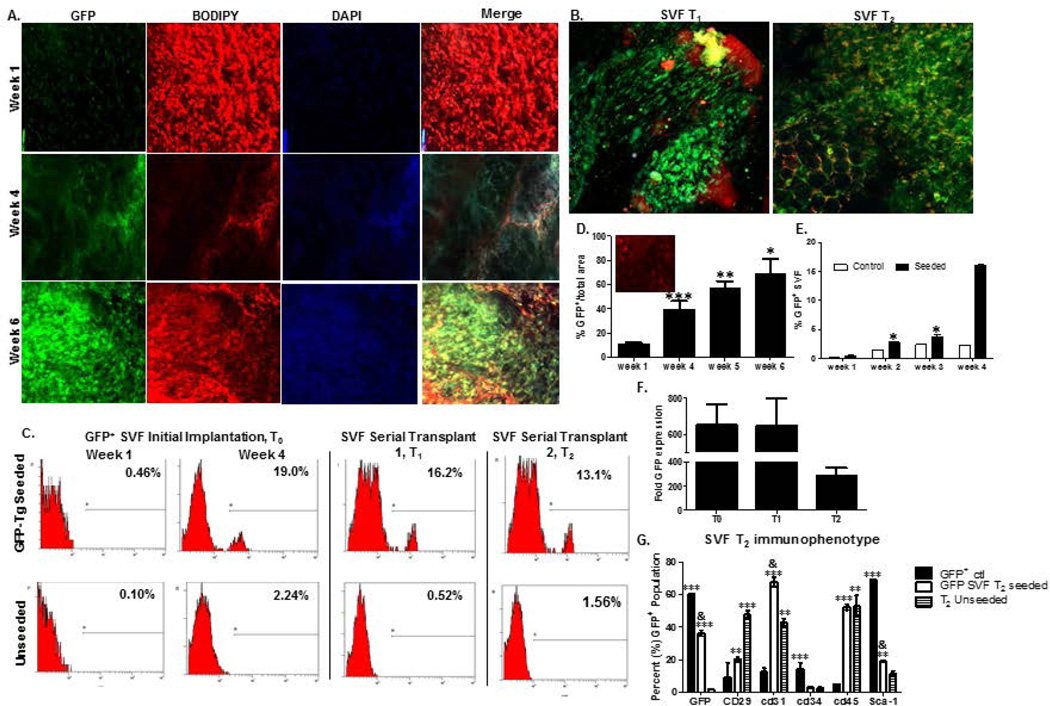
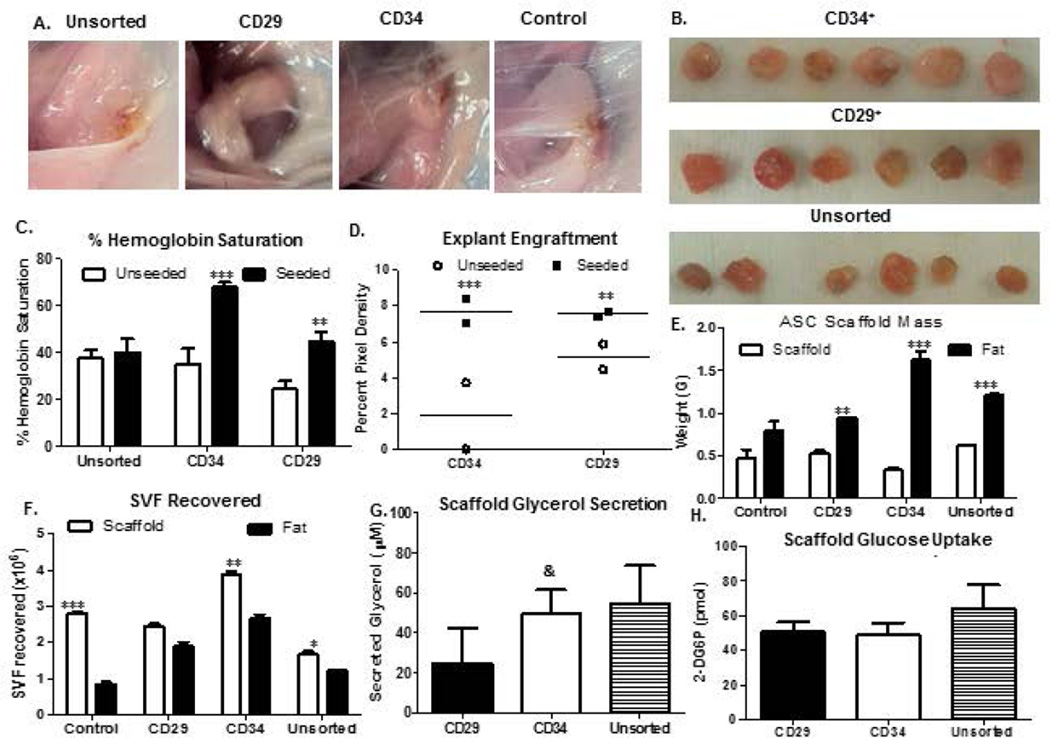
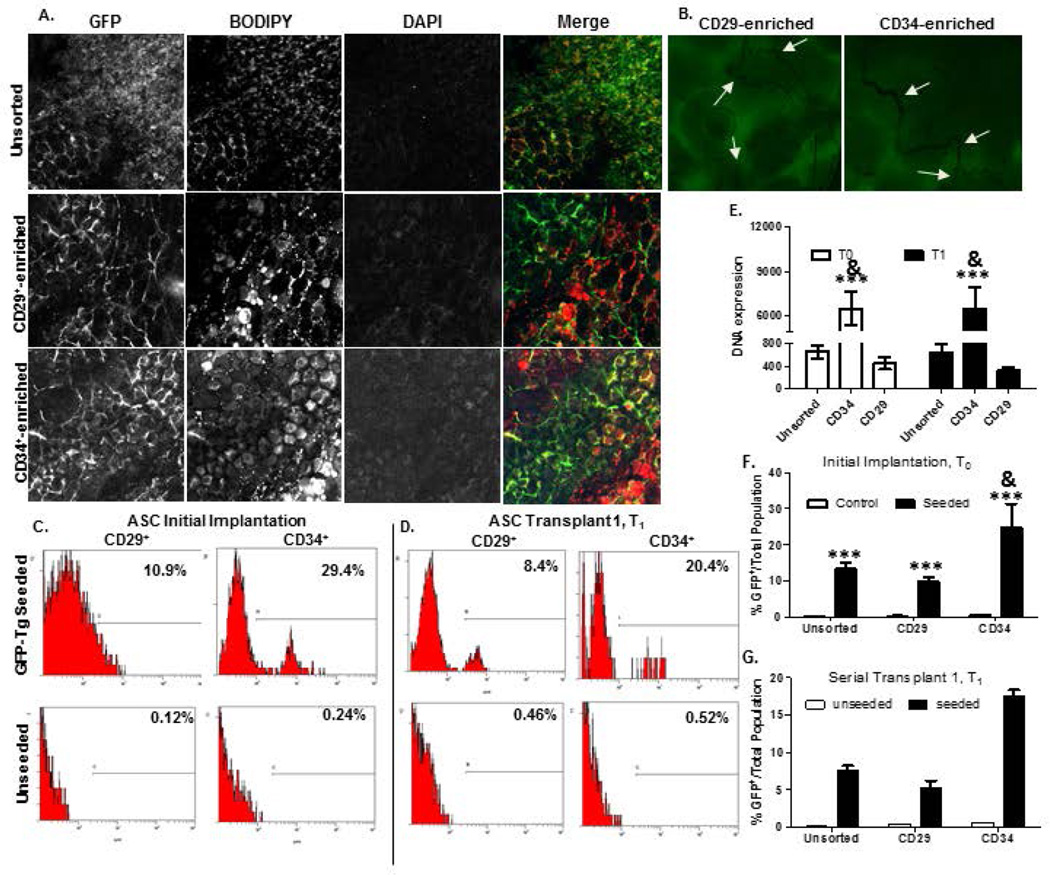
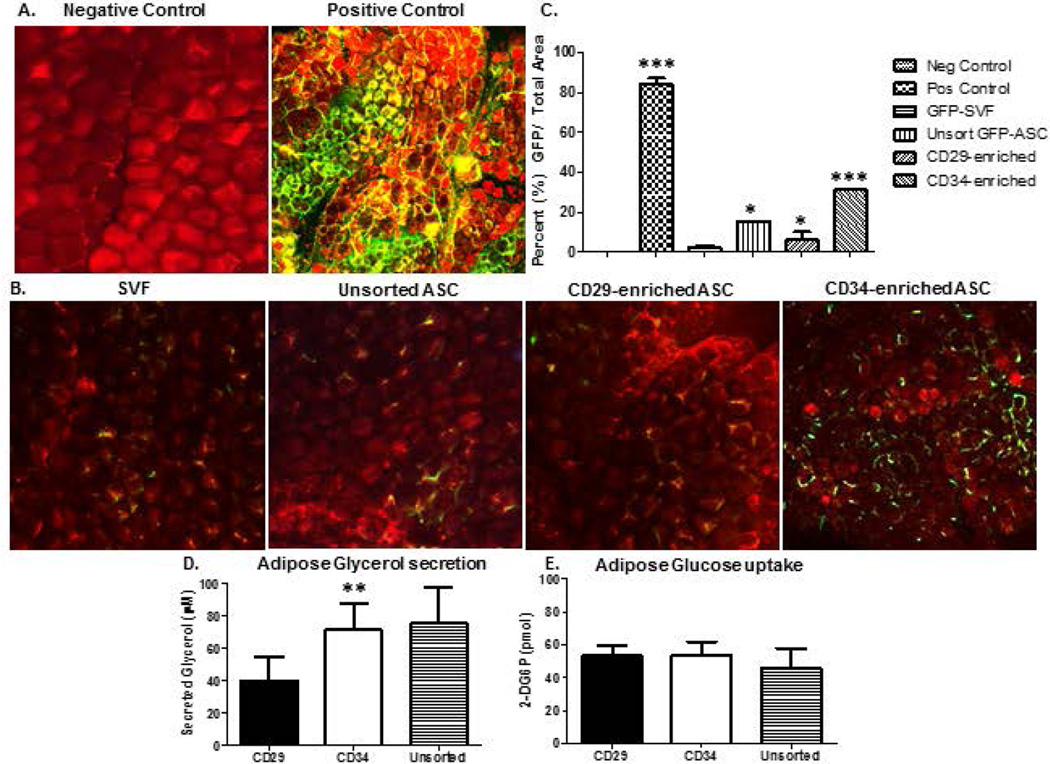
Progenitors derived from the stromal vascular fraction (SVF) of white adipose tissue (WAT) possess the ability to form clonal populations and differentiate along multiple lineage pathways. However, the literature continues to vacillate between defining adipocyte progenitors as "stromal" or "stem" cells. Recent studies have demonstrated that a nonpericytic subpopulation of adipose stromal cells, which possess the phenotype, CD45(-) /CD31(-) /CD146(-) /CD34(+) , are mesenchymal, and suggest this may be an endogenous progenitor subpopulation within adipose tissue. We hypothesized that an adipose progenitor could be sorted based on the expression of CD146, CD34, and/or CD29 and when implanted in vivo these cells can persist, proliferate, and regenerate a functional fat pad over serial transplants. SVF cells and culture expanded adipose stromal/stem cells (ASC) ubiquitously expressing the green fluorescent protein transgene (GFP-Tg) were fractionated by flow cytometry. Both freshly isolated SVF and culture expanded ASC were seeded in three-dimensional silk scaffolds, implanted subcutaneously in wild-type hosts, and serially transplanted. Six-week WAT constructs were removed and evaluated for the presence of GFP-Tg adipocytes and stem cells. Flow cytometry, quantitative polymerase chain reaction, and confocal microscopy demonstrated GFP-Tg cell persistence, proliferation, and expansion, respectively. Glycerol secretion and glucose uptake assays revealed GFP-Tg adipose was metabolically functional. Constructs seeded with GFP-Tg SVF cells or GFP-Tg ASC exhibited higher SVF yields from digested tissue, and higher construct weights, compared to nonseeded controls. Constructs derived from CD146(-) CD34(+) -enriched GFP-Tg ASC populations exhibited higher hemoglobin saturation, and higher frequency of GFP-Tg cells than unsorted or CD29(+) GFP-Tg ASC counterparts. These data demonstrated successful serial transplantation of nonpericytic adipose-derived progenitors that can reconstitute adipose tissue as a solid organ. These findings have the potential to provide new insights regarding the stem cell identity of adipose progenitor cells.
Keywords: Adipose stem cells; Adult stem cells; CD34+; Differentiation; Fluorescence-activated cell sorter; Progenitor cells; Stem cell transplantation; Stromal cells.
© 2016 AlphaMed Press.
Figures
Similar articles
-
Stromal vascular progenitors in adult human adipose tissue.Cytometry A. 2010 Jan;77(1):22-30. doi: 10.1002/cyto.a.20813. Cytometry A. 2010. PMID: 19852056 Free PMC article.
-
Characterization of vasculogenic potential of human adipose-derived endothelial cells in a three-dimensional vascularized skin substitute.Pediatr Surg Int. 2016 Jan;32(1):17-27. doi: 10.1007/s00383-015-3808-7. Epub 2015 Nov 30. Pediatr Surg Int. 2016. PMID: 26621500
-
Engineering adipose tissue from uncultured human adipose stromal vascular fraction on collagen matrix and gelatin sponge scaffolds.Tissue Eng Part A. 2011 Jun;17(11-12):1489-98. doi: 10.1089/ten.TEA.2010.0688. Epub 2011 Mar 4. Tissue Eng Part A. 2011. PMID: 21247363
-
Cell Surface Markers on Adipose-Derived Stem Cells: A Systematic Review.Curr Stem Cell Res Ther. 2017;12(6):484-492. doi: 10.2174/1574888X11666160429122133. Curr Stem Cell Res Ther. 2017. PMID: 27133085
-
Molecular physiognomies and applications of adipose-derived stem cells.Stem Cell Rev Rep. 2015 Apr;11(2):298-308. doi: 10.1007/s12015-014-9578-0. Stem Cell Rev Rep. 2015. PMID: 25504377 Review.
Cited by
-
Human Adipose-Derived Hydrogel Characterization Based on In Vitro ASC Biocompatibility and Differentiation.Stem Cells Int. 2019 Dec 27;2019:9276398. doi: 10.1155/2019/9276398. eCollection 2019. Stem Cells Int. 2019. PMID: 32082388 Free PMC article.
-
Comparative proteomic analyses of human adipose extracellular matrices decellularized using alternative procedures.J Biomed Mater Res A. 2018 Sep;106(9):2481-2493. doi: 10.1002/jbm.a.36444. J Biomed Mater Res A. 2018. PMID: 29693792 Free PMC article.
-
Fat-On-A-Chip Models for Research and Discovery in Obesity and Its Metabolic Comorbidities.Tissue Eng Part B Rev. 2020 Dec;26(6):586-595. doi: 10.1089/ten.TEB.2019.0261. Epub 2020 Dec 3. Tissue Eng Part B Rev. 2020. PMID: 32216545 Free PMC article. Review.
-
Human Adipose Derived Cells in Two- and Three-Dimensional Cultures: Functional Validation of an In Vitro Fat Construct.Stem Cells Int. 2020 Jun 10;2020:4242130. doi: 10.1155/2020/4242130. eCollection 2020. Stem Cells Int. 2020. PMID: 32587620 Free PMC article.
-
The Use of Silk as a Scaffold for Mature, Sustainable Unilocular Adipose 3D Tissue Engineered Systems.Adv Healthc Mater. 2016 Jul;5(13):1667-77. doi: 10.1002/adhm.201600211. Epub 2016 May 19. Adv Healthc Mater. 2016. PMID: 27197588 Free PMC article.
References
-
- Ramalho-Santos M, Willenbring H. On the origin of the term “stem cell”. Cell stem cell. 2007;1:35–38. published online EpubJun 7(10.1016/j.stem.2007.05.013) - PubMed
-
- Guilak F, Lott KE, Awad HA, et al. Clonal analysis of the differentiation potential of human adipose derived adult stem cells. J Cell Physiol. 2006;206:229–237. - PubMed
Publication types
MeSH terms
Substances
Grants and funding
LinkOut - more resources
Full Text Sources
Other Literature Sources
Research Materials
Miscellaneous
