. 2016 Apr 4;23(4):326-38.
doi: 10.1128/CVI.00696-15. Print 2016 Apr.

Humoral and Cell-Mediated Immune Responses to Alternate Booster Schedules of Anthrax Vaccine Adsorbed in Humans

Affiliations

Humoral and Cell-Mediated Immune Responses to Alternate Booster Schedules of Anthrax Vaccine Adsorbed in Humans

Conrad P Quinn et al. Clin Vaccine Immunol. .

Abstract

Protective antigen (PA)-specific antibody and cell-mediated immune (CMI) responses to annual and alternate booster schedules of anthrax vaccine adsorbed (AVA; BioThrax) were characterized in humans over 43 months. Study participants received 1 of 6 vaccination schedules: a 3-dose intramuscular (IM) priming series (0, 1, and 6 months) with a single booster at 42 months (4-IM); 3-dose IM priming with boosters at 18 and 42 months (5-IM); 3-dose IM priming with boosters at 12, 18, 30, and 42 months (7-IM); the 1970 licensed priming series of 6 doses (0, 0.5, 1, 6, 12, and 18 months) and two annual boosters (30 and 42 months) administered either subcutaneously (SQ) (8-SQ) or IM (8-IM); or saline placebo control at all eight time points. Antibody response profiles included serum anti-PA IgG levels, subclass distributions, avidity, and lethal toxin neutralization activity (TNA). CMI profiles included frequencies of gamma interferon (IFN-γ)- and interleukin 4 (IL-4)-secreting cells and memory B cells (MBCs), lymphocyte stimulation indices (SI), and induction of IFN-γ, IL-2, IL-4, IL-6, IL-1β, and tumor necrosis factor alpha (TNF-α) mRNA. All active schedules elicited high-avidity PA-specific IgG, TNA, MBCs, and T cell responses with a mixed Th1-Th2 profile and Th2 dominance. Anti-PA IgG and TNA were highly correlated (e.g., month 7,r(2)= 0.86,P< 0.0001, log10 transformed) and declined in the absence of boosters. Boosters administered IM generated the highest antibody responses. Increasing time intervals between boosters generated antibody responses that were faster than and superior to those obtained with the final month 42 vaccination. CMI responses to the 3-dose IM priming remained elevated up to 43 months. (This study has been registered at ClinicalTrials.gov under registration no. NCT00119067.).


Figures

FIG 1
FIG 1
Correlation of TNA and anti-PA IgG antibody in humans vaccinated with AVA. Shown is a linear regression analysis of TNA (ED50) versus anti-PA IgG in humans vaccinated with AVA postpriming at 43 months (n = 328 observations). The final regression model was log(Yijk) = β0 + αi + β1 × log(xijk). The group-specific intercept shown is the sum of β0 + αi as specified in the model. For example, in the 8-IM study group at month 43, the log TNA ED50 was predicted from log total anti-PA IgG as 0.8 + 0.9 × log(IgG). There was a significant correlation between anti-PA IgG and ED50 at every sample collection time, and the model r2 was high (>0.80) from month 7 through month 31. Statistically significant differences in the intercepts among the study groups were present at months 2, 6, 13, 19, 30, 42, and 43 (shown above). Although differences were small, the direction of the shifts and study groups that differed suggest that the booster TNA response per unit of anti-PA antibody was greater for subjects who had increased intervals between booster vaccinations. Slope and intercept analysis are provided in Tables 2 and 3. Green squares and line, 8-SQ; blue diamonds and line, 8-IM; red triangle and line, 7-IM; pink inverted triangles and line, 5-IM; purple circles and line, 4-IM.
FIG 2
FIG 2
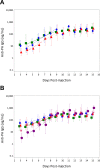
Antibody response kinetics in humans following vaccination at month 6 and month 42. Rates of anti-PA IgG antibody response between treatment groups were analyzed for days 4 to 9 after vaccination with AVA using weighted regression and analysis of variance (ANOVA) with the significance level set at a P value of <0.01. Error bars represent ±1 standard deviation. The study groups have been offset slightly on the x axis to allow the error bars to be seen without overlapping. (A) At month 6, the log10 increase per day of anti-PA IgG was significantly different between the 8-SQ and 8-IM study groups (0.227 versus 0.318; P = 0.0119). The rate of response for the combined 754-IM group was significantly greater than that of the 8-SQ group (0.316 versus 0.227; P = 0.0092). Green squares and line, 8-SQ; blue diamonds and line, 8-IM; red triangles and line, 754-IM. (B) At month 42, the log10 increase per day of anti-PA IgG was not significantly different between the 8-SQ, 8-IM, 7-IM, and 5-IM groups (0.164, 0.150, 0.199, and 0.201, respectively; P values, 0.3211 to 0.6704). The 4-IM study group, however, had a significantly higher response rate (0.335) than did all other groups (P < 0.0001 to 0.0124). Antibody response levels post-day 9 are included for visual comparison. Green squares and line, 8-SQ; blue diamonds and line, 8-IM; red triangles and line, 7-IM; pink inverted triangles and line, 5-IM; purple circles and line, 4-IM.
FIG 3
FIG 3
Anti-PA IgG subclass distributions in humans vaccinated with AVA. Assays for all four IgG subclasses were run when the total anti-PA IgG was ≥5 μg/ml. Relative subclass proportions were determined in a sample when the total anti-PA IgG was ≥12.5 μg/ml, all 4 subclasses were evaluated, and at least one IgG subclass was detected. Anti-PA IgG subclass distributions in the 8-SQ study group (A) and 7-IM (B) study group demonstrate the effect of SQ compared to IM administration. The effects of reduced booster schedules in groups receiving 3-IM priming are represented by the 5-IM (C) and 4-IM (D) boosters. Error bars represent 95% CI. □, IgG1; ⬥, IgG2; △, IgG3; ▼, IgG4.
FIG 4
FIG 4
Anti-PA IgG avidity analyses in humans vaccinated with AVA. Shown are the avidity index (AI) and 95% CI for AVA vaccination groups. Avidity indices were determined by dissociation of antibody-antigen complexes. At month 1, subjects in the 8-SQ and 8-IM study groups (AVA vaccination at month 0 and 0.5) showed anti-PA antibodies with measurable avidity compared to the 7-IM, 5-IM, and 4-IM study groups (AVA vaccination at month 0). At month 2, the AI was measurable in all samples and there were no significant differences between the vaccination study groups. At month 7, AIs ranged from 0.33 to 0.39. The avidity indices remained stable from month 7 through 42 (approximate AI = 0.3 to 0.4), when the AIs for 4-IM and 5-IM were the lowest. At month 43, after the month 42 vaccination, the AI was highest for all study groups (range, 0.45 to 0.55). Error bars represent 95% CI. Green squares, 8-SQ; blue diamonds, 8-IM; red triangles, 7-IM; pink inverted triangles, 5-IM; purple circles, 4-IM.
FIG 5
FIG 5
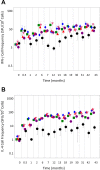
Frequencies of IFN-γ- and IL-4-secreting cells in humans vaccinated with AVA. (A) Frequencies of IFN-γ-secreting cells (mean SFU/106 PBMCs) determined by ELISpot analyses. At month 1, the 8-SQ and 8-IM groups showed a significant increase in the number of IFN-γ-secreting cells compared to the placebo controls; the 8-IM group showed a significant increase compared to 4-IM group. There was a significant difference in the number of SFU/106 cells between the various vaccination groups. Error bars indicate 1 standard error (SE). (B) Frequencies of IL-4-secreting cells (mean SFU/106 PBMCs) determined by ELISpot analyses. At month 1, significantly more IL-4 SFU/106 cells were detected in the 8-IM group than in the 8-SQ group at this early time point. Both the 8-IM and 8-SQ groups had more IL-4 SFU/106 cells than any of the reduced-schedule vaccination groups at month 1, indicating the impact of the month 0.5 vaccination on the rapidity of the immune response to PA. The frequency of circulating memory T cells capable of secreting IL-4 when stimulated with PA remained significantly higher for all vaccination groups than for the control arm for the duration of the study, 43 months. These data are consistent with AVA stimulating long-term memory T cells to PA. Error bars indicate 1 SE. Green squares, 8-SQ; blue diamonds, 8-IM; red triangles, 7-IM; pink inverted triangles, 5-IM; purple circles, 4-IM; black circles, control.
FIG 6
FIG 6
Lymphocyte stimulation indices (SI) in humans vaccinated with AVA. The lymphocyte (T cell) proliferation assay provides a very sensitive method for demonstrating the induction of long-term PA-specific memory lymphocytes in PMBCs. Significant SI responses were detected at month 1 in the 8-SQ and 8-IM groups. All of the values for the vaccine treatment groups were significantly higher than for the placebo controls by month 2. SI was sustained at significantly higher levels than controls in all groups for the duration of the study. Error bars indicate 95% CI. Green squares, 8-SQ; blue diamonds, 8-IM; red triangles, 7-IM; pink inverted triangles, 5-IM; purple circles, 4-IM; black circles, control.

References

    1. Chen L, Schiffer JM, Dalton S, Sabourin CL, Niemuth NA, Plikaytis BD, Quinn CP. 2014. Comprehensive analysis and selection of anthrax vaccine adsorbed immune correlates of protection in rhesus macaques. Clin Vaccine Immunol 21:1512–1520. doi:10.1128/CVI.00469-14. - DOI - PMC - PubMed
    1. Fay MP, Follmann DA, Lynn F, Schiffer JM, Stark GV, Kohberger R, Quinn CP, Nuzum EO. 2012. Anthrax vaccine-induced antibodies provide cross-species prediction of survival to aerosol challenge. Sci Transl Med 4:151ra126. - PMC - PubMed
    1. Schiffer JM, Chen L, Dalton S, Niemuth NA, Sabourin CL, Quinn CP. 2015. Bridging non-human primate correlates of protection to reassess the anthrax vaccine adsorbed booster schedule in humans. Vaccine 33:3709–3716. doi:10.1016/j.vaccine.2015.05.091. - DOI - PMC - PubMed
    1. Marano N, Plikaytis BD, Martin SW, Rose C, Semenova VA, Martin SK, Freeman AE, Li H, Mulligan MJ, Parker SD, Babcock J, Keitel W, El Sahly H, Poland GA, Jacobson RM, Keyserling HL, Soroka SD, Fox SP, Stamper JL, McNeil MM, Perkins BA, Messonnier N, Quinn CP. 2008. Effects of a reduced dose schedule and intramuscular administration of anthrax vaccine adsorbed on immunogenicity and safety at 7 months: a randomized trial. JAMA 300:1532–1543. doi:10.1001/jama.300.13.1532. - DOI - PubMed
    1. Pittman PR, Kim-Ahn G, Pifat DY, Coonan K, Gibbs P, Little S, Pace-Templeton JG, Myers R, Parker GW, Friedlander AM. 2002. Anthrax vaccine: immunogenicity and safety of a dose-reduction, route-change comparison study in humans. Vaccine 20:1412–1420. doi:10.1016/S0264-410X(01)00462-5. - DOI - PubMed

Publication types

MeSH terms

Associated data