. 2016 Feb 10;36(6):1841-57.
doi: 10.1523/JNEUROSCI.3518-15.2016.

Interdigitated Color- and Disparity-Selective Columns within Human Visual Cortical Areas V2 and V3

Affiliations

Interdigitated Color- and Disparity-Selective Columns within Human Visual Cortical Areas V2 and V3

Shahin Nasr et al. J Neurosci. .

Abstract

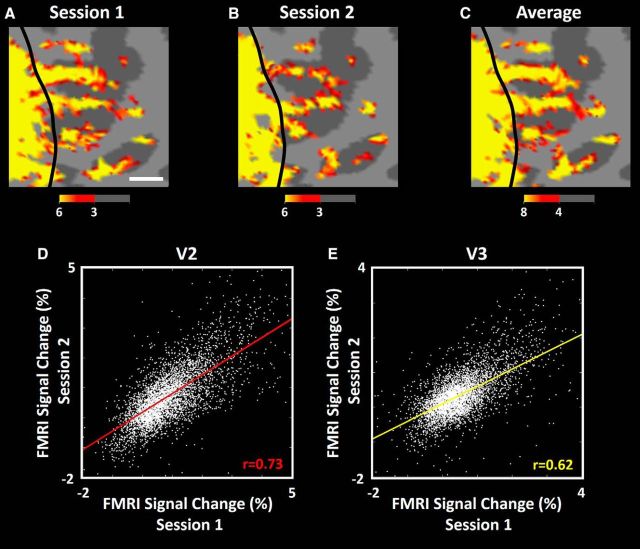
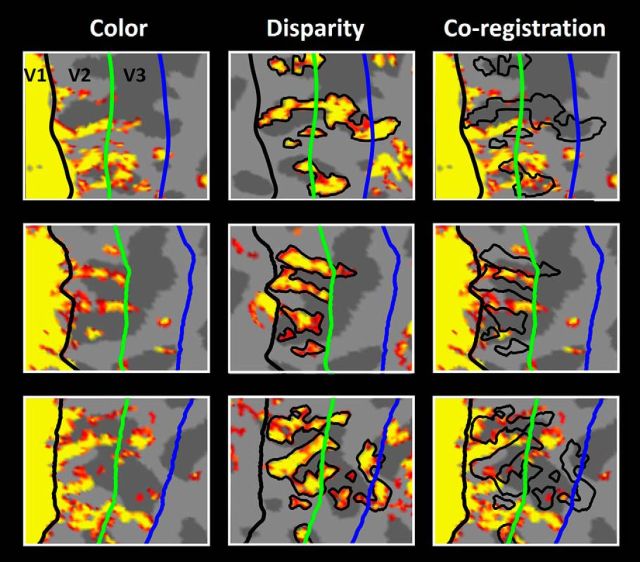
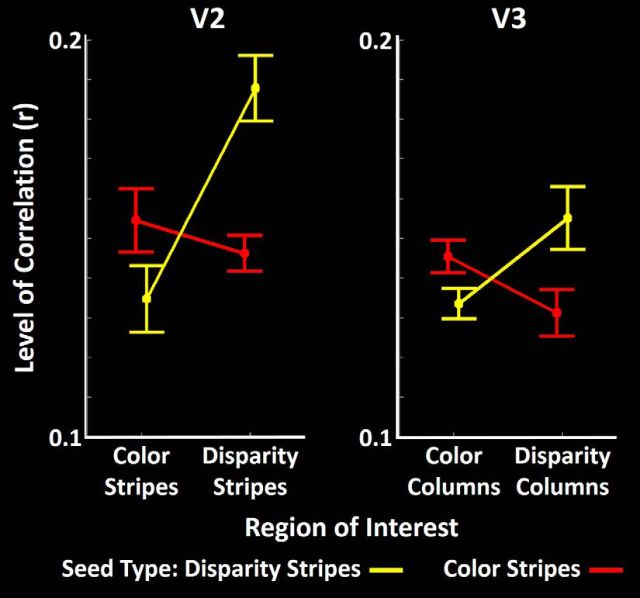
In nonhuman primates (NHPs), secondary visual cortex (V2) is composed of repeating columnar stripes, which are evident in histological variations of cytochrome oxidase (CO) levels. Distinctive "thin" and "thick" stripes of dark CO staining reportedly respond selectively to stimulus variations in color and binocular disparity, respectively. Here, we first tested whether similar color-selective or disparity-selective stripes exist in human V2. If so, available evidence predicts that such stripes should (1) radiate "outward" from the V1-V2 border, (2) interdigitate, (3) differ from each other in both thickness and length, (4) be spaced ∼3.5-4 mm apart (center-to-center), and, perhaps, (5) have segregated functional connections. Second, we tested whether analogous segregated columns exist in a "next-higher" tier area, V3. To answer these questions, we used high-resolution fMRI (1 × 1 × 1 mm(3)) at high field (7 T), presenting color-selective or disparity-selective stimuli, plus extensive signal averaging across multiple scan sessions and cortical surface-based analysis. All hypotheses were confirmed. V2 stripes and V3 columns were reliably localized in all subjects. The two stripe/column types were largely interdigitated (e.g., nonoverlapping) in both V2 and V3. Color-selective stripes differed from disparity-selective stripes in both width (thickness) and length. Analysis of resting-state functional connections (eyes closed) showed a stronger correlation between functionally alike (compared with functionally unlike) stripes/columns in V2 and V3. These results revealed a fine-scale segregation of color-selective or disparity-selective streams within human areas V2 and V3. Together with prior evidence from NHPs, this suggests that two parallel processing streams extend from visual subcortical regions through V1, V2, and V3.

Significance statement: In current textbooks and reviews, diagrams of cortical visual processing highlight two distinct neural-processing streams within the first and second cortical areas in monkeys. Two major streams consist of segregated cortical columns that are selectively activated by either color or ocular interactions. Because such cortical columns are so small, they were not revealed previously by conventional imaging techniques in humans. Here we demonstrate that such segregated columnar systems exist in humans. We find that, in humans, color versus binocular disparity columns extend one full area further, into the third visual area. Our approach can be extended to reveal and study additional types of columns in human cortex, perhaps including columns underlying more cognitive functions.

Keywords: high-resolution fMRI; stereoscopic depth; streams; stripes; visual features.


Figures

Figure 1.
Figure 1.
Histological tissue section showing varying levels (darker = higher) of the metabolic enzyme CO, in flattened visual cortex in the right hemisphere of a monkey (Saimiri sciureus). The discrete darkly stained region on the left is V1. Immediately anterior (to the right) is area V2, including layers 4 and 5. The darkly stained CO stripes in V2 are subdivided into thin (thin red triangles) and thick (wider green triangles). The thin stripes extend contiguously to the V1–V2 border; the thick stripes terminate slightly shy of the V1–V2 border. Scale bar, 2 mm. Figure adapted from Tootell et al., 1983.
Figure 2.
Figure 2.
A, A sample of stimuli used for luminance adjustment across central (0–2°), middle (2–5°), and peripheral (5–10°) eccentricities. B, C, The measured level of luminance for gray (B) and red (C) colors that match the luminance of maximum blue values in the scanner display. D, E, Samples of achromatic (D) and chromatic (red/blue; E) stimuli. Error bars indicate 1 SEM.
Figure 3.
Figure 3.
FMRI evidence for color-selective stripes acquired at 7 T in the right hemisphere of Subject 1. Regions with significantly increased higher color selectivity are shown in red through yellow, respectively. A, The “inflated” cortical surface viewed from a posterior viewpoint. B, The same data in a fully “flattened” cortical surface. Patchy stripes (e.g., white triangles in A) radiate “outward” from (approximately perpendicular to) the border between V1 and V2, which is consistent with the topography of thin stripes in the CO patterns in V2 of NHPs (Fig. 1). As predicted, analogous stripes are absent in peripheral V1. Stripes and/or columns of color-selective activity are also evident in area V3, and (to a lesser extent) anterior to V3. Solid and dashed black lines indicate the borders of V2 with V1 and V3 areas (respectively), based on independent retinotopy mapping scans in this subject. Dotted black lines indicate the border between stimulated versus nonstimulated portions of V1. B, Bottom right, The black arrowhead indicates the color-selective region “VO/V8′. Scale bar, 1 cm.
Figure 4.
Figure 4.
Consistency of the activity maps across scan sessions in one subject (Subject 2). A–C, Maps of color-selective activity (as in Fig. 3), acquired independently in two sessions (A, B), plus the average of those two sessions (C). All maps show strong similarities among the activity recorded during the first, second, and averaged activity. The averaged map is statistically stronger than either of the two component images, as reflected in the higher thresholds in the right panel (see activity scale bars). Scale bar, 5 mm. D, E, The correlation of BOLD values (color vs luminance) between the two sessions (p > 10−3). Each white dot represents activity in one vertex within either the left or right hemisphere, in the first vs second scan sessions, throughout the activated representation of V2 (D) and V3 (E).
Figure 5.
Figure 5.
Consistency across sessions in all seven remaining subjects. Each row shows data from one subject. Maps from a given cortical location are shown for one individual and group averaged scan sessions (first and second columns, respectively). The third and fourth columns show between-session correlation plots in V2 and V3, respectively. In all subjects, the level of correlation between activities recorded in the two independent sessions was highly significant (p > 10−3). Other details are as in Figure 4.
Figure 6.
Figure 6.
Effect of depth variation in color-selective stripes/columns in V2/V3 of Subject 3. A–C, Color-selective activity in the superficial, middle, and deep cortical layers (see Materials and Methods), respectively. Generally, maps from the lower layers are similar to those in the middle layers, which is consistent with radially extending fMRI activity. However, maps from superficial layers (A) include large blotches, presumably arising from draining veins. Despite these large blotches, a few stripes/columns can be seen in these superficial maps, which correspond topographically to those in the middle and lower depths/layers (cyan arrowhead). Other details are as in Figure 3. The four graphs in D and E show the correlation of color-selective activity sampled across deep vs superficial layers of V2 and V3. The bottom two graphs show the analogous analysis along an orthogonal axis, sampled within a common (deep) depth/layer. Sampling length was equivalent in the across-column vs within-column analyses. The correlation was significantly higher between activities sampled within columns compared with across columns in V2 (z = 24.98) and V3 (z = 28.88) areas, suggesting a strong columnar component in our BOLD maps.
Figure 7.
Figure 7.
Analogous analyses of columnar organization (as described in Fig. 6) from the remaining seven subjects. Again, the data show a stronger correlation between activities sampled within columns compared with across columns in V2 (z > 9.17) and V3 (z > 8.32). This supports a columnar organization in all subjects.
Figure 8.
Figure 8.
Activity maps produced by two types of ocular interaction. A, Disparity-selective activity in Subject 1, to facilitate comparisons with Figure 3B. The disparity-varying stimulus produced clear stripes/columns within areas V2 and V3, compared with zero disparity stimuli. B, Well known pattern of ocular dominance columns evoked by binocular vs monocular stimuli in the same subject. This map showed systematically spaced stripes largely confined to area V1. Scale bar, 1 cm.
Figure 9.
Figure 9.
Consistency across sessions for the disparity-selective stimulus contrast, for all six subjects tested, in areas V2 (left) and V3 (right). Here again, all subjects showed a correlation between activities recorded in the two independent sessions that was highly significant (p > 10−3). Other details are as in Figure 5.
Figure 10.
Figure 10.
A, Map of ODCs within one hemifield of Subject 1 based on a voxel size of 0.8 mm, isotropic. B, C, Enlarged ODCs within a V1 subfield (A, yellow square) acquired using voxels of 0.8 and 1.0 mm (isotropic) during independent scan sessions. The overall pattern of ODCs remained similar across the two spatial resolutions. D, E, ODCs in two other subjects (3 and 6) acquired using voxels of 1.0 mm isotropic, as in C.
Figure 11.
Figure 11.
The consistency between ODC maps acquired in different scan sessions based on 1.0 mm (isotropic) voxels. Each panel shows the correlation between BOLD values (left vs right eye stimulation) between the two sessions (p > 10−3).
Figure 12.
Figure 12.
Evidence for an interdigitation of color-selective vs disparity-selective stripes/columns in V2/V3. Each row shows data from different subjects (Subjects 1, 2, and 5, from top to bottom). The leftmost panels show the color-selective maps. The middle panels show the disparity-selective maps, from the corresponding cortical locations. The disparity stripes/columns are outlined in black. The right panels show the overlay of color stripes (yellow-red activity map) and the disparity stripes/columns (black outlines). A strong tendency for nonoverlap is evident. The borders between V1, V2, and V3 are color coded as in the top left panel.
Figure 13.
Figure 13.
Overlap in the color-selective or disparity-selective maps, with variations in threshold and alignment, within V2 (left) and V3 (right). In both panels, the percentage of overlap (i.e., the number of vertices that show selectivity for color and disparity relative to the overall number of selective vertices) is shown for multiple threshold levels (in half-logarithmic steps), when the two maps were either precisely aligned (yellow) or topographically shuffled (cyan). Data were combined from all six subjects who participated in both Experiments 1 and 2. In both V2 and V3, the amount of overlap was significantly lower when maps were aligned rather than shuffled. Error bars indicate 1 SEM.
Figure 14.
Figure 14.
Level of correlation between color-selective and disparity-selective vertices within V2 (left) and V3 (right). In both areas, the level of correlation was significantly (p < 0.05) stronger (more negative) than the chance level (i.e., r = 0). Error bars indicate 1 SEM.
Figure 15.
Figure 15.
Evidence consistent with a topographic gap between V1 and fMRI-defined thick (but not thin) stripes. The figure shows the percentage of color-selective (top) and disparity-selective (bottom) vertices, across the normalized width of V2, relative to the V1/V2 border. The left panels show these data in Subject 5. The right panels show the group-averaged data from all six subjects. In all panels, the selectivity percentage was measured at the same threshold level (p = 10−2) for color and disparity maps. Fewer disparity-selective vertices were found near the V1/V2 borders relative to the color-selective vertices. This finding is consistent with CO-defined differences in thick vs thin stripes, respectively (e.g., Fig. 1).
Figure 16.
Figure 16.
Level of functional connection, measured during the resting state, between functionally alike and unlike stripes/columns in V2/V3 (left/right panels, respectively). Each panel shows the level of correlation between activity within color-selective and disparity-selective stripes/columns in V2/V3 after seeding color-selective (red) and disparity-selective (yellow) stripes/columns in the opposite hemisphere. These results suggest a relatively stronger functional connection between functionally alike rather than unlike stripes/columns in V2/V3.

Similar articles

Cited by

References

    1. Adachi Y, Osada T, Sporns O, Watanabe T, Matsui T, Miyamoto K, Miyashita Y. Functional connectivity between anatomically unconnected areas is shaped by collective network-level effects in the macaque cortex. Cereb Cortex. 2012;22:1586–1592. doi: 10.1093/cercor/bhr234. - DOI - PubMed
    1. Adams DL, Zeki S. Functional organization of macaque V3 for stereoscopic depth. J Neurophysiol. 2001;86:2195–2203. - PubMed
    1. Adams DL, Sincich LC, Horton JC. Complete pattern of ocular dominance columns in human primary visual cortex. J Neurosci. 2007;27:10391–10403. doi: 10.1523/JNEUROSCI.2923-07.2007. - DOI - PMC - PubMed
    1. Adams DL, Piserchia V, Economides JR, Horton JC. Vascular supply of the cerebral cortex is specialized for cell layers but not columns. Cereb Cortex. 2015;25:3673–3681. doi: 10.1093/cercor/bhu221. - DOI - PMC - PubMed
    1. Bilodeau L, Faubert J. Isoluminance and chromatic motion perception throughout the visual field. Vision Res. 1997;37:2073–2081. doi: 10.1016/S0042-6989(97)00012-6. - DOI - PubMed

Publication types

Substances

LinkOut - more resources