

Inactivation of the Dorsal Premotor Area Disrupts Internally Generated, But Not Visually Guided, Sequential Movements
- PMID: 26865620
- PMCID: PMC4748079
- DOI: 10.1523/JNEUROSCI.2356-15.2016
Inactivation of the Dorsal Premotor Area Disrupts Internally Generated, But Not Visually Guided, Sequential Movements
Abstract
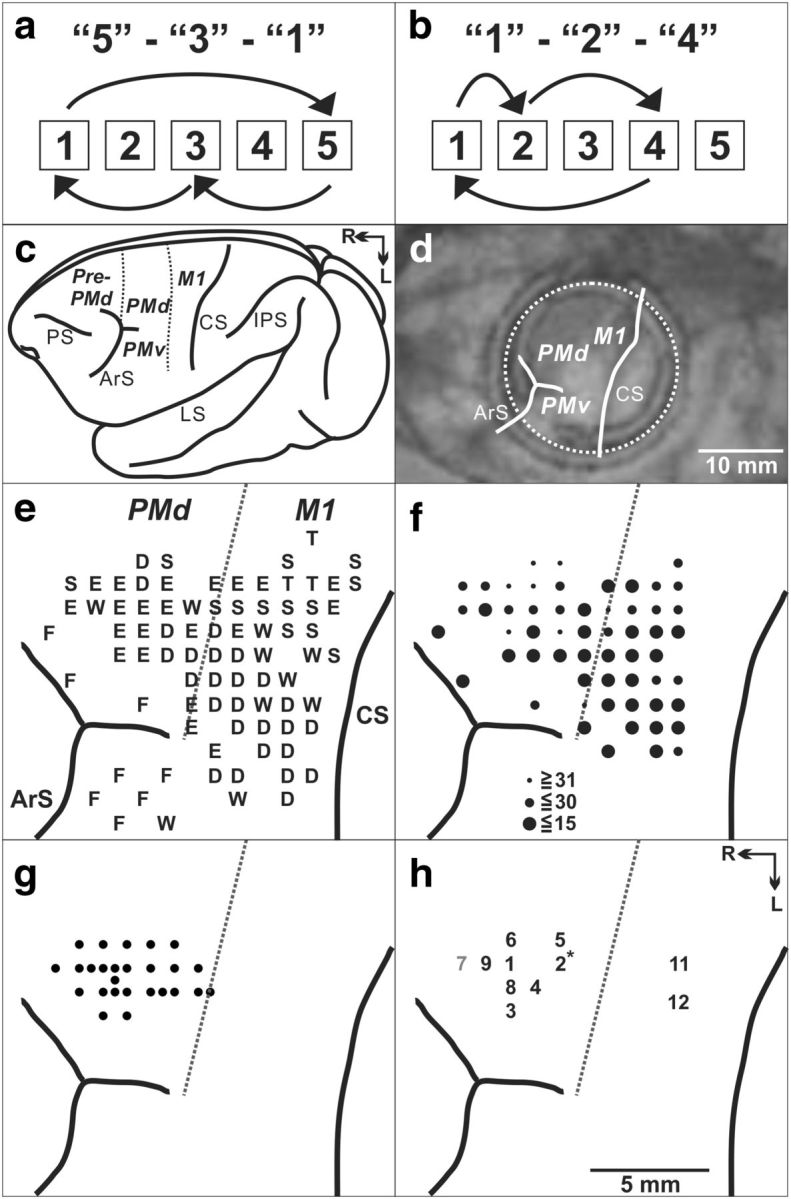
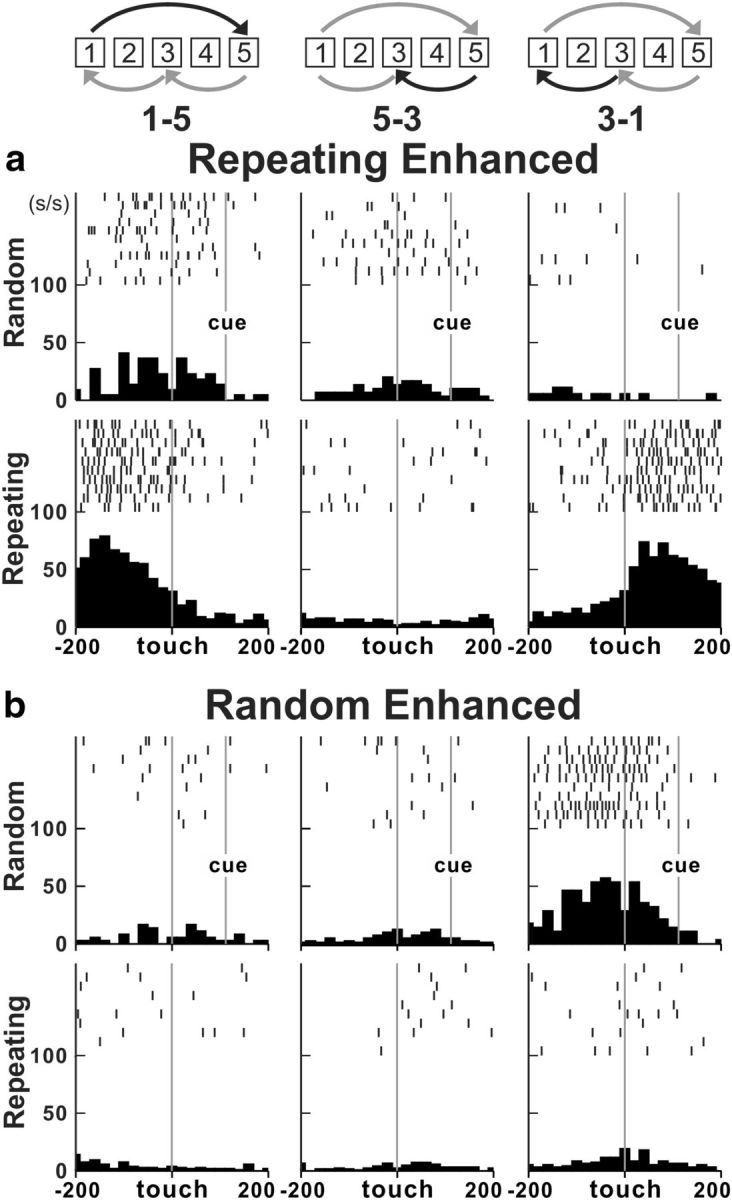
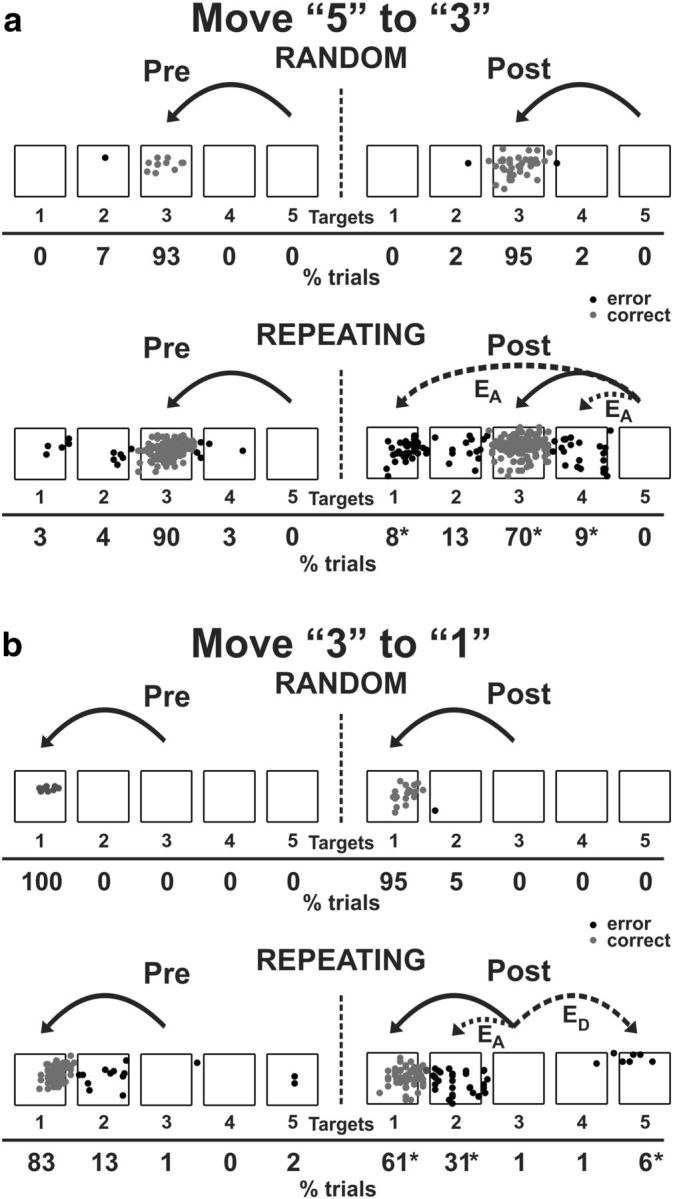
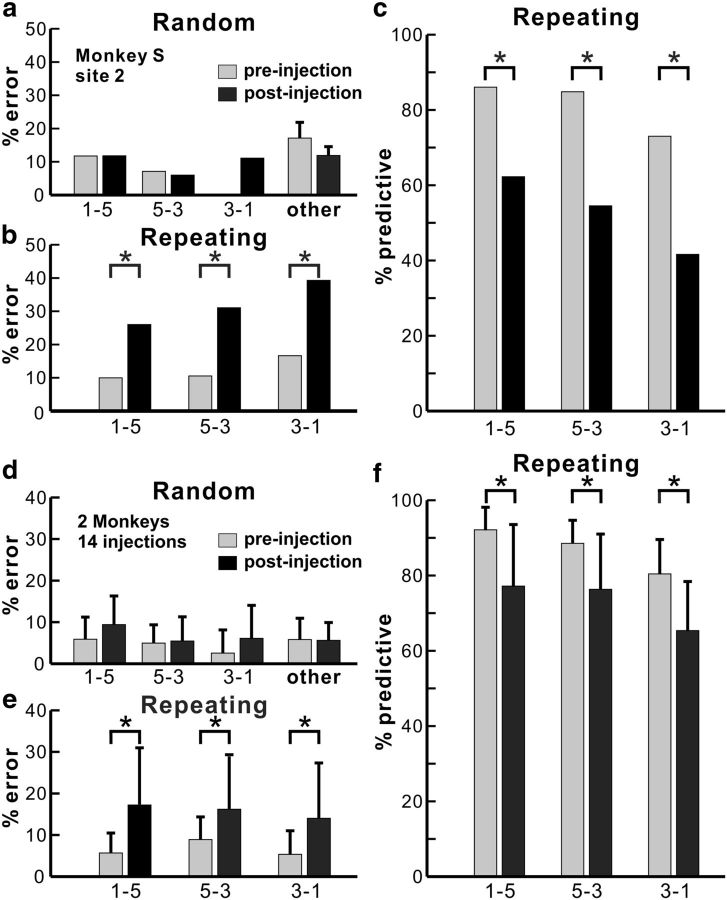
As skill on a sequence of movements is acquired through practice, each movement in the sequence becomes seamlessly associated with another. To study the neural basis of acquired skills, we trained two monkeys (Cebus apella) to perform two sequential reaching tasks. In one task, sequential movements were instructed by visual cues, whereas in the other task, movements were generated from memory after extended practice. Then, we examined neural activity in the dorsal premotor area (PMd) and the effects of its local inactivation during performance of each task. Comparable numbers of neurons in the PMd were active during the two tasks. However, inactivation of the PMd had a marked effect only on the performance of sequential movements that were guided by memory. These results emphasize the importance of the PMd in the internal generation of sequential movements, perhaps through maintaining arbitrary motor-motor associations.
Significance statement: The dorsal premotor cortex (PMd) has long been thought to be a critical node in the cortical networks responsible for visually guided reaching. Here we show that PMd neurons are active during both visually guided and internally generated sequential movements. In addition, we found that local inactivation of the PMd has a marked effect only on the performance of sequential movements that were internally generated. These observations suggest that, although the PMd may participate in the generation of visually guided sequences, it is more important for the generation of internally guided sequences.
Copyright © 2016 Ohbayashi et al.
Figures
Similar articles
-
Inhibition of protein synthesis in M1 of monkeys disrupts performance of sequential movements guided by memory.Elife. 2020 Feb 10;9:e53038. doi: 10.7554/eLife.53038. Elife. 2020. PMID: 32039760 Free PMC article.
-
Differential effects of muscimol microinjection into dorsal and ventral aspects of the premotor cortex of monkeys.J Neurophysiol. 1994 Mar;71(3):1151-64. doi: 10.1152/jn.1994.71.3.1151. J Neurophysiol. 1994. PMID: 8201409
-
Preferential representation of instructed target location versus limb trajectory in dorsal premotor area.J Neurophysiol. 1997 Mar;77(3):1195-212. doi: 10.1152/jn.1997.77.3.1195. J Neurophysiol. 1997. PMID: 9084590
-
Neuronal activity in the primate premotor, supplementary, and precentral motor cortex during visually guided and internally determined sequential movements.J Neurophysiol. 1991 Sep;66(3):705-18. doi: 10.1152/jn.1991.66.3.705. J Neurophysiol. 1991. PMID: 1753282
-
Information processing for motor control in primate premotor cortex.Behav Brain Res. 1994 Apr 18;61(2):135-42. doi: 10.1016/0166-4328(94)90154-6. Behav Brain Res. 1994. PMID: 8037861 Review.
Cited by
-
Sequential Reaching Task for the Study of Motor Skills in Monkeys.Bio Protoc. 2020 Aug 20;10(16):e3719. doi: 10.21769/BioProtoc.3719. eCollection 2020 Aug 20. Bio Protoc. 2020. PMID: 33659383 Free PMC article.
-
Impairment and Compensation in Dexterous Upper-Limb Function After Stroke. From the Direct Consequences of Pyramidal Tract Lesions to Behavioral Involvement of Both Upper-Limbs in Daily Activities.Front Hum Neurosci. 2021 Jun 21;15:662006. doi: 10.3389/fnhum.2021.662006. eCollection 2021. Front Hum Neurosci. 2021. PMID: 34234659 Free PMC article. Review.
-
Inhibition of protein synthesis in M1 of monkeys disrupts performance of sequential movements guided by memory.Elife. 2020 Feb 10;9:e53038. doi: 10.7554/eLife.53038. Elife. 2020. PMID: 32039760 Free PMC article.
-
The Multiple Representations of Complex Digit Movements in Primary Motor Cortex Form the Building Blocks for Complex Grip Types in Capuchin Monkeys.J Neurosci. 2019 Aug 21;39(34):6684-6695. doi: 10.1523/JNEUROSCI.0556-19.2019. Epub 2019 Jun 24. J Neurosci. 2019. PMID: 31235643 Free PMC article.
-
Premotor dorsal white matter integrity for the prediction of upper limb motor impairment after stroke.Sci Rep. 2019 Dec 23;9(1):19712. doi: 10.1038/s41598-019-56334-w. Sci Rep. 2019. PMID: 31873186 Free PMC article.
References
Publication types
MeSH terms
Substances
Grants and funding
LinkOut - more resources
Full Text Sources
Other Literature Sources
Research Materials