. 2016 Apr 8;291(15):7990-8003.
doi: 10.1074/jbc.M115.711127. Epub 2016 Feb 10.

A Highly Conserved Salt Bridge Stabilizes the Kinked Conformation of β2,3-Sheet Essential for Channel Function of P2X4 Receptors

Affiliations

A Highly Conserved Salt Bridge Stabilizes the Kinked Conformation of β2,3-Sheet Essential for Channel Function of P2X4 Receptors

Wen-Shan Zhao et al. J Biol Chem. .

Abstract

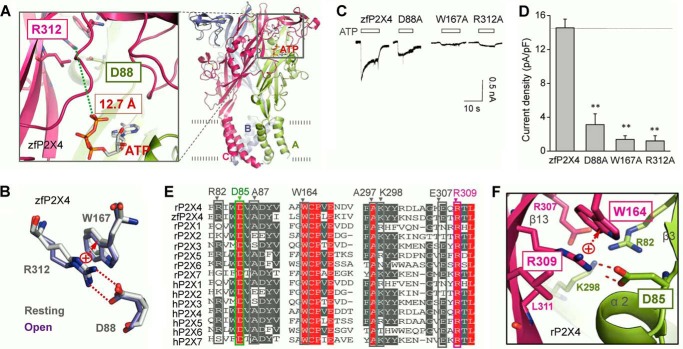
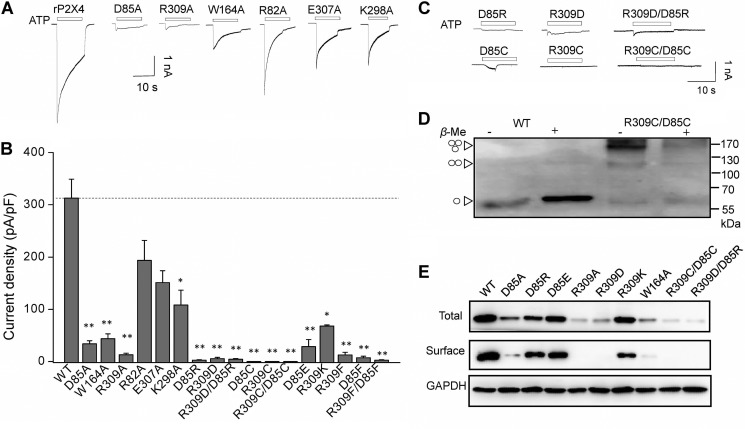
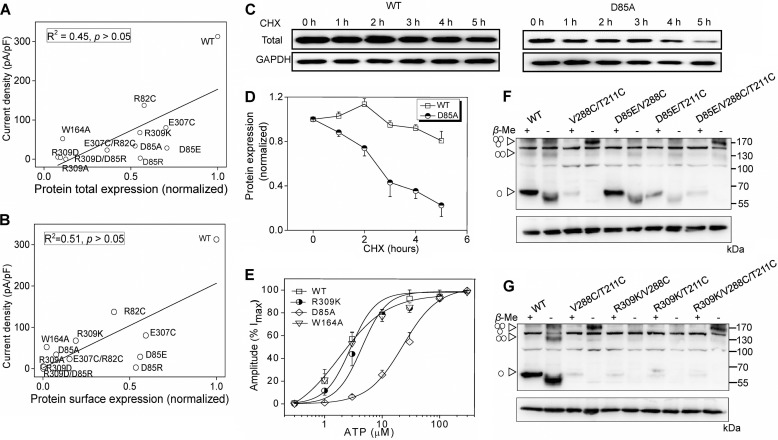
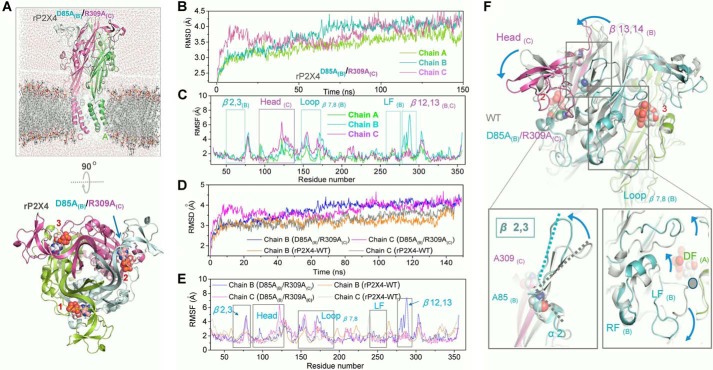
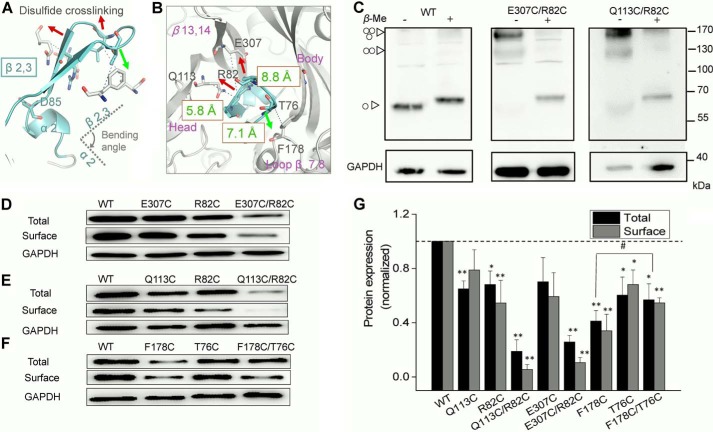
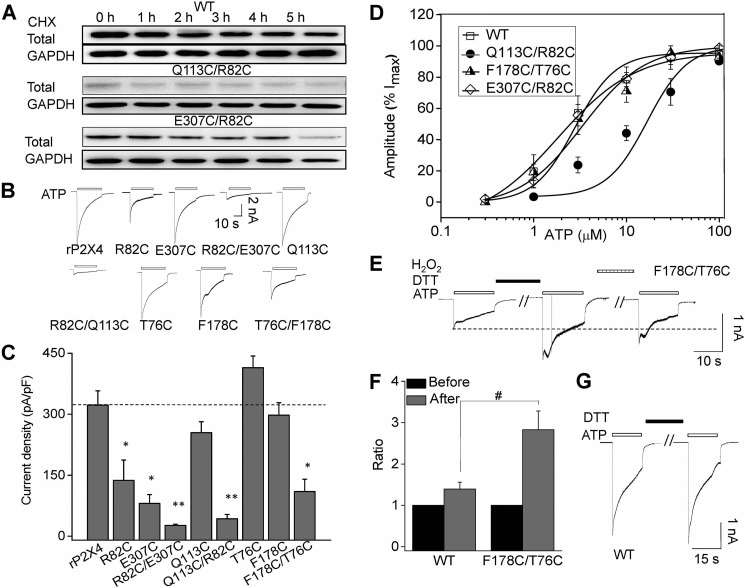
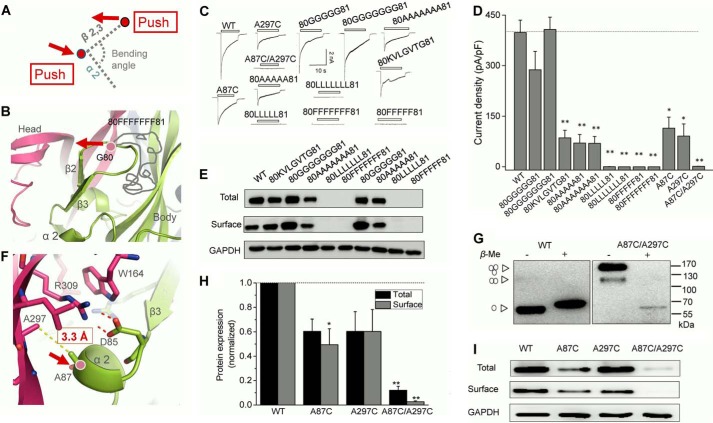
Significant progress has been made in understanding the roles of crucial residues/motifs in the channel function of P2X receptors during the pre-structure era. The recent structural determination of P2X receptors allows us to reevaluate the role of those residues/motifs. Residues Arg-309 and Asp-85 (rat P2X4 numbering) are highly conserved throughout the P2X family and were involved in loss-of-function polymorphism in human P2X receptors. Previous studies proposed that they participated in direct ATP binding. However, the crystal structure of P2X demonstrated that those two residues form an intersubunit salt bridge located far away from the ATP-binding site. Therefore, it is necessary to reevaluate the role of this salt bridge in P2X receptors. Here, we suggest the crucial role of this structural element both in protein stability and in channel gating rather than direct ATP interaction and channel assembly. Combining mutagenesis, charge swap, and disulfide cross-linking, we revealed the stringent requirement of this salt bridge in normal P2X4 channel function. This salt bridge may contribute to stabilizing the bending conformation of the β2,3-sheet that is structurally coupled with this salt bridge and the α2-helix. Strongly kinked β2,3 is essential for domain-domain interactions between head domain, dorsal fin domain, right flipper domain, and loop β7,8 in P2X4 receptors. Disulfide cross-linking with directions opposing or along the bending angle of the β2,3-sheet toward the α2-helix led to loss-of-function and gain-of-function of P2X4 receptors, respectively. Further insertion of amino acids with bulky side chains into the linker between the β2,3-sheet or the conformational change of the α2-helix, interfering with the kinked conformation of β2,3, led to loss-of-function of P2X4 receptors. All these findings provided new insights in understanding the contribution of the salt bridge between Asp-85 and Arg-309 and its structurally coupled β2,3-sheet to the function of P2X receptors.

Keywords: ATP; P2X receptors; conformational change; ion channel; protein expression; protein stability; salt bridge.


Figures

FIGURE 1.
FIGURE 1.
Salt bridge between Arg-312 and Asp-88 shows high conservation in different subtypes of P2X receptors. A, three-dimensional structure of zfP2X4 in open state. Green broken line shows closest distance between Arg-312 and ATP. B, superposition of residues Arg-312, Asp-88, and Trp-167 at resting and open states. C and D, representative maximum current traces at a saturated concentration ATP (10 mm) (C) and pooled data (D) of zfP2X4 and its mutants. All data are expressed as mean ± S.E. (error bars) from 8 to 10 experiments. **, p < 0.01 versus WT (dashed line), Student's t test. E, multiple -sequence alignment of P2X family. F, zoom-in view of rP2X4 at open state shows details of the salt bridge and its surrounding residues. Red broken lines indicate hydrogen bonding between Arg-309 and Asp-85. Red arrow indicates cation π-electronic interactions between Arg-309 and Trp-164. All figures in this paper were drawn with PyMOL.
FIGURE 2.
FIGURE 2.
Essential role of salt bridge between Arg-309 and Asp-85 in normal rP2X4 functions. A–C, representative maximum current traces and pooled data of rP2X4 and its mutants induced by saturated ATP (1–10 mm). All data are expressed as mean ± S.E. from 6 to 25 experiments. *, p < 0.05; **, p < 0.01 versus WT (dashed line), Student's t test. D, rP2X4 with double mutation R309C/D85C formed homologous oligomers, mainly trimers in non-reducing Western blotting indicated by arrowheads (left). Western blotting results were observed in at least three independent experiments for each receptor. E, representative Western blotting with anti-EE of total and surface-biotinylated proteins from HEK-293 expressing WT and various mutants of rP2X4. The protein expression experiments were conducted independently at least three times.
FIGURE 3.
FIGURE 3.
Salt bridge between Arg-309 and Asp-85 is essential for protein stability and channel gating rather than ATP binding and channel assembly. A and B, correlation map between current density and total (A) or surface (B) protein expression of different mutants. C, representative Western blotting of rP2X4 protein for WT (left) and D85A (right). Cells were treated with 20 μg/ml CHX in a time course experiment as indicated. The results were observed in at least three independent experiments for statistical analysis. D, time-response curves (mean ± S.E., n = 4) showing protein expression levels at different time points following the incubation of 20 μg/ml CHX. E, ATP concentration-response curve of rP2X4 and its mutants. All data are expressed as means ± S.E. from 4 to 12 experiments. Data point was fitted with Hill equation to the ATP-dependent activation. F and G, protein samples extracted from transfected HEK-293 cells separated by non-reducing Western blotting. Monomeric, dimeric, and trimeric receptors are indicated by triangle arrows on the left. Molecular weight markers are shown on the right. Similar results were observed in at least three independent experiments.
FIGURE 4.
FIGURE 4.
Interrupting salt bridge between Arg-309 and Asp-85 causes conformational changes in rP2X4 receptors. A, built simulation system of rP2X4D85A(B)/R309A(C) at the open state viewed parallel (upper) and perpendicular (lower) to the membrane, with different subunit displayed in green, cyan, and magenta cartoons, respectively. The three ATP molecules are highlighted by spheres and marked by numbers. The blue arrow indicates the broken salt bridge. B, time dependence of the root mean square deviation of the Cα from the initial structure of rP2X4D85A(B)/R309A(C) receptor during 150-ns MD simulation. C, comparison of simulated root mean squared fluctuations (RMSF) of each residue in three subunits. D, time dependence of the root mean square deviation of the Cα from initial homology models of WT and mutated channel rP2X4D85A(B)/R309A(C). E, root mean square deviation of WT and mutated channels rP2X4D85A(B)/R309A(C) during MD simulations. F, zoom-in view of the constructed model of rP2X4D85A(B)/R309A(C) based on the open structure, showing the movements of different domains (blue arrows) after MD simulations.
FIGURE 5.
FIGURE 5.
Illustration showing salt bridge Arg-309 and Asp-85 stabilizes the kinked conformation of β2,3 and multiple-domain stacking interactions. A, illustration of alternations in the multiple domains interactions. Dashed line represents the mutated receptors rP2X4D85A(B)/R309A(C), and solid line represents the conformation of WT receptors. Different colors represent different regions of adjacent subunits. Arrows indicate the movement of different domains. B, superposition of the structure of β2,3 of WT (gray) and the representative conformation of R309A/D85A (azure) after MD simulations. Gray and azure dashed lines represent the bending angle formed between β2,3 and α2 of WT and R309A/D85A, respectively. Azure arrow represents the movement of β2,3 in the R309A/D85A mutant when compared with the original conformation of WT.
FIGURE 6.
FIGURE 6.
Changed conformation of β2,3 leads to a decreased protein expression of rP2X4. A and B, zoom-in view of the bending angle of β2,3 relative to the α2-helix. Red and green arrows indicate the direction to alter the orientation of β2,3 from three different directions. Residues selected to generate disulfide bond are highlighted with sticks. Green text shows the Cβ-Cβ distance between the three paired residues. Purple text indicates the domains surrounding β2,3. C, homo-oligomeric proteins, mainly trimeric rat P2X4 receptors formed by introduction of disulfide bond, were separated by Western blotting. Molecular weight markers are shown on the right. The symbols at left represent the monomeric, dimeric, and trimeric rP2X4 receptor, respectively. Similar results were observed in at least three independent experiments. D–G, representative Western blotting of total and surface expressions, their pooled data of rP2X4, and the mutants with cysteine substitution extracted from the transiently transfected HEK-293 cells. Bars represent mean ± S.E. (n = 3) of the total or surface levels normalized to the WT protein; #, p < 0.05 versus control; *, p < 0.05; **, p < 0.01 versus WT (dashed line), Student's t test.
FIGURE 7.
FIGURE 7.
Changed conformations of β2,3 render the instability and gating deficiency of P2X4 receptors. A, representative Western blotting of rP2X4 receptors expressing WT or mutants in HEK-293 incubated with CHX in time course experiments. Similar results were observed in at least three independent experiments. B and C, representative current traces and pooled data for WT and mutant receptors evoked by applications of ATP. Average current density induced by saturated ATP (1 mm). All data are expressed as mean ± S.E. from 6 to 25 experiments. *, p < 0.05; **, p < 0.01 versus WT (dashed line), Student's t test. D, concentration-response curve of rP2X4 and its mutants (n = 4). Data points were fitted with the Hill equation. E, representative current traces recorded from cells expressing F178C/T76C in response to application of 100 μm ATP. Cells were perfused with DTT (10 mm) for 8 min and H2O2 (0.3%) for 5 min. F, pooled data for the effects of DTT on saturated ATP-induced currents of WT and F178C/T76C. y axis represents the ratio of current induced by ATP after DTT application normalized to the current before DTT administration. All data are expressed as mean ± S.E. (error bars) from six cells in three independent experiments. #, p < 0.05 versus control, Student's t test. G, representative current traces recorded from cells expressing WT rP2X4.
FIGURE 8.
FIGURE 8.
Additional strategies to alter the conformation of β2,3 lead to similar changes in rP2X4. A, illustration of our strategies to alter the bending angle formed by β2,3 toward α2. The red arrows represent the directions induced by the alteration in the adjacent area. B, zoom-in view of insertion site in the middle loop between β2 and β3. The gray curve represents the amino acids inserted. Red arrow shows the left motion of β2,3 driven by long amino acid insertion. C and D, typical currents and pooled data from HEK-293 cells expressing rP2X4 and its mutants. All data are expressed as mean ± S.E. from 8 to 25 experiments. *, p < 0.05; **, p < 0.01 versus WT (dashed line), Student's t test. E, Western blotting analysis of protein expressions of rP2X4 and its mutants in HEK-293 cells. Similar results were observed in at least three independent experiments. F, zoom-in view of salt bridge region. The Cβ-Cβ distance of Ala-297 and Ala-87 is indicated by yellow dashed line. G, rP2X4A87C/A297C formed homologous oligomers, mainly trimers as indicated by arrowheads on the left. H and I, Western blotting and pooled data of rP2X4 and the cysteine substitution mutants A87C, A297C, and A87C/A297C. Bars represent mean ± S.E. (n = 3) of the total or surface levels normalized to the WT protein. *, p < 0.05 versus WT (dashed line), Student's t test. **, p < 0.01.
FIGURE 9.
FIGURE 9.
Substitution of salt bridge in different P2X subtypes caused similar deficiency. A and B, saturated ATP-induced representative current traces (A) and pooled data (B) for different P2X subtypes and their mutants. All data are expressed as mean ± S.E. from 4 to 10 experiments. *, p < 0.05; **, p < 0.01 versus WT, Student's t test. C and D, representative Western blotting of total and surface protein expressions and pooled data of P2X receptors and its mutants extracted from transiently transfected HEK-293 cells. Bars represent mean ± S.E. (n = 3–5) of the total or surface levels normalized to the WT protein.

Similar articles

Cited by

References

    1. Surprenant A., and North R. A. (2009) Signaling at purinergic P2X receptors. Annu. Rev. Physiol. 71, 333–359 - PubMed
    1. Khakh B. S., and North R. A. (2006) P2X receptors as cell-surface ATP sensors in health and disease. Nature 442, 527–532 - PubMed
    1. Coddou C., Yan Z., Obsil T., Huidobro-Toro J. P., and Stojilkovic S. S. (2011) Activation and regulation of purinergic P2X receptor channels. Pharmacol. Rev. 63, 641–683 - PMC - PubMed
    1. Lewis C., Neidhart S., Holy C., North R. A., Buell G., and Surprenant A. (1995) Coexpression of P2X2 and P2X3 receptor subunits can account for ATP-gated currents in sensory neurons. Nature 377, 432–435 - PubMed
    1. Nicke A., Bäumert H. G., Rettinger J., Eichele A., Lambrecht G., Mutschler E., and Schmalzing G. (1998) P2X1 and P2X3 receptors form stable trimers: a novel structural motif of ligand-gated ion channels. EMBO J. 17, 3016–3028 - PMC - PubMed

Publication types

LinkOut - more resources