. 2016 Apr 1;291(14):7267-85.
doi: 10.1074/jbc.M115.711408. Epub 2016 Feb 10.

Hexokinase 2 Is an Intracellular Glucose Sensor of Yeast Cells That Maintains the Structure and Activity of Mig1 Protein Repressor Complex

Affiliations

Hexokinase 2 Is an Intracellular Glucose Sensor of Yeast Cells That Maintains the Structure and Activity of Mig1 Protein Repressor Complex

Montserrat Vega et al. J Biol Chem. .

Abstract

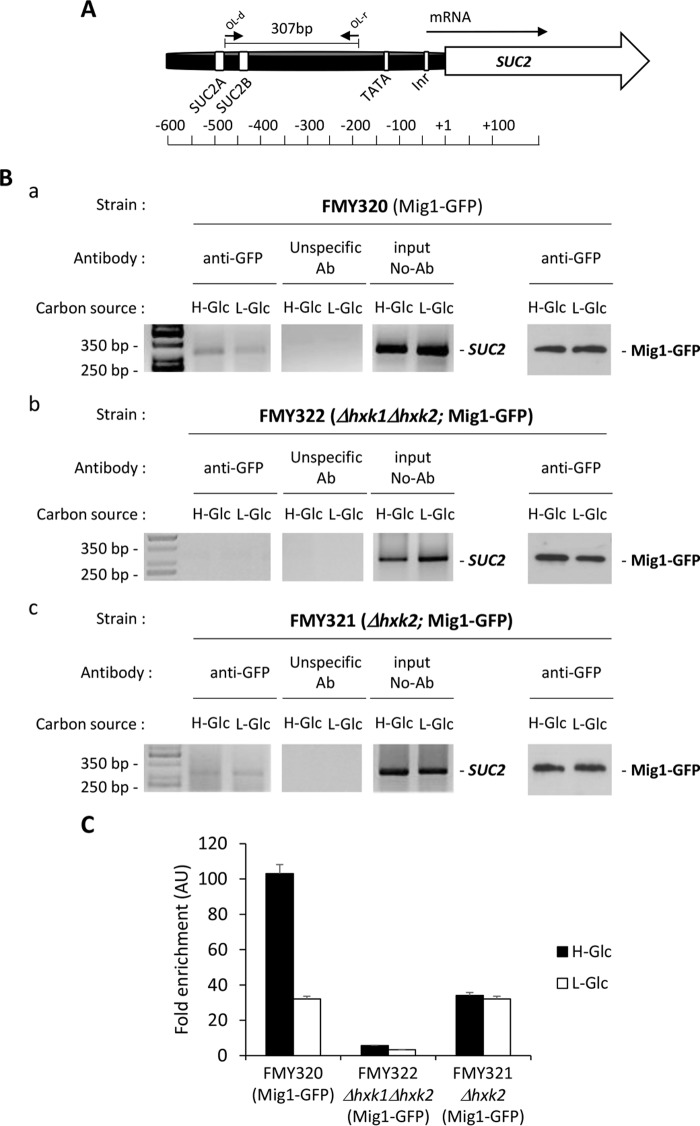
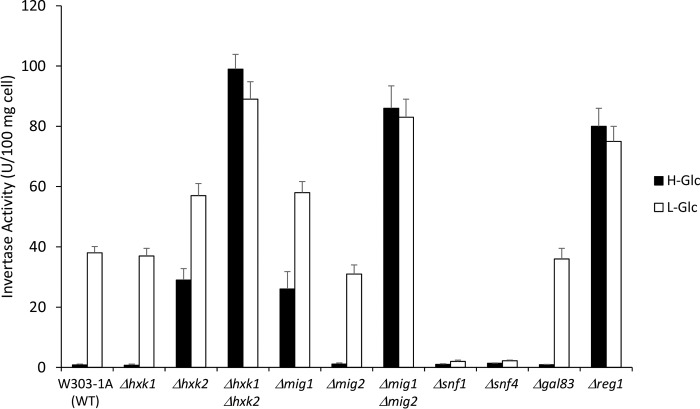
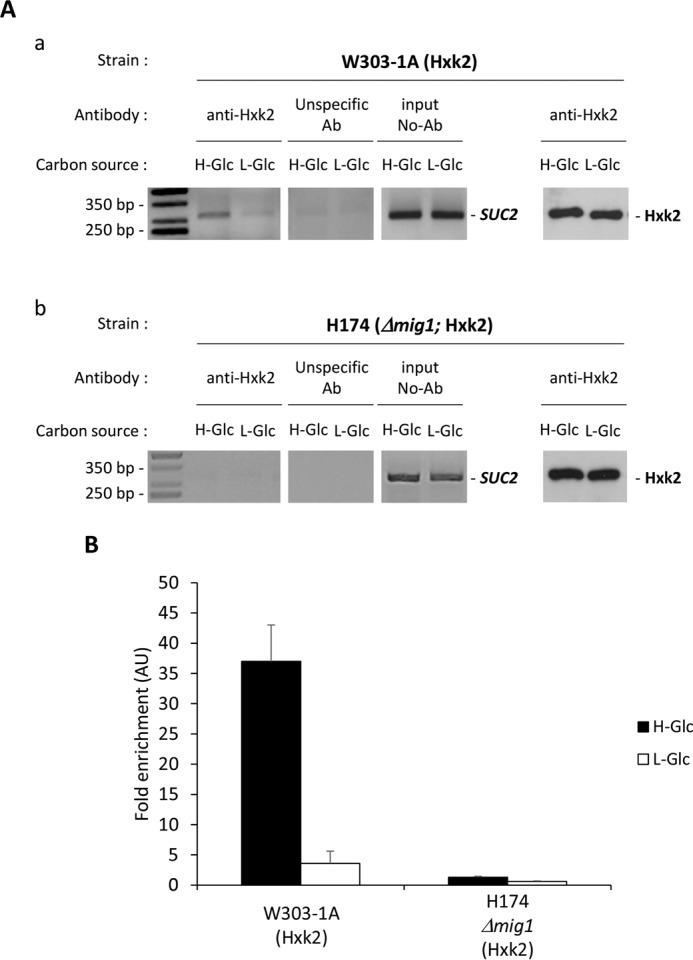
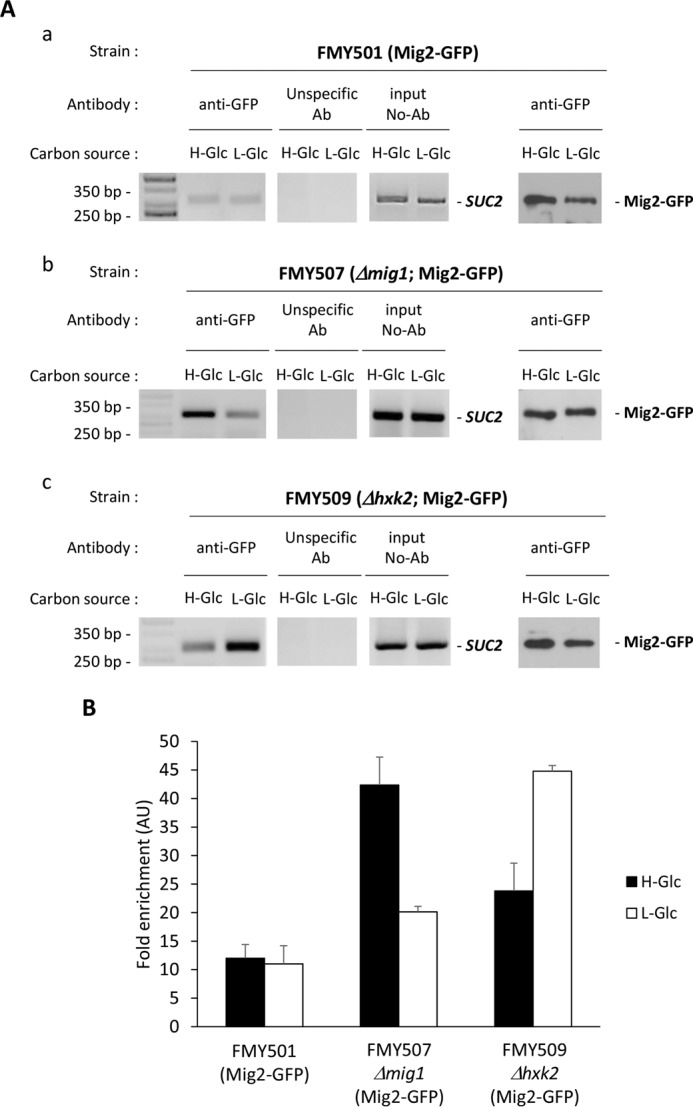
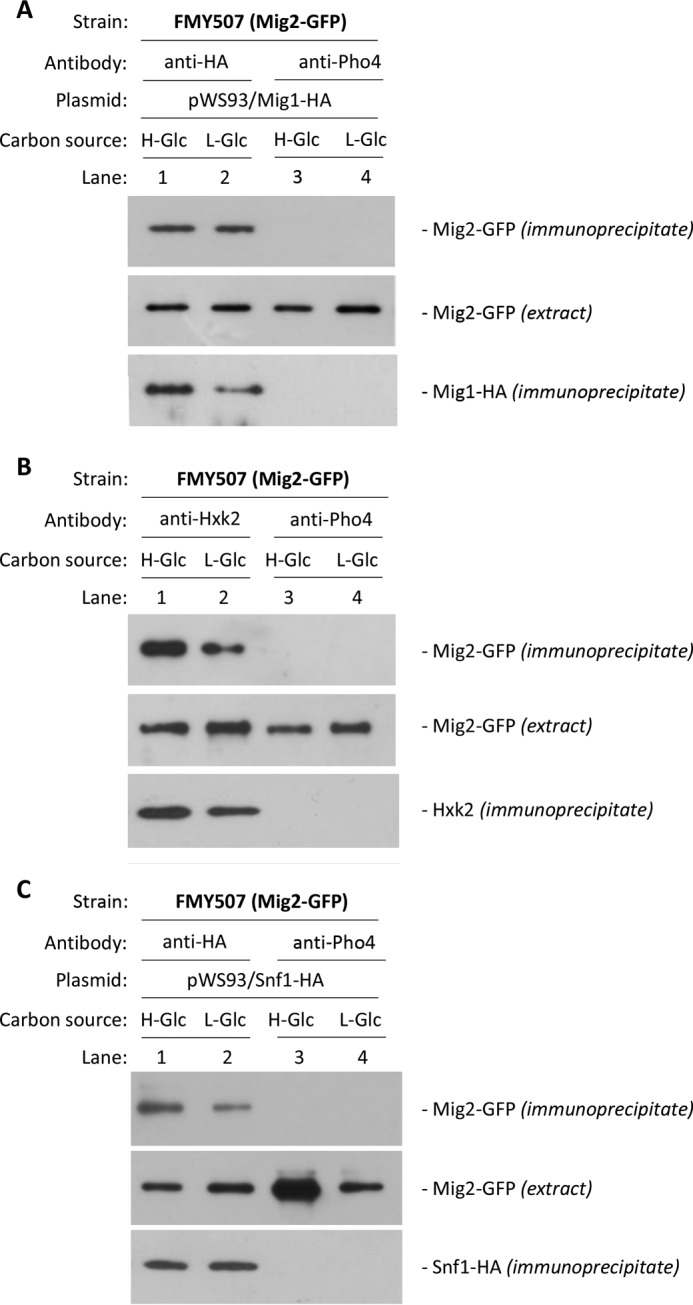
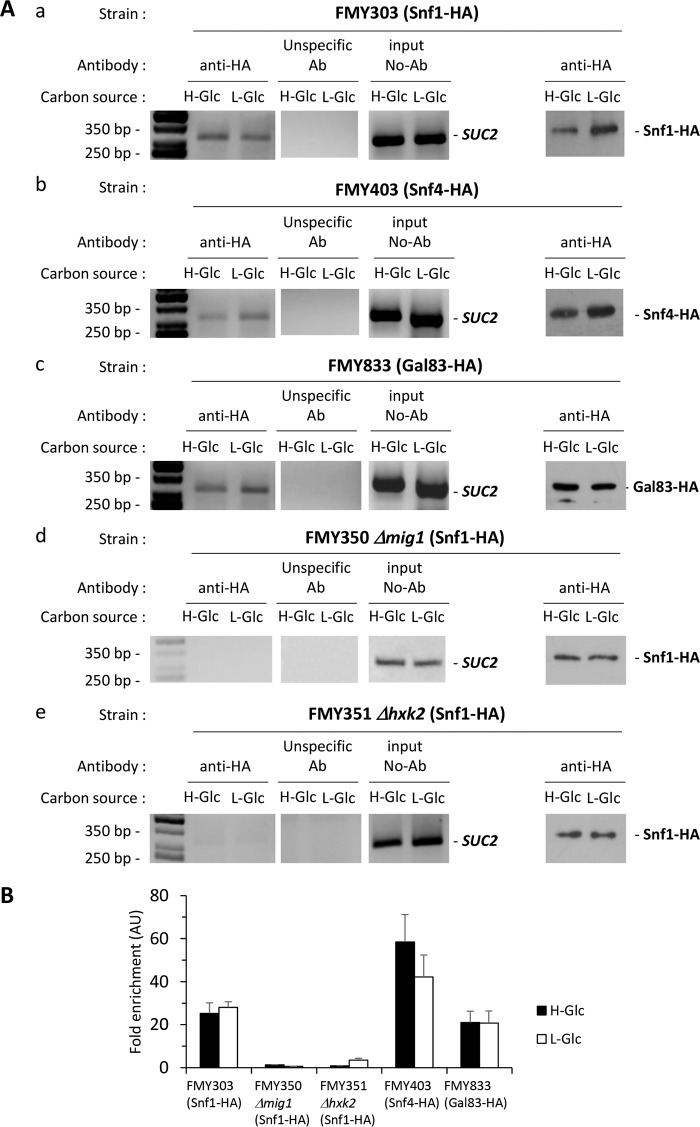
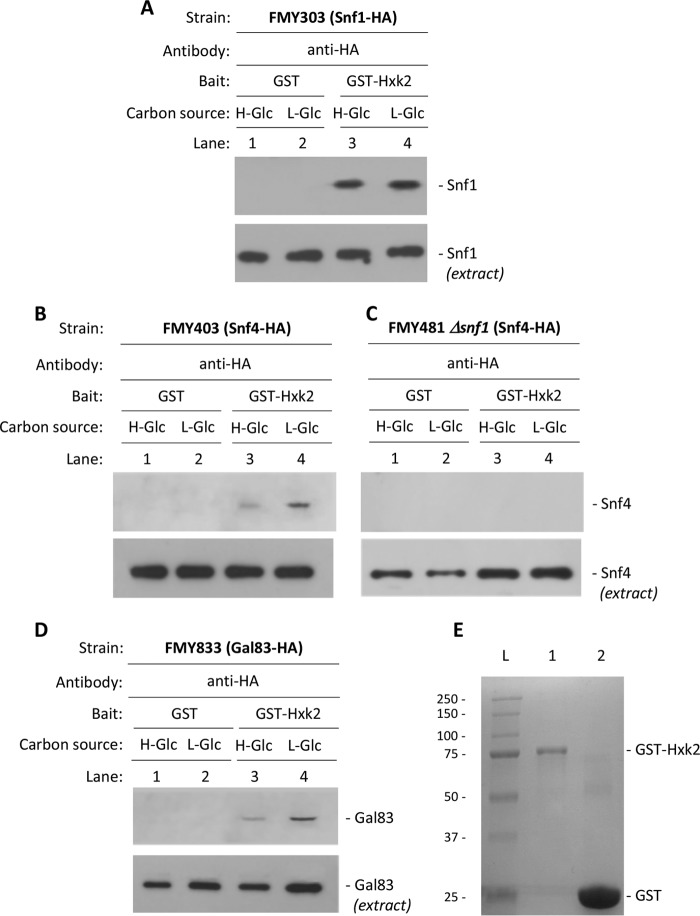
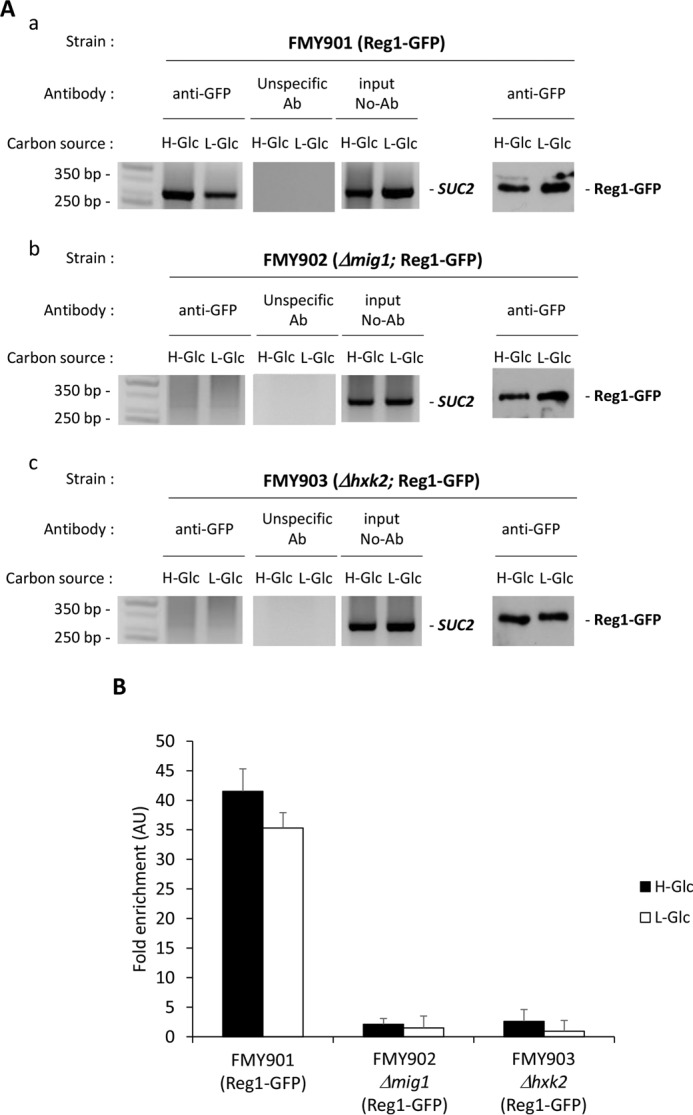
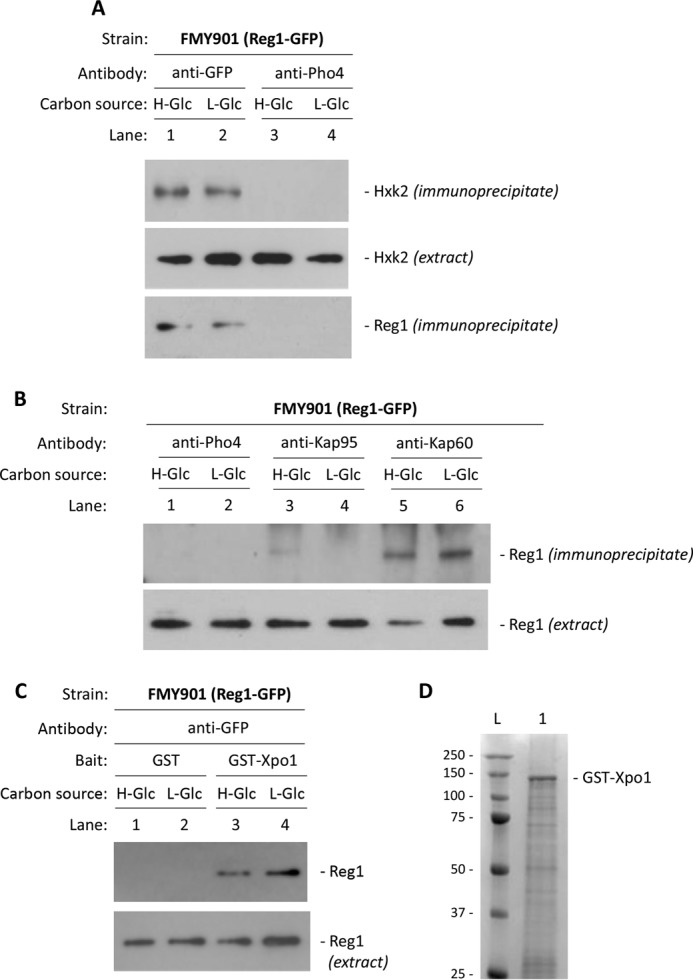
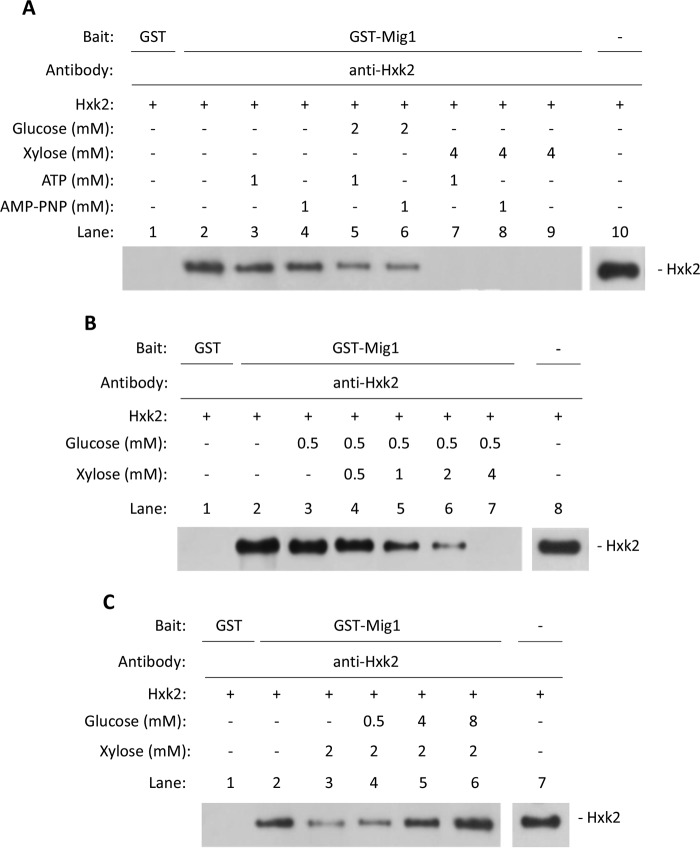
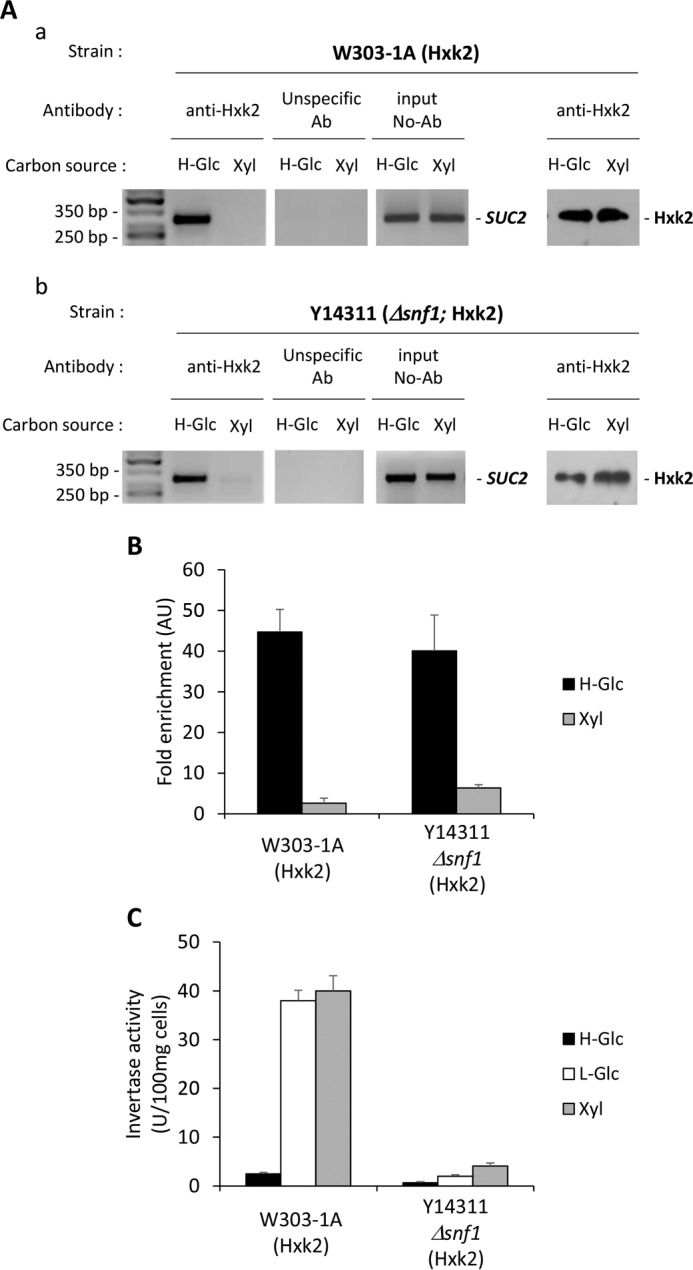
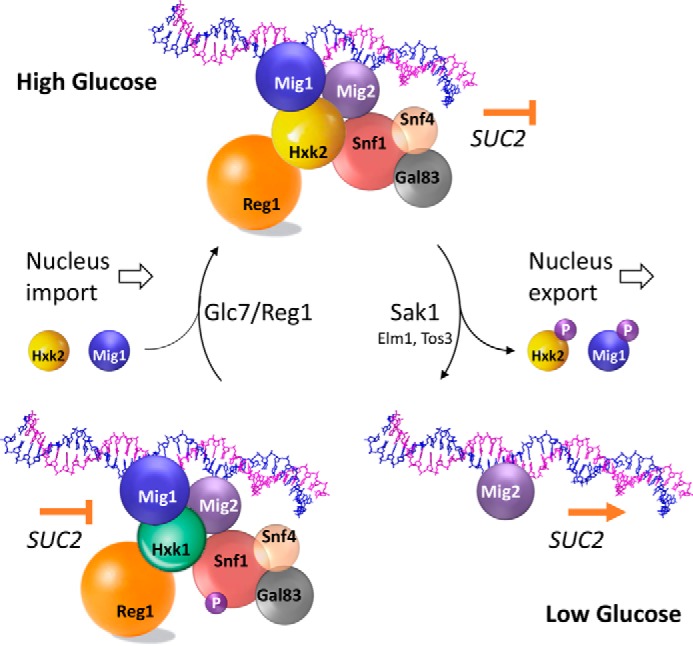
Hexokinase 2 (Hxk2) fromSaccharomyces cerevisiaeis a bi-functional enzyme, being both a catalyst in the cytosol and an important regulator of the glucose repression signal in the nucleus. Despite considerable recent progress, little is known about the regulatory mechanism that controls nuclear Hxk2 association with theSUC2promoter chromatin and how this association is necessary forSUC2gene repression. Our data indicate that in theSUC2promoter context, Hxk2 functions through a variety of structurally unrelated factors, mainly the DNA-binding Mig1 and Mig2 repressors and the regulatory Snf1 and Reg1 factors. Hxk2 sustains the repressor complex architecture maintaining transcriptional repression at theSUC2gene. Using chromatin immunoprecipitation assays, we discovered that the Hxk2 in its open configuration, at low glucose conditions, leaves the repressor complex that induces its dissociation and promotesSUC2gene expression. In high glucose conditions, Hxk2 adopts a close conformation that promotes Hxk2 binding to the Mig1 protein and the reassembly of theSUC2repressor complex. Additional findings highlight the possibility that Hxk2 constitutes an intracellular glucose sensor that operates by changing its conformation in response to cytoplasmic glucose levels that regulate its interaction with Mig1 and thus its recruitment to the repressor complex of theSUC2promoter. Thus, our data indicate that Hxk2 is more intimately involved in gene regulation than previously thought.

Keywords: Saccharomyces cerevisiae; gene expression; glucose; glucose signaling; hexokinase; repressor protein.


Figures

FIGURE 1.
FIGURE 1.
Association of Mig1 repressor with the SUC2 promoter is glucose- and Hxk2-dependent. A, schematic diagram showing the location of primer pair at the SUC2 promoter used for the ChIP analysis. The numbers are presented with respect to the position of the first nucleotide of the initiation codon (+1). B, association of Mig1-GFP with the SUC2 promoter as measured by ChIPs. Strains FMY320 (panel a), FMY322 (Δhxk1Δhxk2) (panel b), and FMY321 (Δhxk2) (panel c) expressing a GFP-tagged Mig1 protein were grown in high glucose conditions (2% glucose, H-Glc) until an A600 of 0.8 was reached. Afterward, half of the culture was exposed to low glucose conditions (0.05% glucose plus 3% ethanol, l-Glc) for 60 min. Mig1 and the SUC2 promoter association was determined by ChIP assays. Results were analyzed by PCR. At least three independent experiments were performed with ACT1 (data not shown, expression was not influenced by glucose-induced nutritional stress), anti-rabbit antibody (Ab) (unspecific antibody), and extracts prior to immunoprecipitation (input, whole-cell extract) as internal controls. Last two lines in B, panels a–c, represent Western blot controls of the Mig1-GFP level. C, quantification of Mig1-GFP association in wild-type (wt), Δhxk1Δhxk2, and Δhxk2 mutant strains with the SUC2 promoter. Cells were treated as described for B, but ChIPs were analyzed by quantitative real time PCR. Data are expressed as signal normalized to the untreated sample. Error bars represent the standard error of the mean for three independent experiments.
FIGURE 2.
FIGURE 2.
Quantitative invertase assays were performed on cells with the indicated mutations. Whole cells from the wild-type strain, W303-1A, and the mutant strains Δhxk1, Δhxk2, Δhxk1Δhxk2, Δmig1, Δmig2, Δmig1Δmig2, Δsnf1, Δsnf4, Δgal83, and Δreg1 were used for invertase activity determination. Invertase was assayed using cells grown in high glucose medium (H-Glc, black bars) until an A600 nm of 0.8 was reached and then transferred to low glucose medium for 60 min (L-Glc, white bars). Error bars represent the standard error of the mean for three independent determinations using three colonies of each strain.
FIGURE 3.
FIGURE 3.
Association of Hxk2 with the SUC2 promoter is glucose- and Mig1-dependent. A, association of Hxk2 with the SUC2 promoter as measured by ChIPs. The wild-type strain W303-1A (panel a) and the mutant strain H174 (Δmig1) (panel b) were grown in high glucose conditions (2% glucose, H-Glc) until an A600 of 0.8 was reached. Afterward, half of the culture was exposed to low glucose conditions (0.05% glucose plus 3% ethanol, L-Glc) for 60 min. Hxk2 and the SUC2 promoter association was determined by ChIP. Results were analyzed by PCR. At least three independent experiments were performed with ACT1 (not shown, expression was not influenced by glucose induced nutritional stress), anti-rabbit antibody (Ab) (unspecific antibody), and extracts prior to immunoprecipitation (input, whole-cell extract) as internal controls. Last two lines in A, panels a–c, represent Western blot controls of the Hxk2 level. The agarose electrophoresis shown is representative of results obtained from three independent experiments. B, quantification of Hxk2 association in wild-type (wt) and Δmig1 mutant strain with the SUC2 promoter. Cells were treated as described for A (H-Glc, black bars; L-Glc, white bars), but ChIPs were analyzed by quantitative real time PCR. Data are expressed as signal normalized to the untreated sample. AU, arbitrary units. Error bars represent the standard error of the mean for three independent experiments.
FIGURE 4.
FIGURE 4.
Association of Mig2-GFP with the SUC2 promoter is Mig1- and Hxk2-dependent. A, association of Mig2-GFP with the SUC2 promoter as measured by ChIPs. The FMY501 strain expressing a GFP-tagged Mig2 protein (panel a) and the mutant strains FMY507 (Δmig1) (panel b) and FMY509 (Δhxk2) (panel b), both expressing a GFP-tagged Mig2 protein, were grown in high glucose conditions (2% glucose, H-Glc) until an A600 of 0.8 was reached. Afterward, half of the culture was exposed to low glucose conditions (0.05% glucose plus 3% ethanol, L-Glc) for 60 min. Mig2 and the SUC2 promoter association were determined by ChIP. Results were analyzed by PCR. At least three independent experiments were performed with ACT1 (not shown, expression was not influenced by glucose-induced nutritional stress), anti-rabbit antibody (Ab) (unspecific antibody), and extracts prior to immunoprecipitation (input, whole-cell extract) as internal controls. Last two lines in A, panels a–c, represent Western blot controls of the Mig2-GFP level. The agarose electrophoresis shown are representative of results obtained from three independent experiments. B, quantification of Mig2 association in FMY501, FMY507 (Δmig1), and FMY509 (Δhxk2) strains with the SUC2 promoter. Cells were treated as described for A (H-Glc, black bars; L-Glc, white bars), but ChIPs were analyzed by quantitative real time PCR. Data are expressed as signal normalized to the untreated sample. Error bars represent the standard error of the mean for three independent experiments. AU, arbitrary units.
FIGURE 5.
FIGURE 5.
Interaction of Mig1, Hxk2, and Snf1 with Mig2. In vivo coimmunoprecipitation of Mig2-GFP with Mig1-HA (A), Hxk2 (B), and Snf1-HA (C) is shown. The FMY507 strain, expressing a Mig2 GFP-tagged fusion protein, was transformed with plasmids pWS93/Mig1 and pWS93/Snf1, which encode an HA-tagged Mig1 and Snf1 protein, respectively. The cells were grown in SG-media, lacking appropriate supplement to maintain selection for plasmid, until an A600 of 0.8 was reached and then shifted to high (H-Glc) and low (L-Glc) glucose conditions for 1 h. The cell extracts were immunoprecipitated with a monoclonal anti-HA, a polyclonal anti-Hxk2 antibodies, or a polyclonal antibody to Pho4 (lanes 3 and 4). Immunoprecipitates were separated by SDS-12% PAGE, and the level of immunoprecipitated Mig2-GFP in the blotted samples was determined by using anti-GFP antibody. The level of Mig2-GFP present in the different extracts was determined by Western blot using anti-GFP antibody. All Western blots shown are representative of results obtained from three independent experiments.
FIGURE 6.
FIGURE 6.
Association of Snf1-HA, Snf4-HA, and Gal83-HA with the SUC2 promoter is Mig1- and Hxk2-dependent. A, association of Snf1, Snf4, and Gal83 with the SUC2 promoter as measured by ChIPs. The FMY303 (panel a), FMY403 (panel b), and FMY833 (panel c) strains expressing HA-tagged Snf1, Snf4, and Gal83 protein, respectively, and the mutant strains FMY350 (Δmig1; Snf1-HA) (panel d) and FMY351 (Δhxk2; Snf1-HA) (panel b), both expressing an HA-tagged Snf1 protein, were grown in high glucose conditions (2% glucose, H-Glc) until an A600 of 0.8 was reached. Afterward, half of the culture was exposed to low glucose conditions (0.05% glucose plus 3% ethanol, L-Glc) for 60 min. Snf1 and the SUC2 promoter association was determined by ChIP in the presence or absence of Mig1 (panel d) and Hxk2 (panel e) proteins. Results were analyzed by PCR. At least three independent experiments were performed with ACT1 (not shown, expression was not influenced by glucose-induced nutritional stress), anti-rabbit antibody (Ab) (unspecific antibody), and extracts prior to immunoprecipitation (input, whole-cell extract) as internal controls. Last two lines in A, panels a–e, represent Western blot controls of Snf1-HA (panels a, d, and e), Snf4-HA (panel b), and Gal83-HA (panel c) level. The agarose electrophoresis shown is representative of results obtained from three independent experiments. B, quantification of Snf1, Snf4, and Gal83 association in the presence of Mig1 and Hxk2 proteins with the SUC2 promoter was analyzed by quantitative real time PCR. Snf1 association in the absence of Mig1 and Hxk2 proteins with the SUC2 promoter was also analyzed by RT-PCR. Cells were treated as described for A (H-Glc, black bars; L-Glc, white bars). Data are expressed as signal normalized to the untreated sample. Error bars represent the standard error of the mean for three independent experiments. AU, arbitrary units.
FIGURE 7.
FIGURE 7.
GST pulldown assays of the interaction of Snf1, Snf4, and Gal83 with Hxk2. A GST-Hxk2 fusion protein was purified on glutathione-Sepharose columns. Equal amounts of GST-Hxk2 were incubated with cell extracts from FMY303, FMY403, FMY481, and FMY833 strains expressing Snf1-HA (A), Snf4-HA (B), Snf4-HA in the absence of Snf1 (C), and Gal83-HA (D) fusion proteins, respectively. E, affinity purification of GST-Hxk2 fusion protein produced in bacteria. Each lane contains 2 μg of purified protein, and the molecular masses (kDa) of the ladder are depicted. Lanes: L, molecular mass ladder; 1, GST-Hxk2 SDS-12% PAGE; 2, GST 12% acrylamide SDS-PAGE. The yeast strains were grown in YEPD media until an A600 nm of 0.8 was reached and then shifted to high (H-Glc) and low (L-Glc) glucose conditions for 1 h. For the control samples, GST protein was also incubated with the high Glc and low Glc cell extracts, but no signals were detected (A–D, lanes 1 and 2). The level of Snf1, Snf4, and Gal83 present in the different extracts used were determined by Western blot using a monoclonal anti-HA antibody. The Western blots shown are representative of results obtained from three independent experiments.
FIGURE 8.
FIGURE 8.
Association of Reg1-GFP with the SUC2 promoter is Mig1- and Hxk2-dependent. A, association of Reg1-GFP with the SUC2 promoter as measured by ChIPs. The FMY901 strain expressing a GFP-tagged Reg1 protein (panel a) and the mutant strains FMY902 (Δmig1) (panel b) and FMY903 (Δhxk2) (panel b), both also expressing a GFP-tagged Reg1 protein, were grown in high glucose conditions (2% glucose, H-Glc) until an A600 of 0.8 was reached. Afterward, half of the culture was exposed to low glucose conditions (0.05% glucose plus 3% ethanol, L-Glc) for 60 min. Reg1 and the SUC2 promoter association was determined by ChIP. Results were analyzed by PCR. At least three independent experiments were performed with ACT1 (not shown, expression was not influenced by glucose-induced nutritional stress), anti-rabbit antibody (Ab) (unspecific antibody), and extracts prior to immunoprecipitation (input, whole-cell extract) as internal controls. Last two lines in A, panels a–c, represent Western blot controls of the Reg1-GFP level. The agarose electrophoresis shown are representative of results obtained from three independent experiments. B, quantification of Reg1 association in FMY901, FMY902 (Δmig1), and FMY903 (Δhxk2) strains with the SUC2 promoter. Cells were treated as described for A (H-Glc, black bars; L-Glc, white bars), but ChIPs were analyzed by quantitative real time PCR. Data are expressed as signal normalized to the untreated sample. Error bars represent the standard error of the mean for three independent experiments. AU, arbitrary units.
FIGURE 9.
FIGURE 9.
In vivo interaction of Reg1 with Hxk2, Kap60, Kap95, and Xpo1. The FMY901 strain, expressing a Reg1-GFP fusion protein, was grown in high glucose YEPD-medium (H-Glc) until an A600 of 0.8 was reached and then transferred to low glucose medium (L-Glc) for 60 min. A, cell extracts were immunoprecipitated with a polyclonal anti-GFP antibody (lanes 1 and 2) or a polyclonal antibody to Pho4 (lanes 3 and 4). B, cell extracts were immunoprecipitated with polyclonal anti-Kap95 and anti-Kap60 antibodies (lanes 3–6) or a polyclonal antibody to Pho4 (lanes 1 and 2). Immunoprecipitates were separated by SDS-12% PAGE, and coprecipitated Hxk2 or Reg1-GFP was visualized on a Western blot with polyclonal anti-Hxk2 or anti-GFP antibodies. The level of Hxk2 or Reg1 present in the different extracts was determined by Western blot using anti-Hxk2 or anti-GFP antibodies. C, GST-Xpo1 fusion protein was purified on glutathione-Sepharose columns. Equal amounts of GST-Xpo1 were incubated with cell extracts from FMY901 strain. D, affinity purification of GST-Xpo1 fusion protein produced in bacteria. The lane contains 4 μg of purified protein, and the molecular masses (kDa) of the ladder are depicted. Lanes: L, molecular mass ladder; 1, GST-Xpo1 10% acrylamide SDS-PAGE. The yeast strain was grown in YEPD media until an A600 of 0.8 was reached and then shifted to high (H-Glc) and low (L-Glc) glucose conditions for 1 h. For the control samples, GST protein was also incubated with the high Glc and low Glc cell extracts but no signals were detected (C, lanes 1 and 2). The level of Reg1 present in the different extracts used were determined by Western blot using an anti-GFP antibody. The Western blots shown are representative of results obtained from three independent experiments.
FIGURE 10.
FIGURE 10.
Association of Hxk2 with the SUC2 promoter is not regulated by phosphorylation. A, association of Hxk2 with the SUC2 promoter as measured by ChIPs. The wild-type strain W303-1A (panel a) and the mutant strain Y14311 (Δsnf1) (panel b) were grown in high glucose conditions (2% glucose, H-Glc) until an A600 of 0.8 was reached; afterward, half of the culture was exposed to low glucose conditions (0.05% glucose plus 3% ethanol, L-Glc) for 60 min. Hxk2 and the SUC2 promoter association was determined by ChIP. Results were analyzed by PCR. At least three independent experiments were performed with ACT1 (not shown, expression was not influenced by glucose induced nutritional stress), anti-rabbit antibody (Ab) (unspecific antibody), and extracts prior to immunoprecipitation (input, whole-cell extract) as internal controls. Last two lines in A, panels a and b, represent Western blot controls of the Hxk2 level. The agarose electrophoresis shown is representative of results obtained from three independent experiments. B, quantification of Hxk2 association in wild-type (wt) and Δsnf1 mutant strain with the SUC2 promoter. Cells were treated as described for A (H-Glc, black bars; L-Glc, white bars), but ChIPs were analyzed by quantitative real time PCR. Data are expressed as signal normalized to the untreated sample. Error bars represent the standard error of the mean for three independent experiments. AU, arbitrary units.
FIGURE 11.
FIGURE 11.
In vitro conformational changes in Hxk2 affect its interaction with the Mig1 repressor. A, identical amounts of Hxk2 affinity-purified protein from bacteria were incubated in the presence of 2 mm glucose, 4 mm d-xylose, 1 mm MgATP2−, and 1 mm MgAMP-PNP for 30 min at 20 °C in PBS buffer. Total Hxk2 utilized in the experiment is shown (lane 10). B, time course of d-xylose inhibition of Hxk2-Mig1 interaction. Identical amounts of Hxk2 affinity-purified protein from bacteria were incubated in the presence of 0.5 mm glucose and increasing amounts of d-xylose, from 0.5 to 4 mm (lanes 4–7) for 30 min at 20 °C in PBS buffer. Total Hxk2 utilized in the experiment is shown (lane 8). C, time course of glucose activation of Hxk2-Mig1 interaction. Total Hxk2 utilized in the experiment is shown (lane 7). Identical amounts of Hxk2 affinity-purified protein from bacteria were incubated in the presence of 2 mm d-xylose and increasing amounts of glucose, from 0.5 to 8 mm (lanes 4–6) for 30 min at 20 °C in PBS buffer. Then, the GST-Mig1 fusion protein coupled to glutathione-Sepharose was incubated with the assay mixtures for 90 min at 4 °C in PBS buffer. Beads were gently washed five times with 2.5 ml of PBS buffer, boiled in 25 μl of sample-loading buffer, and analyzed by SDS-PAGE followed by Western blot using anti-Hxk2 antibodies. The Western blot shown is representative of results obtained from three independent experiments. In vitro kinase assay.
FIGURE 12.
FIGURE 12.
In vivo conformational changes of Hxk2 regulate its interaction with the Mig1 repressor. A, association of Hxk2 with the SUC2 promoter as measured by ChIPs. The wild-type strain W303-1A (panel a) and the mutant strain Y14311 (Δsnf1) (panel b) were grown in high glucose conditions (2% glucose, H-Glc) until an A600 of 0.8 was reached. Afterward, half of the culture was exposed to low glucose conditions (0.05% glucose plus 3% ethanol, L-Glc) for 60 min. Hxk2 and the SUC2 promoter association was determined by ChIP. Results were analyzed by PCR. At least three independent experiments were performed with ACT1 (not shown, expression was not influenced by glucose-induced nutritional stress), anti-rabbit antibody (Ab) (unspecific antibody), and extracts prior to immunoprecipitation (input, whole-cell extract) as internal controls. Last two lines in A, panel a and b, represent Western blot controls of the Hxk2 level. The agarose electrophoresis shown are representative of results obtained from three independent experiments. B, quantification of Hxk2 association in wild-type (wt) and Δsnf1 mutant strain with the SUC2 promoter. Cells were treated as described for A (H-Glc, black bars; L-Glc, white bars), but ChIPs were analyzed by quantitative real time PCR. Data are expressed as signal normalized to the untreated sample. Error bars represent the standard error of the mean for three independent experiments. AU, arbitrary units.
FIGURE 13.
FIGURE 13.
Model explaining how the SUC2 repressor complex dynamically disassembles and reassembles in a glucose-dependent manner.

Comment in

Similar articles

Cited by

References

    1. Struhl K. (1995) Yeast transcriptional regulatory mechanisms. Annu. Rev. Genet. 29, 651–674 - PubMed
    1. Malavé T. M., and Dent S. Y. (2006) Transcriptional repression by Tup1-Ssn6. Biochem. Cell. Biol. 84, 437–443 - PubMed
    1. Redd M. J., Arnaud M. B., and Johnson A. D. (1997) A complex composed of tup1 and ssn6 represses transcription in vitro. J. Biol. Chem. 272, 11193–11197 - PubMed
    1. Varanasi U. S., Klis M., Mikesell P. B., and Trumbly R. J. (1996) The Cyc8 (Ssn6)-Tup1 corepressor complex is composed of one Cyc8 and four Tup1 subunits. Mol. Cell. Biol. 16, 6707–6714 - PMC - PubMed
    1. Flores-Saaib R. D., and Courey A. J. (2000) Analysis of Groucho-histone interactions suggests mechanistic similarities between Groucho- and Tup1-mediated repression. Nucleic Acids Res. 28, 4189–4196 - PMC - PubMed

Publication types

MeSH terms