

Local reaction kinetics by imaging
- PMID: 26865736
- PMCID: PMC4705865
- DOI: 10.1016/j.susc.2015.05.021
Local reaction kinetics by imaging
Abstract
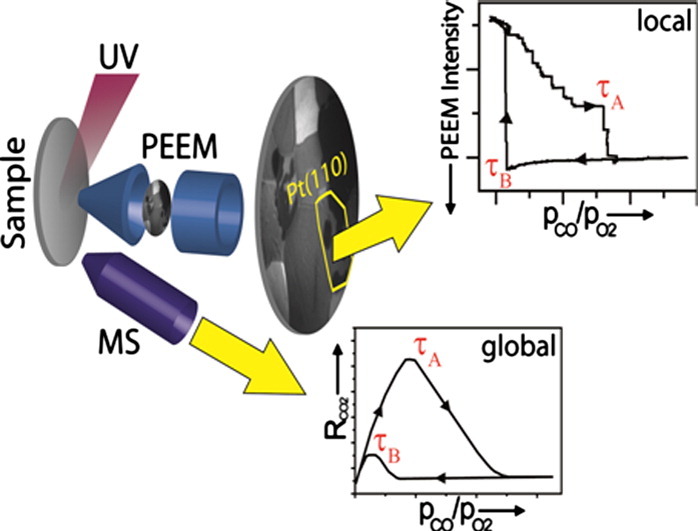
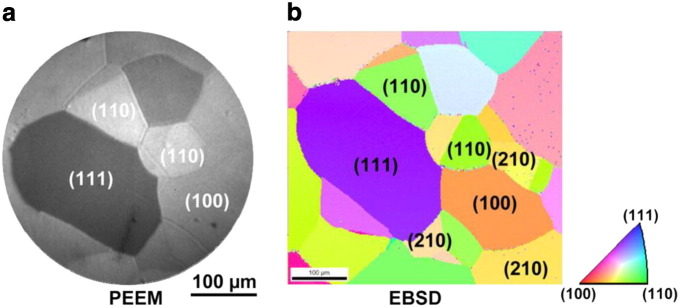
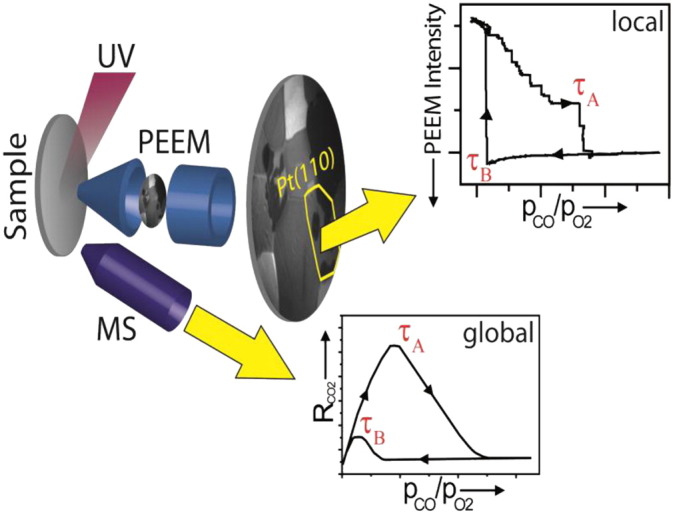
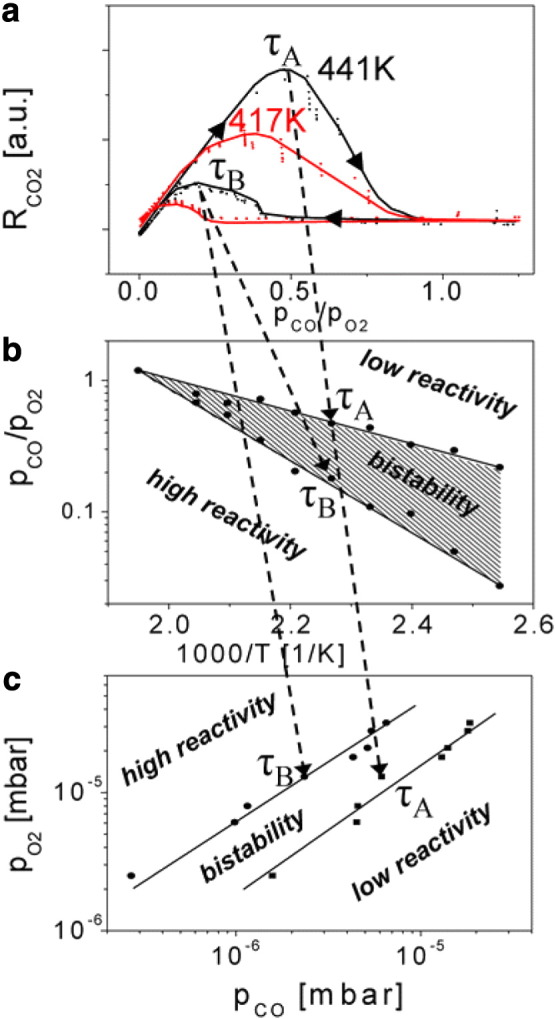
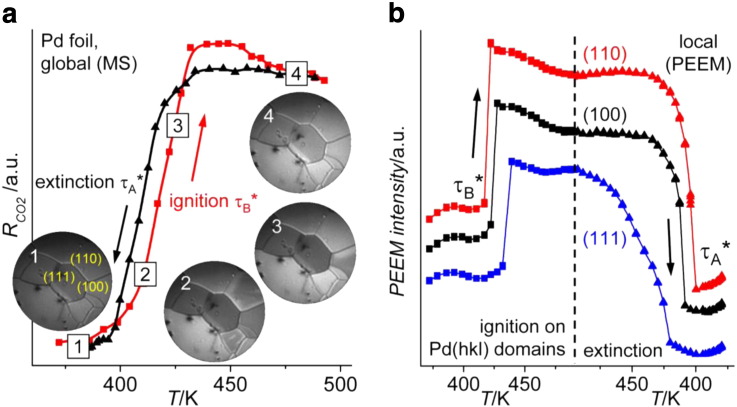
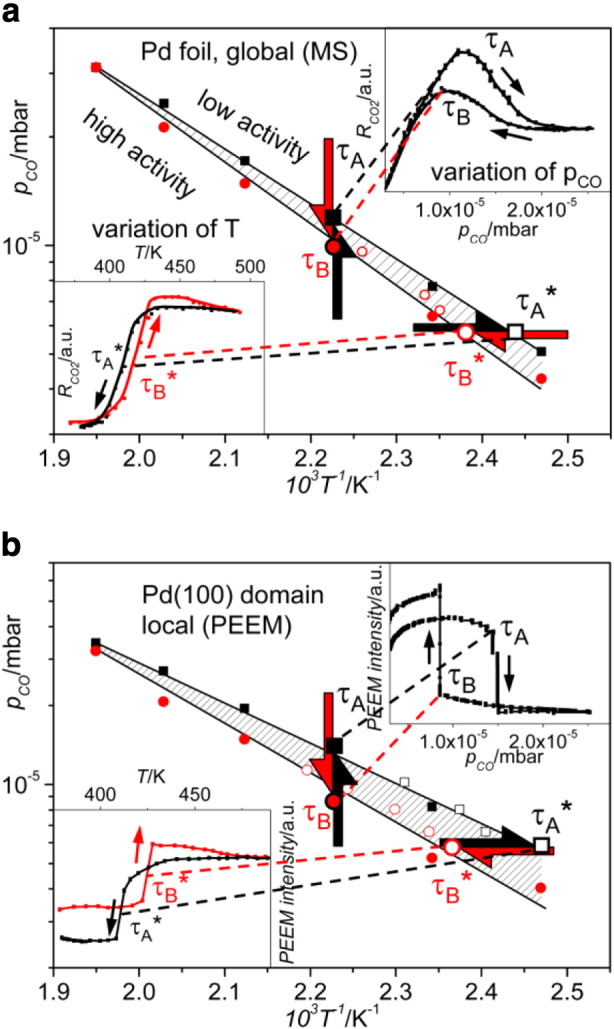
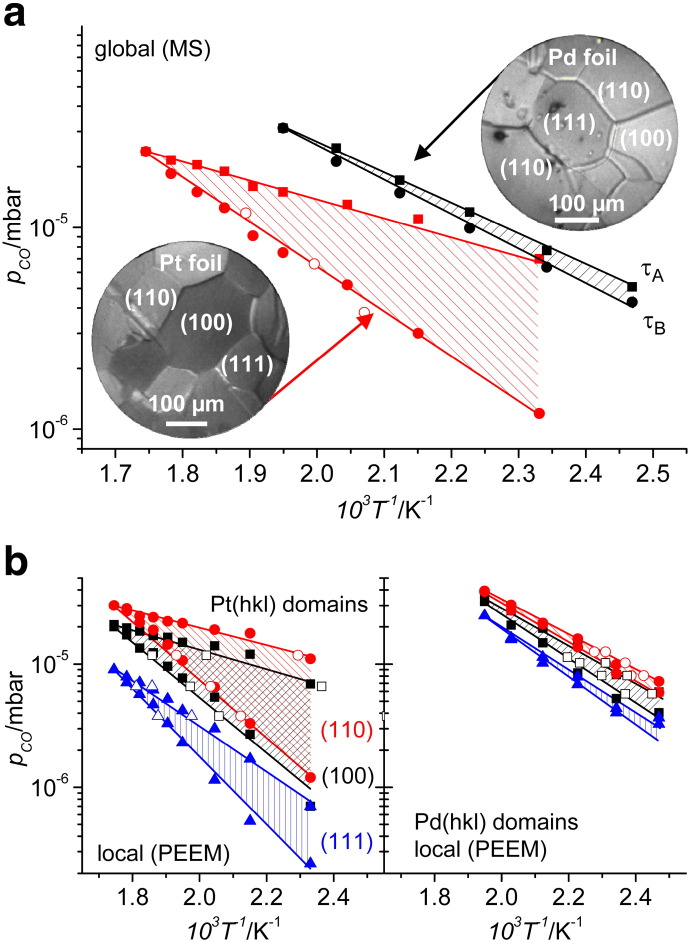
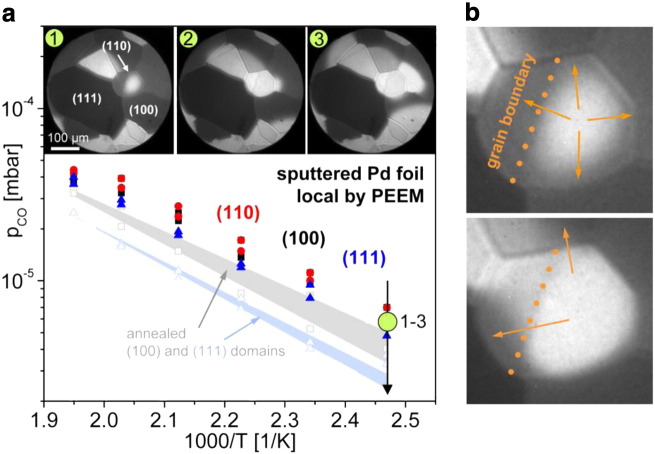
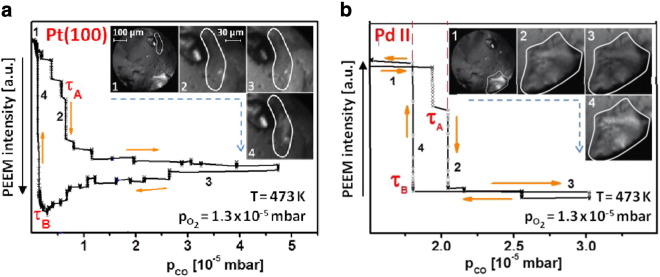
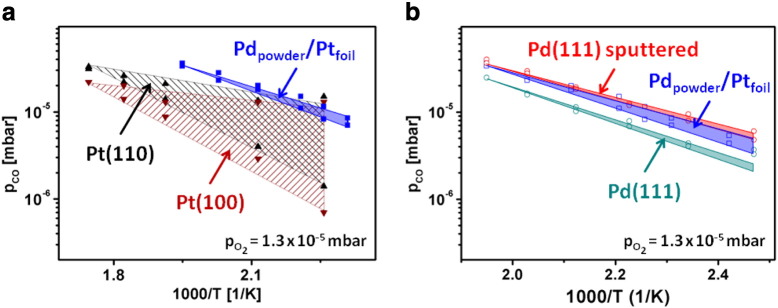
In the present contribution we present an overview of our recent studies using the "kinetics by imaging" approach for CO oxidation on heterogeneous model systems. The method is based on the correlation of the PEEM image intensity with catalytic activity: scaled down to the μm-sized surface regions, such correlation allows simultaneous local kinetic measurements on differently oriented individual domains of a polycrystalline metal-foil, including the construction of local kinetic phase diagrams. This allows spatially- and component-resolved kinetic studies and, e.g., a direct comparison of inherent catalytic properties of Pt(hkl)- and Pd(hkl)-domains or supported μm-sized Pd-powder agglomerates, studies of the local catalytic ignition and the role of defects and grain boundaries in the local reaction kinetics.
Keywords: CO oxidation; Catalysis; Catalytic ignition; Palladium; Photoemission electron microscopy; Platinum.
Figures
Similar articles
-
The Role of Defects in the Local Reaction Kinetics of CO Oxidation on Low-Index Pd Surfaces.J Phys Chem C Nanomater Interfaces. 2013 Jun 13;117(23):12054-12060. doi: 10.1021/jp312510d. Epub 2013 May 17. J Phys Chem C Nanomater Interfaces. 2013. PMID: 23785524 Free PMC article.
-
Spatially coupled catalytic ignition of CO oxidation on Pt: mesoscopic versus nano-scale.Ultramicroscopy. 2015 Dec;159 Pt 2:178-83. doi: 10.1016/j.ultramic.2015.05.012. Epub 2015 May 14. Ultramicroscopy. 2015. PMID: 26021411 Free PMC article.
-
Mapping the local reaction kinetics by PEEM: CO oxidation on individual (100)-type grains of Pt foil.Surf Sci. 2011 Dec;605(23-24):1999-2005. doi: 10.1016/j.susc.2011.07.018. Surf Sci. 2011. PMID: 22140277 Free PMC article.
-
Shape-controlled synthesis of Pd nanocrystals and their catalytic applications.Acc Chem Res. 2013 Aug 20;46(8):1783-94. doi: 10.1021/ar300209w. Epub 2012 Nov 19. Acc Chem Res. 2013. PMID: 23163781 Review.
-
Determination of chemical kinetic properties of heterogeneous catalysts.J Chromatogr A. 2004 May 28;1037(1-2):125-45. doi: 10.1016/j.chroma.2003.11.051. J Chromatogr A. 2004. PMID: 15214664 Review.
Cited by
-
Surface-Structure Libraries: Multifrequential Oscillations in Catalytic Hydrogen Oxidation on Rhodium.J Phys Chem C Nanomater Interfaces. 2019 Feb 21;123(7):4217-4227. doi: 10.1021/acs.jpcc.8b11421. Epub 2019 Jan 23. J Phys Chem C Nanomater Interfaces. 2019. PMID: 31057690 Free PMC article.
-
A Polycrystalline Pd Surface Studied by Two-Dimensional Surface Optical Reflectance during CO Oxidation: Bridging the Materials Gap.ACS Appl Mater Interfaces. 2024 Jan 10;16(1):444-453. doi: 10.1021/acsami.3c11341. Epub 2023 Dec 18. ACS Appl Mater Interfaces. 2024. PMID: 38109219 Free PMC article.
-
Imaging Interface and Particle Size Effects by In Situ Correlative Microscopy of a Catalytic Reaction.ACS Catal. 2023 May 23;13(11):7650-7660. doi: 10.1021/acscatal.3c00060. eCollection 2023 Jun 2. ACS Catal. 2023. PMID: 37288091 Free PMC article.
-
Single-Particle Catalysis: Revealing Intraparticle Pacemakers in Catalytic H2 Oxidation on Rh.ACS Catal. 2021 Aug 6;11(15):10020-10027. doi: 10.1021/acscatal.1c02384. Epub 2021 Jul 27. ACS Catal. 2021. PMID: 34386273 Free PMC article.
-
Visualizing catalyst heterogeneity by a multifrequential oscillating reaction.Nat Commun. 2018 Feb 9;9(1):600. doi: 10.1038/s41467-018-03007-3. Nat Commun. 2018. PMID: 29426883 Free PMC article.
References
-
- Kraemer K., Menzel D. Phys. Chem. 1974;78:591.
-
- Suchorski Y., Drachsel W. Field ion microscopy (FIM) and atom probe (AP) In: Friedbacher G., Bubert H., editors. Surface and thin film analysis. Wiley-VCH; Weinheim: 2011.
-
- Ertl G. Science. 1991;254:1750. - PubMed
-
- Ertl G G. Angew. Chem. Int. Ed. 2008;47 (3524 and references therein) - PubMed
-
- Imbihl R., Ertl G. Chem. Rev. 1995;95:697.
LinkOut - more resources
Full Text Sources
Other Literature Sources