

New insights into rotating frame relaxation at high field
- PMID: 26866422
- PMCID: PMC6935321
- DOI: 10.1002/nbm.3490
New insights into rotating frame relaxation at high field
Abstract
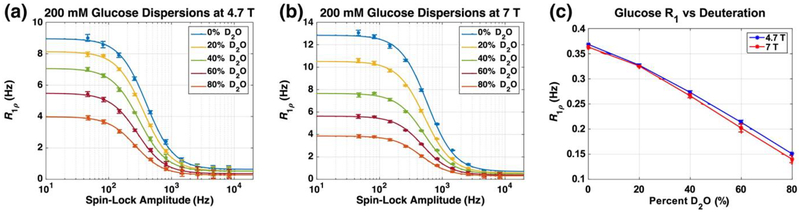
Measurements of spin-lock relaxation rates in the rotating frame (R1ρ ) at high magnetic fields afford the ability to probe not only relatively slow molecular motions, but also other dynamic processes, such as chemical exchange and diffusion. In particular, measurements of the variation (or dispersion) of R1ρ with locking field allow the derivation of quantitative parameters that describe these processes. Measurements in deuterated solutions demonstrate the manner and degree to which exchange dominates relaxation at high fields (4.7 T, 7 T) in simple solutions, whereas temperature and pH are shown to be very influential factors affecting the rates of proton exchange. Simulations and experiments show that multiple exchanging pools of protons in realistic tissues can be assumed to behave independently of each other. R1ρ measurements can be combined to derive an exchange rate contrast (ERC) that produces images whose intensities emphasize protons with specific exchange rates rather than chemical shifts. In addition, water diffusion in the presence of intrinsic susceptibility gradients may produce significant effects on R1ρ dispersions at high fields. The exchange and diffusion effects act independently of each other, as confirmed by simulation and experimentally in studies of red blood cells at different levels of oxygenation. Collectively, R1ρ measurements provide an ability to quantify exchange processes, to provide images that depict protons with specific exchange rates and to describe the microstructure of tissues containing magnetic inhomogeneities. As such, they complement traditional T1 or T2 measurements and provide additional insights from measurements of R1ρ at a single locking field. Copyright © 2016 John Wiley & Sons, Ltd.
Keywords: T1ρ; T1ρ dispersion; chemical exchange; diffusion; spin-locking; susceptibility.
Copyright © 2016 John Wiley & Sons, Ltd.
Figures


Similar articles
-
Tissue characterization using R1rho dispersion imaging at low locking fields.Magn Reson Imaging. 2021 Dec;84:1-11. doi: 10.1016/j.mri.2021.05.006. Epub 2021 May 28. Magn Reson Imaging. 2021. PMID: 34052306 Review.
-
Exchange-mediated contrast in CEST and spin-lock imaging.Magn Reson Imaging. 2014 Jan;32(1):28-40. doi: 10.1016/j.mri.2013.08.002. Epub 2013 Nov 13. Magn Reson Imaging. 2014. PMID: 24239335 Free PMC article.
-
Contributions of chemical and diffusive exchange to T1ρ dispersion.Magn Reson Med. 2013 May;69(5):1357-66. doi: 10.1002/mrm.24379. Epub 2012 Jul 12. Magn Reson Med. 2013. PMID: 22791589 Free PMC article.
-
Dispersion of relaxation rates in the rotating frame under the action of spin-locking pulses and diffusion in inhomogeneous magnetic fields.Magn Reson Med. 2014 May;71(5):1906-11. doi: 10.1002/mrm.24837. Epub 2013 Jun 26. Magn Reson Med. 2014. PMID: 23804212 Free PMC article.
-
Quantitative rotating frame relaxometry methods in MRI.NMR Biomed. 2016 Jun;29(6):841-61. doi: 10.1002/nbm.3518. Epub 2016 Apr 21. NMR Biomed. 2016. PMID: 27100142 Review.
Cited by
-
An order parameter without magic angle effect (OPTIMA) derived from dispersion in ordered tissue.Magn Reson Med. 2020 May;83(5):1783-1795. doi: 10.1002/mrm.28045. Epub 2019 Nov 5. Magn Reson Med. 2020. PMID: 31691348 Free PMC article.
-
Spin-lock imaging of intrinsic susceptibility gradients in tumors.Magn Reson Med. 2020 May;83(5):1587-1595. doi: 10.1002/mrm.28155. Epub 2019 Dec 27. Magn Reson Med. 2020. PMID: 31883149 Free PMC article.
-
Spin-lock imaging of exogenous exchange-based contrast agents to assess tissue pH.Magn Reson Med. 2018 Jan;79(1):298-305. doi: 10.1002/mrm.26681. Epub 2017 Mar 20. Magn Reson Med. 2018. PMID: 28321903 Free PMC article.
-
Proton Exchange Magnetic Resonance Imaging: Current and Future Applications in Psychiatric Research.Front Psychiatry. 2020 Sep 24;11:532606. doi: 10.3389/fpsyt.2020.532606. eCollection 2020. Front Psychiatry. 2020. PMID: 33192650 Free PMC article. Review.
-
Spin-lock imaging of early tissue pH changes in ischemic rat brain.NMR Biomed. 2018 Apr;31(4):e3893. doi: 10.1002/nbm.3893. Epub 2018 Feb 9. NMR Biomed. 2018. PMID: 29424463 Free PMC article.
References
-
- Duvvuri U, Poptani H, Feldman M, Nadal-Desbarats L, Gee M, Lee W, Reddy R, Leigh J, Glickson J. Quantitative T1ρ magnetic resonance imaging of RIF-1 tumors in vivo: detection of early response to cyclophosphamide therapy. Cancer Res. 2001; 61: 7747–7753. - PubMed
Publication types
MeSH terms
Substances
Grants and funding
LinkOut - more resources
Full Text Sources
Other Literature Sources
Medical
Research Materials
