. 2016 Feb 11;12(2):e1004412.
doi: 10.1371/journal.pcbi.1004412. eCollection 2016 Feb.

Inferring Growth Control Mechanisms in Growing Multi-cellular Spheroids of NSCLC Cells from Spatial-Temporal Image Data

Affiliations

Inferring Growth Control Mechanisms in Growing Multi-cellular Spheroids of NSCLC Cells from Spatial-Temporal Image Data

Nick Jagiella et al. PLoS Comput Biol. .

Abstract

We develop a quantitative single cell-based mathematical model for multi-cellular tumor spheroids (MCTS) of SK-MES-1 cells, a non-small cell lung cancer (NSCLC) cell line, growing under various nutrient conditions: we confront the simulations performed with this model with data on the growth kinetics and spatial labeling patterns for cell proliferation, extracellular matrix (ECM), cell distribution and cell death. We start with a simple model capturing part of the experimental observations. We then show, by performing a sensitivity analysis at each development stage of the model that its complexity needs to be stepwise increased to account for further experimental growth conditions. We thus ultimately arrive at a model that mimics the MCTS growth under multiple conditions to a great extent. Interestingly, the final model, is a minimal model capable of explaining all data simultaneously in the sense, that the number of mechanisms it contains is sufficient to explain the data and missing out any of its mechanisms did not permit fit between all data and the model within physiological parameter ranges. Nevertheless, compared to earlier models it is quite complex i.e., it includes a wide range of mechanisms discussed in biological literature. In this model, the cells lacking oxygen switch from aerobe to anaerobe glycolysis and produce lactate. Too high concentrations of lactate or too low concentrations of ATP promote cell death. Only if the extracellular matrix density overcomes a certain threshold, cells are able to enter the cell cycle. Dying cells produce a diffusive growth inhibitor. Missing out the spatial information would not permit to infer the mechanisms at work. Our findings suggest that this iterative data integration together with intermediate model sensitivity analysis at each model development stage, provide a promising strategy to infer predictive yet minimal (in the above sense) quantitative models of tumor growth, as prospectively of other tissue organization processes. Importantly, calibrating the model with two nutriment-rich growth conditions, the outcome for two nutriment-poor growth conditions could be predicted. As the final model is however quite complex, incorporating many mechanisms, space, time, and stochastic processes, parameter identification is a challenge. This calls for more efficient strategies of imaging and image analysis, as well as of parameter identification in stochastic agent-based simulations.


Conflict of interest statement

The authors have declared that no competing interests exist.

Figures

Fig 1
Fig 1. Radial organization of spheroids.
Combination of images of a cross-section of a tumor simulated with the model presented in this article depicting the spatial organization of cellular phenotypes (proliferating, dying) and the molecular agents considered by the proposed model as main resources (oxygen, glucose), growth/viability promotors (GP/VP) or growth/viability inhibitors (GI/VI). The arrows point into the direction from high to low concentrations. The image shall be compared with the corresponding scheme in ref. [8], which shows a combination of images of spheroid median sections studied with different technologies: autoradiography, TUNEL assay, bioluminescence imaging, and probing with oxygen micro-electrodes.
Fig 2
Fig 2. Growth curves of MCTS cultivated under different nutrient conditions.
The arrows and boxes indicate the time points where histological images were taken.
Fig 3
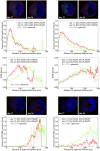
Fig 3. Quantification of proliferating (top) and dying (bottom) cell nuclei as well as of extra-cellular matrix density (center).
The images (top) depict cross-sections taken at different time points (T3 = 17d, T4 = 24d) of spheroids grown under different nutrient conditions ([G], [O2]). The colors indicate cell nuclei (blue), extra-cellular matrix (EMC) (green) and proliferation (red, left) or cell death (red, right). The curves (bottom) represent the radial profiles of the fraction of proliferating and dying cells, and the ECM density (intensity of ColIagen IV staining), inferred from averages over images from several spheroids growing under the same conditions. Bars indicate the standard deviation. With ECM density we denote the fluorescence value of Collagen IV, which varied in the interval [0, 1].
Fig 4
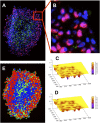
Fig 4. Image smoothing and segmentation.
(A) The micrograph shows a cryosection of a spheroid stained with HOECHST (red), Ki67 (blue) and Collagen IV (green). The original image was smoothed with a median filter. For a zoomed-in section of the image (B), the original (C) and smoothed version (D) of the image are visualized as landscapes of the inverted blue color channel intensities, 1 − Iblue. (E) The cell nuclei were segmented from the blue color channel and differentiated between Ki67 positive (red) and negative (blue) nuclei by means of the red channel. The spheroid lumen (green) is approximated by inflated nuclei.
Fig 5
Fig 5. Scheme of cell states and the biological processes a cell can undergo: cell cycle (including cell growth and division), migration, cell death (apoptosis and necrosis) and lysis.
Left panel: A cycling cell grows by occupying two neighboring lattice sites after a fraction of transitions in the cell cycle. Growing cells can push a certain number of cells aside. Cells can migrate by hopping from one lattice site to its neighbor lattice site. A cell dies with rate kneck and is consequently lysed with rate klys. (The schemes in the left panel are 2D for clarity; the simulations however were all in 3D). Right: All processes are modeled as Poisson processes. A cell in the cell cycle undergoes md transitions until splitting into two daughter cells. Composed of md sub-processes the cell cycle time ends up following an Erlang distribution. Increasing md will lead to sharper cell cycle distributions. A cell transitions from one cell cycle state (CCS) to the next with rate kdiv,m. If a cell is in state mg it will grow. If it is in state md it will divide into 2 daughter cells during the next transition. Furthermore, the 2 daughter cells will either enter the first CCS proportional to probability pdiv or become quiescent (G0) proportional to probability 1 − pdiv. A cell in quiescence can reenter the cell cycle with rate kre and probability pre. Table 2 indicates how all transition rates and probabilities are calculated for models 1–4.
Fig 6
Fig 6. Experimental and model-predicted fraction of Ki67 positive cells (left) and Collagen IV (ECM) density (right) for [G] = 25mM, [O] = 0.28mM at day 17 (red) and day 24 (green) vs. distance from the spheroid surface.
A deterministic cell cycle progression depending on the distance of a cell from the surface, generates sharp transitions that are experimentally not observed (left, dotted line), while a probabilistic transition generates a smooth monotonically decreasing function of Ki67 positive cells in the simulations (left, dashed). If in addition cells can progress in the cell cycle only if the local concentration of ECM overcomes a threshold value [ECM]min, the experimentally found Ki67 profile is recovered (left, full line). Right full line: ECM concentration in the computer simulation.
Fig 7
Fig 7. Growth kinetics (upper panel) and spatial profiles of TUNEL, Ki67, Collagen IV for [G] = 5mM, [O] = 0.28mM (condition II, upper right picture and middle panel) and [G] = 25mM, [O] = 0.28mM (condition III, upper left picture and low panel.).
The dotted curves show simulations where cell cycle progression requires the product of local glucose and oxygen concentration to exceed a critical threshold, while below this threshold cells become quiescent and die. If the product is replaced by the local concentration of ATP, the agreement improves significantly (solid lines). For dashed curves the diffusion coefficient in medium was assumed to be Dmed = 30Dtum. The experimental growth curves are shown as boxplots (box: mean, lower & upper quartiles, horizontal dashes: minimum & maximum), and the radial profiles as composition of mean (bold line) and standard deviation (thin line).
Fig 8
Fig 8. Nutrient-dependent metabolism.
Production rates of ATP (top left) and lactate (top right). The threshold value of the minimal ATP requirement is depicted by the black line. Percentage of anaerobically metabolized glucose (bottom left) and glycolytic ATP (bottom right).
Fig 9
Fig 9. Adding lactate-induced cell death.
If above a certain concentration of lactate produced during glucogenesis, cell death occurs, population kinetics and spatial temporal profiles for conditions III ([G] = 25mM, [O] = 0.28mM), and II ([G] = 5mM, [O] = 0.28mM), as well as the growth phases of condition I ([G] = 1mM, [O] = 0.28mM) and condition IV ([G] = 25mM, [O] = 0.07mM) were correctly captured. The diffusion coefficient in the medium was assumed to be Dmed = 30 Dtum. The experimental growth curves are shown as boxplots (box: mean, lower & upper quartils, horizontal dashes: minimum & maximum), and the radial profiles as composition of mean (line) and standard deviation (error bars).
Fig 10
Fig 10. Waste & under-oxygenation mediating quiescence.
If a cell was exposed to waste (cellular debris from cellular lyses of dead cells) or deprived from oxygen for a certain number of cell cycles, nexpmax, it will become quiescent after its next division. The population kinetics of all conditions I-IV during all growth phases including the saturation as well as the spatial temporal profiles for conditions III ([G] = 25mM, [O] = 0.28mM), and II ([G] = 5mM, [O] = 0.28mM) were correctly captured. The graphs show a comparison between experimental observation and model simulation. The experimental growth curves are either shown as boxplots (box: mean, lower & upper quartiles, horizontal dashes: minimum & maximum), or as composition of mean (line) and standard deviation (error bar) for the radial profiles. The simulation curves are shown as black lines.
Fig 11
Fig 11. Spheroids show a radial organization of cell phenotypes: proliferating (green), quiescent (blue) and dying cells (black).
The thickness of those layers is controlled by different factors as growth promoters (GP), growth inhibitors (GI), viability promoters (VP) and inhibitors (VI). The different control molecular components can largely be mapped on the control molecules emerging in our final model.
Fig 12
Fig 12. Cell density and cell size estimation.
Left: The Delaunay triangulation of all segmented nuclei serves to estimate the cell sizes via its dual, the Voronoi diagram. Right: Average cell diameter as a function of distance to the spheroid border. The black curve is the average profile of six images (condition III, T3) with bin size 1μm and the red curve is the gliding average with window size 10μm.
Fig 13
Fig 13. Automatic versus manual detection of Ki67 positive nuclei.
Fig 14
Fig 14. Sensitivity analysis for threshold parameters IKi67 and φKi67.
The plots show the sensitivity, specificity and classification error comparing the manual detection with the automated detection for a combination of {IKi67, φKi67}.
Fig 15
Fig 15. Oxygen (right) and Glucose (left) consumption.
The graphs show a comparison between experimental measurements of glucose and oxygen consumption rates of EMT6/Ro cells [80] (dots) and predictions of Eqs 21 and 22 (grid). The rates are functions of the local extra-cellular glucose and oxygen concentrations. (The original values were rescaled from mol/cell/s to mM/h(= mol/m3/h) for an average cell volume of 2700μm: 1mol/cell/s = 13.3 × 10¹⁷ mM/h.)

Similar articles

Cited by

References

    1. Drasdo D, Hohme S. A single-cell-based model of tumor growth in vitro: monolayers and spheroids [Journal Article]. Phys Biol. 2005;2(3):133–47. 10.1088/1478-3975/2/3/001 - DOI - PubMed
    1. Schaller G, Meyer-Hermann M. Multicellular tumor spheroid in an off-lattice Voronoi-Delaunay cell model. Physical Review E. 2005;71(5):051910 10.1103/PhysRevE.71.051910 - DOI - PubMed
    1. Pampaloni F, Reynaud EG, Stelzer EH. The third dimension bridges the gap between cell culture and live tissue [Journal Article]. Nat Rev Mol Cell Biol. 2007;8(10):839–45. 10.1038/nrm2236 - DOI - PubMed
    1. Breslin S, O’Driscoll L. Three-dimensional cell culture: the missing link in drug discovery [Journal Article]. Drug Discov Today. 2013;18(5–6):240–9. 10.1016/j.drudis.2012.10.003 - DOI - PubMed
    1. Tung YC, Hsiao AY, Allen SG, Torisawa YS, Ho M, Takayama S. High-throughput 3D spheroid culture and drug testing using a 384 hanging drop array [Journal Article]. Analyst. 2011;136(3):473–8. Available from: http://pubs.rsc.org/en/Content/ArticleLanding/2011/AN/ c0an00609b. 10.1039/C0AN00609B - DOI - PMC - PubMed

Publication types