. 2016 Apr;157(4):1660-72.
doi: 10.1210/en.2015-1848. Epub 2016 Feb 11.

Desensitization and Incomplete Recovery of Hepatic Target Genes After Chronic Thyroid Hormone Treatment and Withdrawal in Male Adult Mice

Affiliations

Desensitization and Incomplete Recovery of Hepatic Target Genes After Chronic Thyroid Hormone Treatment and Withdrawal in Male Adult Mice

Kenji Ohba et al. Endocrinology. 2016 Apr.

Abstract

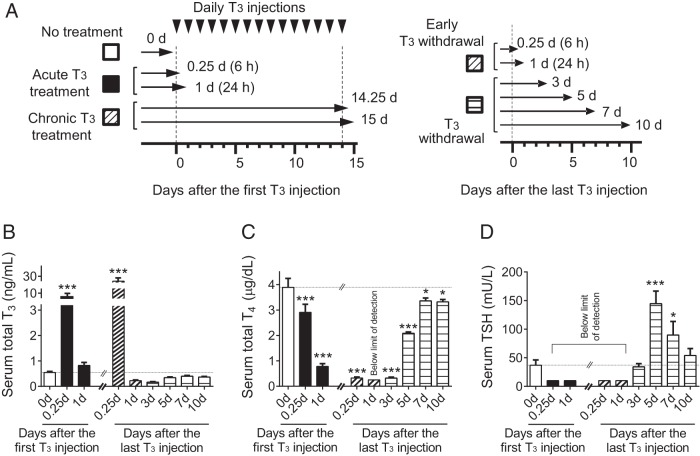
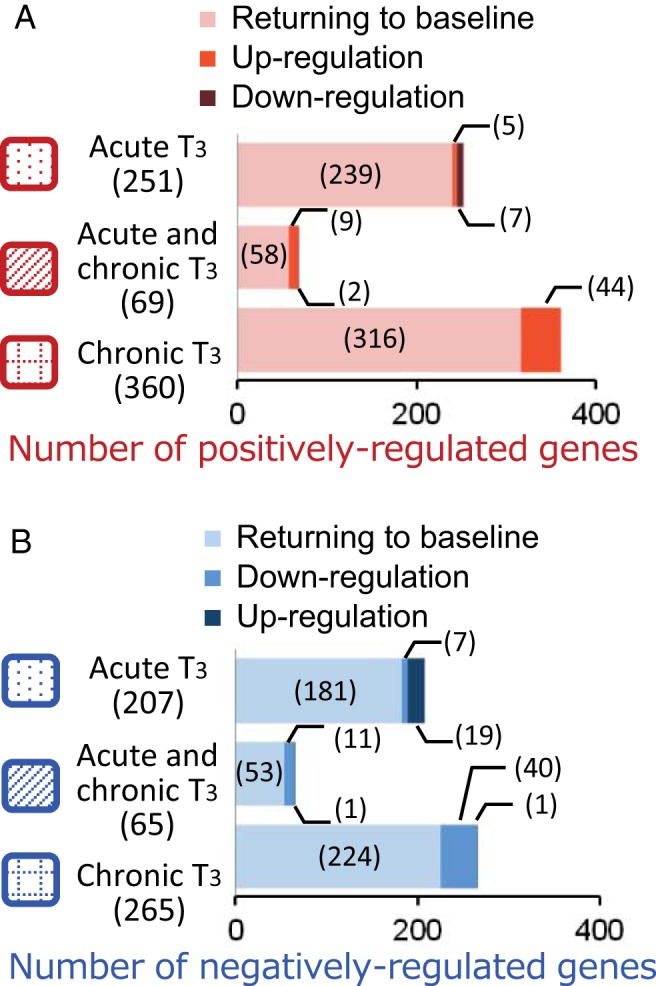
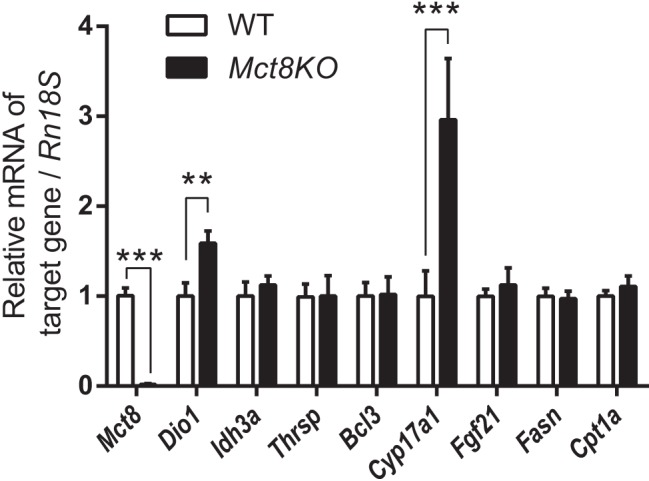
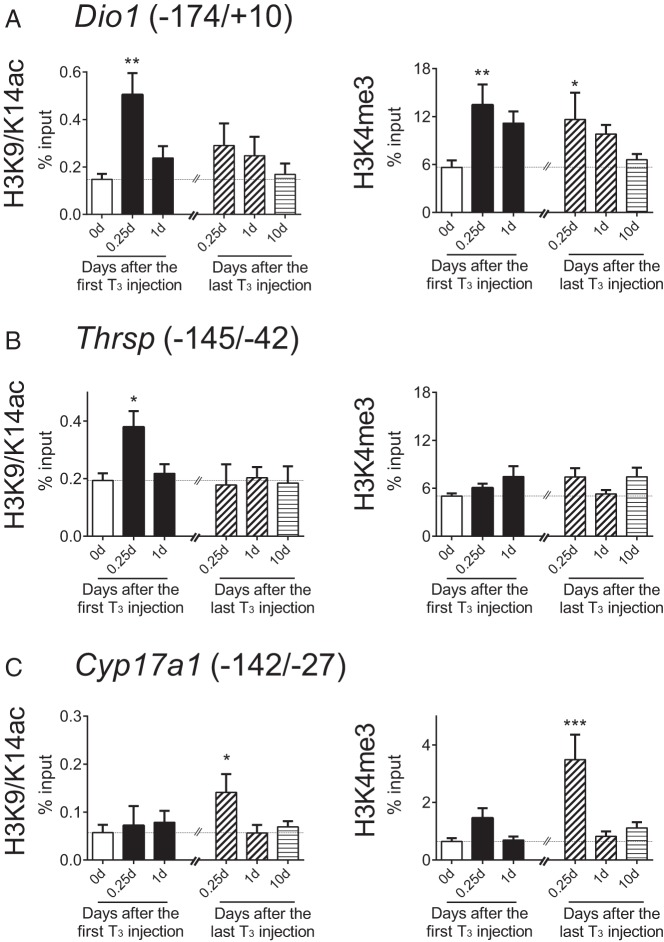
Clinical symptoms may vary and not necessarily reflect serum thyroid hormone (TH) levels during acute and chronic hyperthyroidism as well as recovery from hyperthyroidism. We thus examined changes in hepatic gene expression and serum TH/TSH levels in adult male mice treated either with a single T3 (20 μg per 100 g body weight) injection (acute T3) or daily injections for 14 days (chronic T3) followed by 10 days of withdrawal. Gene expression arrays from livers harvested at these time points showed that among positively-regulated target genes, 320 were stimulated acutely and 429 chronically by T3. Surprisingly, only 69 of 680 genes (10.1%) were induced during both periods, suggesting desensitization of the majority of acutely stimulated target genes. About 90% of positively regulated target genes returned to baseline expression levels after 10 days of withdrawal; however, 67 of 680 (9.9%) did not return to baseline despite normalization of serum TH/TSH levels. Similar findings also were observed for negatively regulated target genes. Chromatin immunoprecipitation analysis of representative positively regulated target genes suggested that acetylation of H3K9/K14 was associated with acute stimulation, whereas trimethylation of H3K4 was associated with chronic stimulation. In an in vivo model of chronic intrahepatic hyperthyroidism since birth, adult male monocarboxylate transporter-8 knockout mice also demonstrated desensitization of most acutely stimulated target genes that were examined. In summary, we have identified transcriptional desensitization and incomplete recovery of gene expression during chronic hyperthyroidism and recovery. Our findings may be a potential reason for discordance between clinical symptoms and serum TH levels observed in these conditions.


Figures

Figure 1.
Figure 1.
Design of animal experiments to study thyroid hormone treatment and withdrawal and corresponding thyroid function test measurements during the study. A, Schematic of animal experiments. Adult male mice (8–10 wk old) were treated with 20 μg liothyronine (L-T3) per 100 g body weight for 1 day or 14 days followed by cessation of L-T3 for 10 days. Mice were killed at each of the indicated time points. Arrowheads represent L-T3 injections and arrows represent the time points of the animals were killed and tissue collection. B–D, Measurements of serum thyroid hormone and TSH levels during the study described above. Serum total T3 (B), total T4 (C), and TSH (D) concentrations were determined at indicated T3-treatment periods after the first and the last L-T3 injection. No treatment (blank); acute T3 treatment (black); chronic T3 treatment (hashed); early T3 withdrawal (hashed); T3 withdrawal (striped) are shown. Note that the same data points were used for the chronic T3 treatment and early T3 withdrawal groups (hashed). The limits of detection were 0.25 μg/dL for serum total T4 and 10 mU/L for TSH. Data are presented as means ± SEM (n = 4–5/group). *, P < .05, **, P < .01, ***, P < .001, compared with nontreated mice (0 d) by one-way ANOVA.
Figure 2.
Figure 2.
Distinct hepatic target gene expression patterns after acute and chronic T3. Adult male mice (8–10 wk old) were treated with 20 μg liothyronine (L-T3) per 100 g body weight for 14 days. Livers were harvested from mice 6 hours after the first L-T3 injection (acute T3) as well as after the last L-T3 injection (chronic T3). A and B, Venn diagrams showing differentially expressed genes at indicated T3-treatment periods in positively (A) and negatively (B) regulated genes from microarray data as described in Materials and Methods. C, Representative heat map displaying the top 50 up-regulated genes after acute T3 and/or chronic T3, compared with nontreated mice. Genes underlined show genes induced in common with both exposure protocols. Genes in bold show genes analyzed by RT-qPCR. Row-normalized gene expression levels are represented according to the colored bar scale at the bottom of the figure (n = 3/group).
Figure 3.
Figure 3.
Distinct hepatic target gene expression patterns after T3 withdrawal. Adult male mice (8–10 wk old) were treated with 20 μg liothyronine (L-T3) per 100 g body weight for 14 days. Livers were harvested from mice 6 hours after the first L-T3 injection (acute T3), 6 hours after the last L-T3 injection given on day 14 (chronic T3), and 10 days after the last L-T3 injection (T3 withdrawal). A and B, Bar graph depicting the number of differentially expressed genes during T3 withdrawal and recovery. There were three categories of genes during recovery: returning to baseline, persistent up-regulation, or persistent down-regulation after T3 withdrawal in the indicated response groups for positively (A) and negatively (B) regulated genes described in Figure 2. Numbers in parentheses represent the number of differentially expressed genes.
Figure 4.
Figure 4.
Differential temporal expression patterns of individual positively regulated hepatic target genes after T3 treatment and its withdrawal. Adult male mice (8–10 wk old) were treated with 20 μg liothyronine (L-T3) per 100 g body weight for 14 days. Relative mRNA expression was determined at indicated T3-treatment periods after the first and the last L-T3 injection. Shown are the temporal expression patters of genes that were both acutely and chronically induced, Dio1 and Idh3a (A,); genes that were only acutely induced, Thrsp and Bcl3 (B); and genes that were only chronically induced (C), Cyp17a1 and Fgf21. D, Genes that were paradoxically up-regulated during T3 withdrawal: Fasn and Cpt1a. No treatment (blank); acute T3 treatment (black); chronic T3 treatment (hashed); early T3 withdrawal (hashed); and T3 withdrawal (striped) are shown. Note that the same data points were used for the chronic T3 treatment and early T3 withdrawal groups (hashed). Data are presented as means ± SEM (n = 4–5/group). *, P < .05, **, P < .01, ***, P < .001, compared with nontreated mice (0 d) by one-way ANOVA.
Figure 5.
Figure 5.
Differential hepatic gene expression due to chronically increased hepatocellular T3 concentration in MCT8 deficiency. Relative mRNA expression of Mct8 and representative positively regulated T3-target genes in WT and Mct8-knockout (Mct8KO) mice (10–12 wk old). Data are presented as means ± SEM (n = 12/group). **, P < .01, ***, P < .001, by two-tailed Student's t test.
Figure 6.
Figure 6.
Distinct temporal patterns of histone modifications induced by T3 on Dio1, Thrsp, and Cyp17a1 gene promoters. Adult male mice (8–10 wk old) were treated with 20 μg liothyronine (L-T3) per 100 g body weight for 14 days. A–C, Histone modifications in the promoters of these three target genes induced by T3. ChIP-qPCR analyses were performed with anti-H3K9/K14ac or anti-H3K4me3 at indicated T3-treatment periods after the first and the last L-T3 injections. No treatment (blank); acute T3 treatment (black); chronic T3 treatment (hashed); early T3 withdrawal (hashed); and T3 withdrawal (striped) are shown. Note that the same data points were used for the chronic T3 treatment and early T3 withdrawal groups (hashed). Parentheses represent primer location referring to the transcription start site of reference sequencing. Data are presented as means ± SEM (n = 4–5/group). *, P < .05, **, P < .01, ***, P < .001, compared with nontreated mice (0 d) by one-way ANOVA.

Comment in

References

    1. Fahrenfort JJ, Wilterdink AM, van der Veen EA. Long-term residual complaints and psychosocial sequelae after remission of hyperthyroidism. Psychoneuroendocrinology. 2000;25:201–211. - PubMed
    1. Piatnek-Leunissen DA, Leunissen RL. Liver mitochondrial function in acute vs. chronic hyperthyroidism. Endocrinology. 1969;84:456–461. - PubMed
    1. Varas SM, Oliveros LB, Gimenez MS. Lipids in rat liver submitted to acute and chronic hyperthyroidism. Horm Metab Res. 1999;31:514–518. - PubMed
    1. Sarne DH, Refetoff S, Rosenfield RL, Farriaux JP. Sex hormone-binding globulin in the diagnosis of peripheral tissue resistance to thyroid hormone: the value of changes after short term triiodothyronine administration. J Clin Endocrinol Metab. 1988;66:740–746. - PubMed
    1. Cheng SY, Leonard JL, Davis PJ. Molecular aspects of thyroid hormone actions. Endocr Rev. 2010;31:139–170. - PMC - PubMed

Publication types