. 2016 Apr;52(4):537-55.
doi: 10.1037/dev0000080. Epub 2016 Feb 11.

The development of visual search in infancy: Attention to faces versus salience

Affiliations

The development of visual search in infancy: Attention to faces versus salience

Mee-Kyoung Kwon et al. Dev Psychol. 2016 Apr.

Abstract

Four experiments examined how faces compete with physically salient stimuli for the control of attention in 4-, 6-, and 8-month-old infants (N = 117 total). Three computational models were used to quantify physical salience. We presented infants with visual search arrays containing a face and familiar object(s), such as shoes and flowers. Six- and 8-month-old infants looked first and longest at faces; their looking was not strongly influenced by physical salience. In contrast, 4-month-old infants showed a visual preference for the face only when the arrays contained 2 items and the competitor was relatively low in salience. When the arrays contained many items or the only competitor was relatively high in salience, 4-month-old infants' looks were more often directed at the most salient item. Thus, over ages of 4 to 8 months, physical salience has a decreasing influence and faces have an increasing influence on where and how long infants look.


Figures

Figure 1
Figure 1
Examples of stimuli (left side) and salience maps of those stimuli (right side) adapted from “An eye tracking investigation of developmental changes in bottom-up attention orienting to faces in cluttered natural scenes,” by D. Amso, S. Haas, & J. Markant, 2014, PLoS ONE, 9(1), e85701, p. 3. Used under a Creative Commons (CC-BY) license. The red spots correspond to the region of highest salience.
Figure 2
Figure 2
Schematic depiction of a trial and display from Experiment 1 (main experiment). The face image was obtained from the NimStim Face Stimulus Set (Tottenham, Tanaka, Leon, McCarry, Nurse, Hare, et al., 2009) with permission from the authors. The authors received signed consent for his likeness to be published in scientific journals from the individual whose face appears here.
Figure 3
Figure 3
Sample displays with AOIs from Experiment 1. The AOIs for the stimulus locations and the center are indicated by black boxes in the figure (these boxes were not shown to the infants). The face image was obtained from the NimStim Face Stimulus Set (Tottenham et al., 2009) and the individual whose face appears here gave signed consent for his likeness to be published in scientific journals.
Figure 4
Figure 4
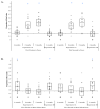
Mean proportions of first fixations and first saccades to the face (A) or to the most salient item as determined by an agreement of at least 2 toolboxes (B). Chance level, indicated by the horizontal line, was .167, and means that differed significantly from chance (p ≤ .05) are indicated by an asterisk. Each individual circle represents the change preference for a single infant. The bar bisecting the boxes reflects the mean and the boundaries of box reflects the 95% confidence interval for that mean.
Figure 5
Figure 5
Mean proportions of durations of looking to either the face (A) or most salient item (B) in each array for the main experiment (trials 5 s in duration) and the replication (trials 12 s in duration). Means that were significantly different from chance (.167) are indicated by * p <.05.
Figure 6
Figure 6
Examples of stimulus arrays in Experiments 2A (left) and 2B (right). The face image was obtained from the NimStim Face Stimulus Set (Tottenham et al., 2009) and the individual whose face appears here gave signed consent for his likeness to be published in scientific journals.
Figure 7
Figure 7
Infants’ first looks and first saccades to the face (A) and salient item (B) in each array of Experiments 2A and 2B. Chance level, indicated by the horizontal line, was .5; means that differed significantly from chance are indicated by an asterisk, p < .05. Each individual circle represents the score for an individual infant. The bar bisecting the boxes reflects the mean and the boundaries of box reflects the 95% confidence interval for that mean.
Figure 8
Figure 8
Proportion of infants’ looking duration directed to the face and most salient item in each array of Experiments 2A and 2B. Means that were significantly different from chance (.50) are indicated by * p <.05.

References

    1. Adams RJ. An evaluation of color preference in early infancy. Infant Behavior and Development. 1987;10(2):143–150. doi: 10.1016/0163-6383(87)90029-4. - DOI
    1. Adler SA, Orprecio J. The eyes have it: Visual pop-out in infants and adults. Developmental Science. 2006;9(2):189–206. doi: http://dx.doi.org/10.1111/j.1467-7687.2006.00479.x. - DOI - PubMed
    1. Amso D, Haas S, Markant J. An eye tracking investigation of developmental change in bottom-up attention orienting to faces in cluttered natural scenes. PloS One. 2014;9(1):e85701. doi: 10.1371/journal.pone.0085701. - DOI - PMC - PubMed
    1. Amso D, Haas S, Tenenbaum E, Markant J, Sheinkopf SJ. Bottom-Up Attention Orienting in Young Children with Autism. Journal of Autism and Developmental Disorders. 2013 doi: 10.1007/s10803-013-1925-5. - DOI - PMC - PubMed
    1. Althaus N, Mareschal D. Using saliency maps to separate competing processes in infant visual cognition. Child development. 2012;83(4):1122–1128. - PubMed

Publication types