. 2016 Feb 10;19(2):254-66.
doi: 10.1016/j.chom.2016.01.002.

Integrated Omics Analysis of Pathogenic Host Responses during Pandemic H1N1 Influenza Virus Infection: The Crucial Role of Lipid Metabolism

Affiliations

Integrated Omics Analysis of Pathogenic Host Responses during Pandemic H1N1 Influenza Virus Infection: The Crucial Role of Lipid Metabolism

Jennifer Tisoncik-Go et al. Cell Host Microbe. .

Abstract

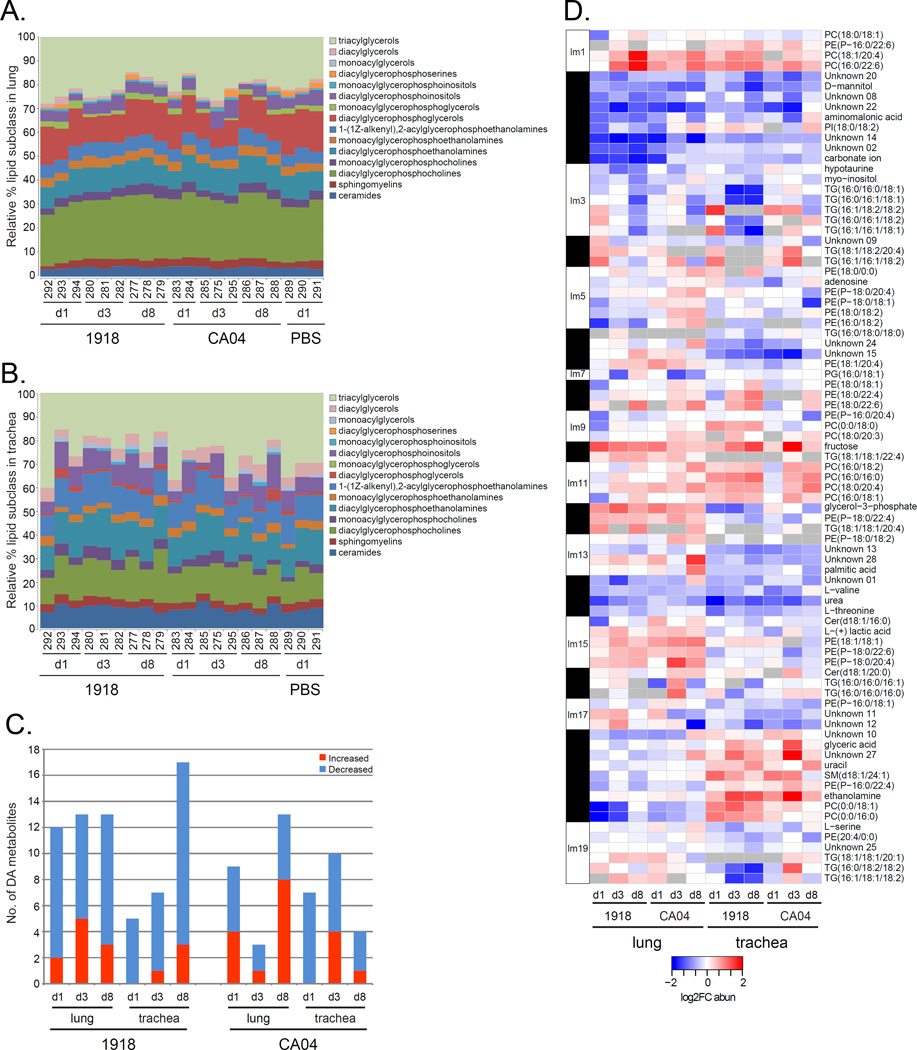
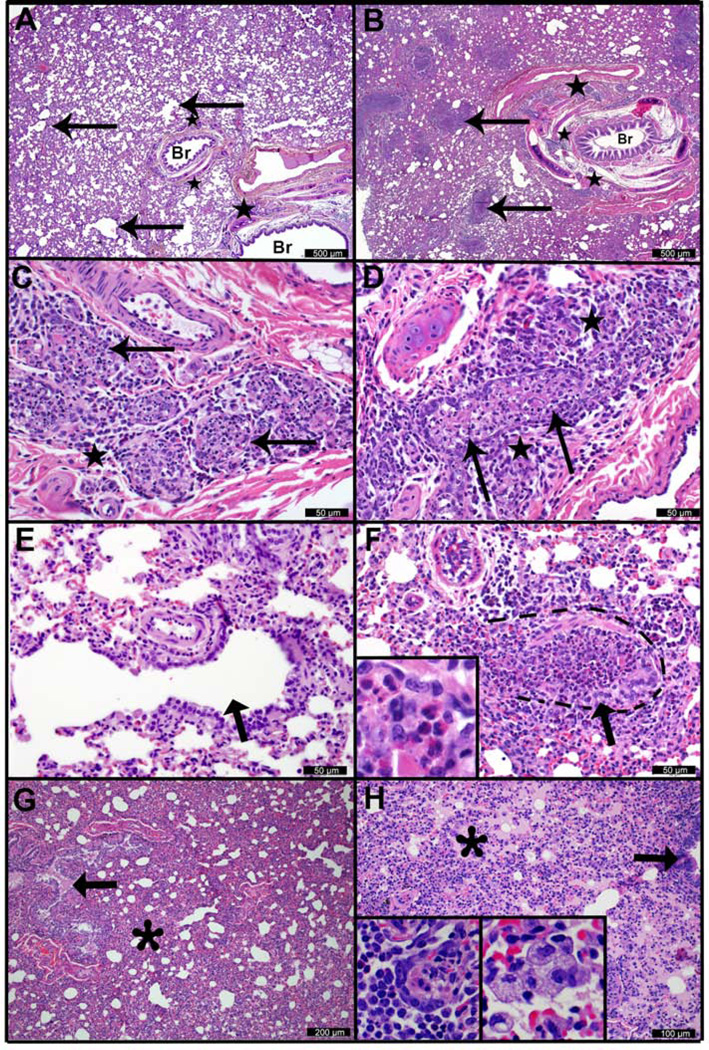
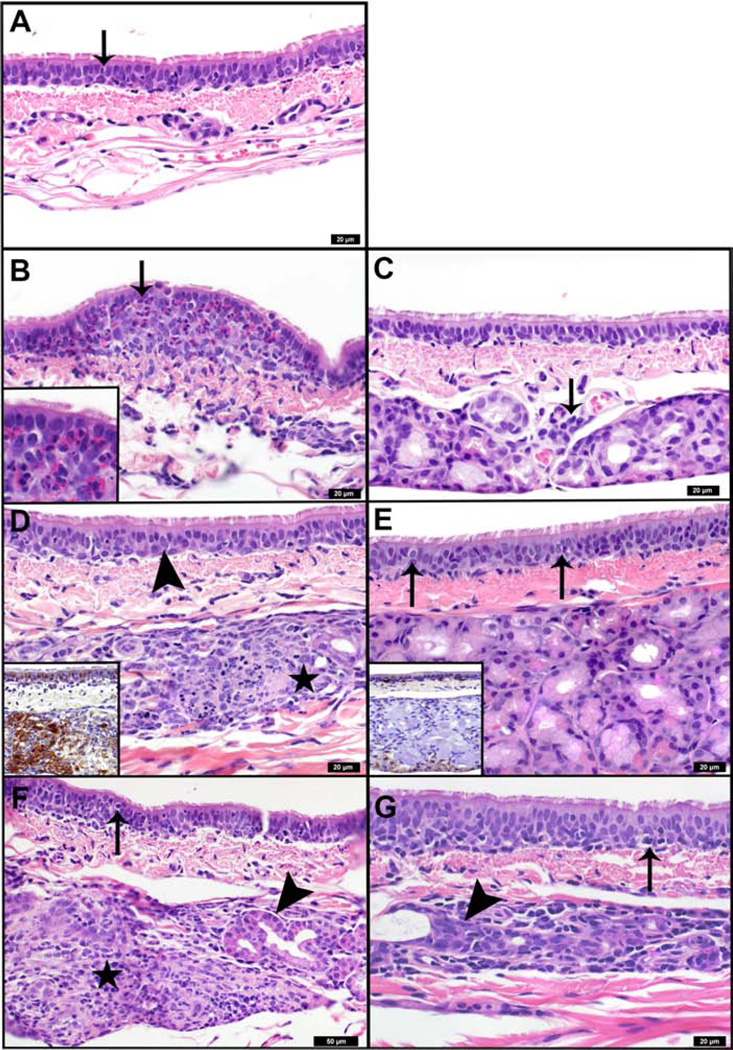
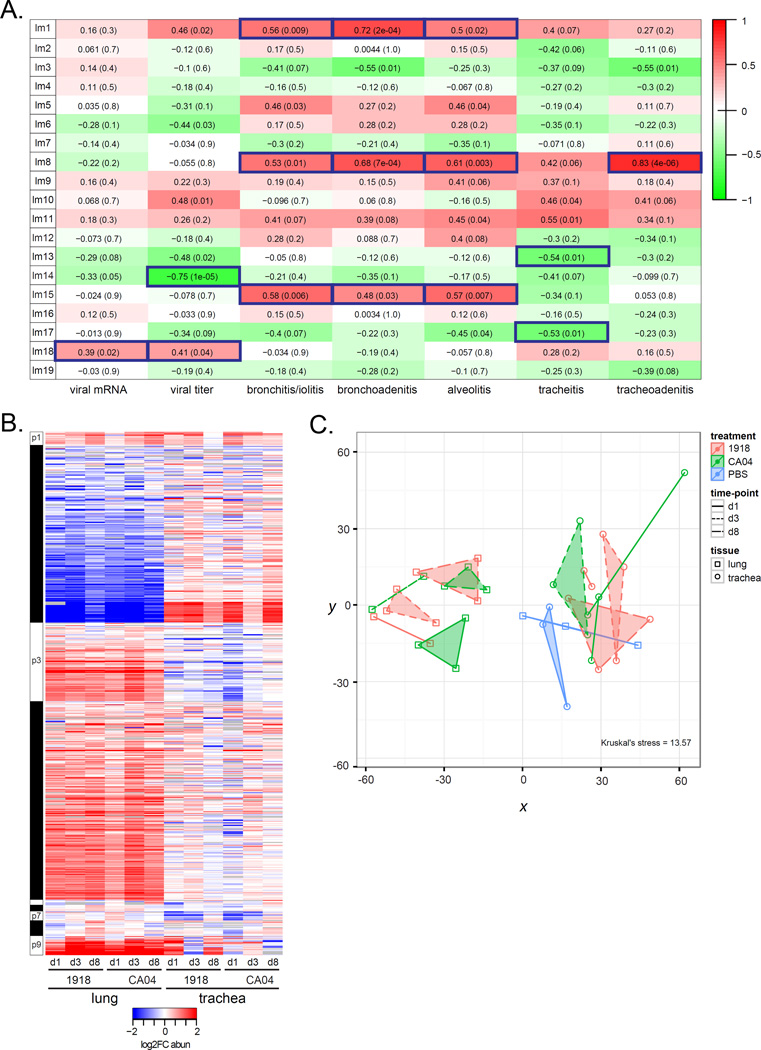
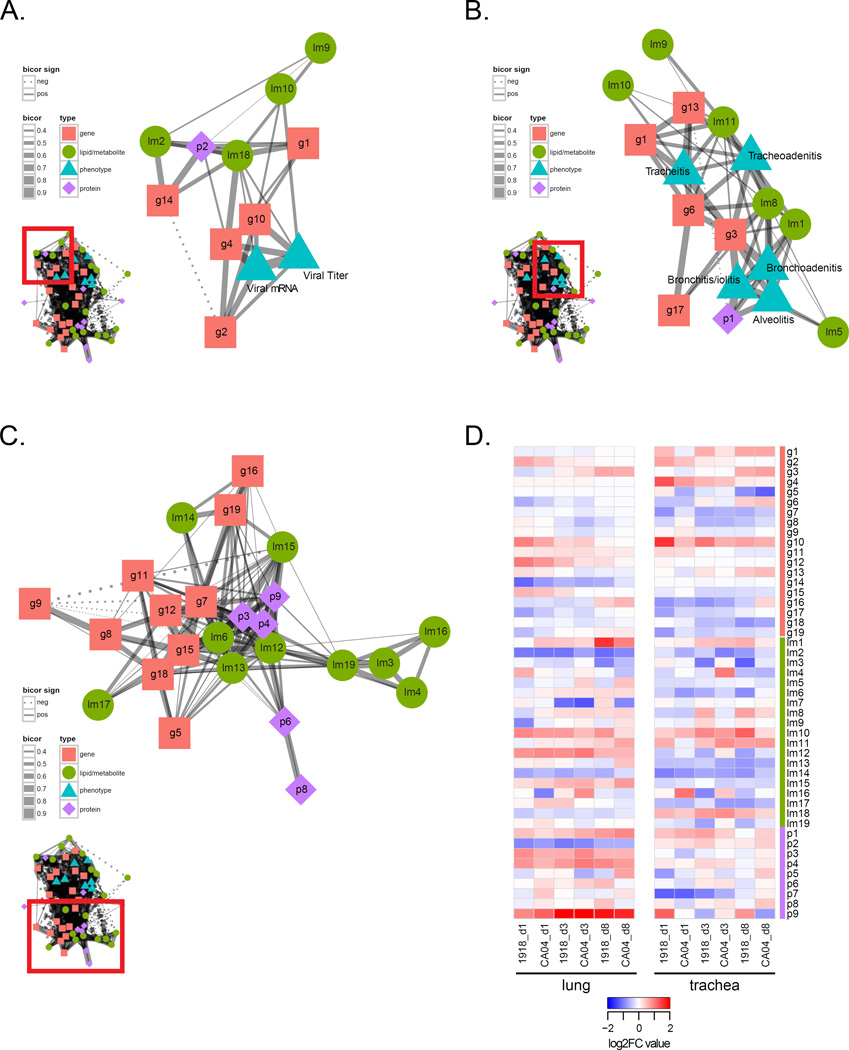
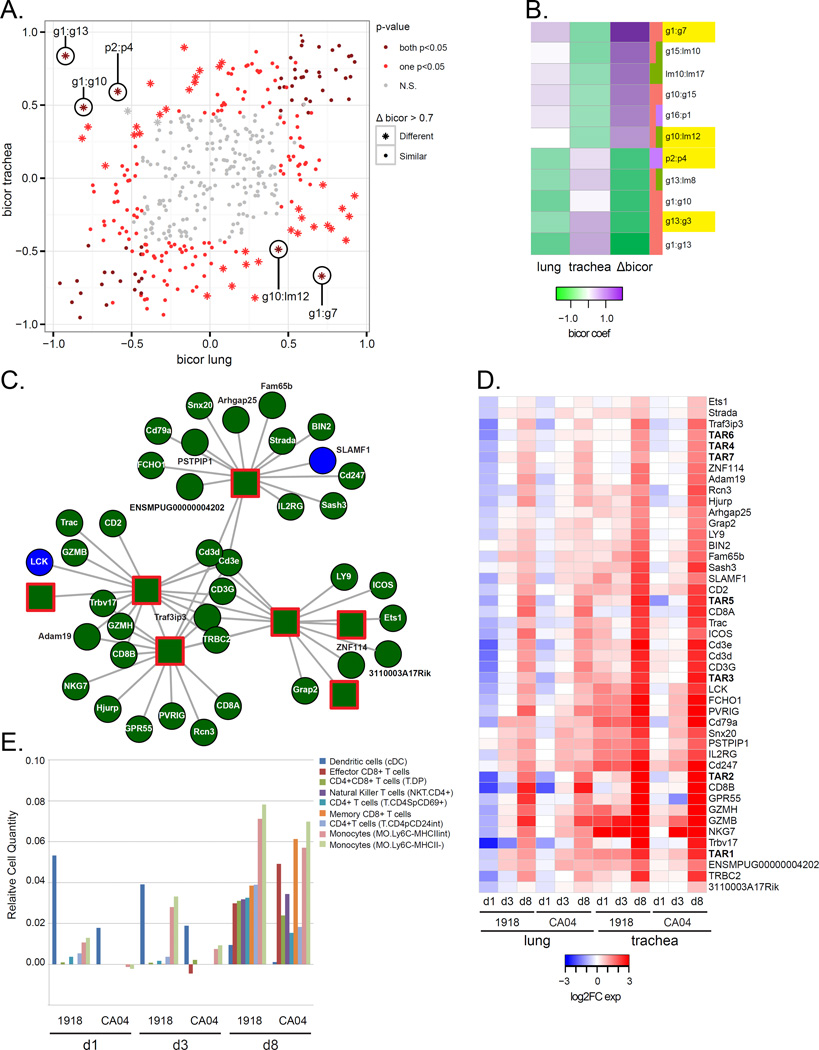
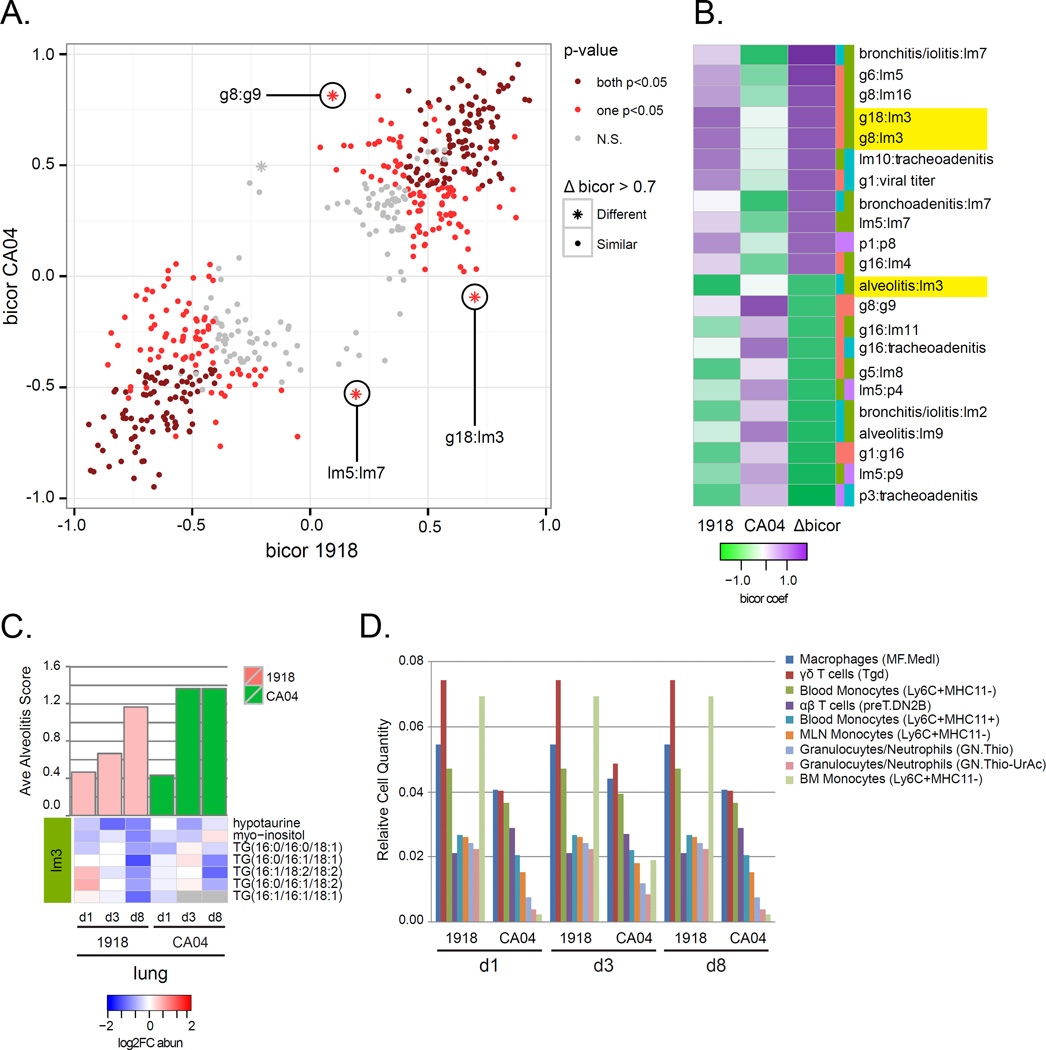
Pandemic influenza viruses modulate proinflammatory responses that can lead to immunopathogenesis. We present an extensive and systematic profiling of lipids, metabolites, and proteins in respiratory compartments of ferrets infected with either 1918 or 2009 human pandemic H1N1 influenza viruses. Integrative analysis of high-throughput omics data with virologic and histopathologic data uncovered relationships between host responses and phenotypic outcomes of viral infection. Proinflammatory lipid precursors in the trachea following 1918 infection correlated with severe tracheal lesions. Using an algorithm to infer cell quantity changes from gene expression data, we found enrichment of distinct T cell subpopulations in the trachea. There was also a predicted increase in inflammatory monocytes in the lung of 1918 virus-infected animals that was sustained throughout infection. This study presents a unique resource to the influenza research community and demonstrates the utility of an integrative systems approach for characterization of lipid metabolism alterations underlying respiratory responses to viruses.


Figures

Figure 1
Figure 1. Lipidomic and metabolomic analysis of ferret lung and trachea infected with 1918 and CA04 viruses
A) Lipid subclasses identified in the lung. B) Lipid subclasses identified in the trachea. Stacked bar graphs represent the relative percentages of lipid subclasses from individual animals. The lipid subclass annotations are according to the LIPID MAPS structure database (LMSD). C) Bar graph showing total number of differentially abundant (DA) metabolites in the lung and trachea of 1918 and CA04 virus-infected ferrets. Comparative statistical analyses of mock with 1918 and CA04 at each time point were performed using a Dunnett adjusted t-test (P < 0.05). Red depicts metabolites with increased abundance relative to mock and blue depicts metabolites with decreased abundance relative to mock. D) Heatmap of average log2FC abundances of 50 DA lipids and 33 DA metabolites from the lipid metabolite network inferred for 42 samples corresponding to all time points and both lung and trachea compartments. Modules assignments (1 to 19) are shown on the left-hand side of the heatmap. Missing values in 2 or more replicates were treated as a missing value when averaging the replicates and are depicted as grey. Rows are lipids and metabolites and columns are experimental conditions. See also Table S1 and File S2, first tab.
Figure 2
Figure 2. Histologic lesions in ferret lung 3 days after infection with pandemic H1N1 influenza viruses
Histopathological assessment of ferret lung infected with 1918 (left column) or CA04 (right column) viruses. A) 1918 virus infection. There is patchy atelectasis and thickening of alveolar walls. “Br” indicates unaffected medium and large bronchioles, and arrows indicate small caliber bronchioles and terminal airways. Stars indicate foci of bronchiolar submucosal gland necrosis and inflammation. B) CA04 infection. “Br” indicates large bronchiole containing a crescent of fibrinocellular exudate. Arrows indicate numerous small caliber bronchioles and terminal airways that have been effaced by necrosis and mixed inflammatory exudates. Adjacent alveolar tissue is consolidated and there is loss of alveolar architectural definition. Stars indicate foci of bronchiolar submucosal gland necrosis and inflammation. C) 1918 infection and D) CA04 infection. Bronchiolar submucosal gland necrosis. Arrows indicate affected glandular acini in which the epithelium is largely absent and lumena are filled with cellular debris, neutrophils, macrophages and eosinophils. Star indicates periglandular infiltrates of lymphocytes, plasma cells, and eosinophils. E) 1918 infection and F) CA04 infection. Small bronchioles and terminal airways, higher magnification of micrographs A and B, respectively. Arrows indicate similarly sized transitional and terminal airways. The airway in E is minimally affected. Dashes in F demark the approximate location of the small airway wall. The indicated airway and adjacent alveoli in F exhibit segmental necrosis and ulceration, and the airway lumen is filled with exudate composed of cellular debris and mixed inflammatory cells (inset F) including numerous eosinophils, fewer macrophages, lymphocytes and neutrophils. G) 1918 infection and H) CA04 infection. Regional atelectasis with effusion (asterisks). Arrows indicate bronchioles, the lumen of the bronchiole in G contains effusion (pink material). H, left inset) a central C-shaped crescent of Type II pneumocyte hyperplasia and adjacent intra-alvoeolar eosinophils, macrophage, and lymphocytes (left and bottom). H, right inset) a cluster of foamy macrophages in an affected alveolus. See also Figure S1.
Figure 3
Figure 3. Histologic lesions in ferret trachea infected with pandemic H1N1 influenza viruses, and transcriptomic analysis of host responses
Histopathological assessment of ferret trachea infected with 1918 (left column) or CA04 (right column) viruses. A) Mock-infected tracheal mucosa 1 day after infection. Arrow indicates scattered individual eosinophils, and rare neutrophils and lymphocytes within the respiratory epithelium. B) Day 1 1918 infection. Arrow indicates nodular expansion of the respiratory epithelium by a predominately eosinophilic infiltrate (inset). Adjacent epithelial cells are disorganized and exhibit moderate variability in cell and nuclear size, and are occasionally necrotic. C) Day 1 CA04 infection. Arrow indicates perivascular aggregate of lymphocytes adjacent to submucosal glands. Scattered lymphocytes are also present in the submucosa and basal regions of the epithelium. There is mild variability in the cell and nuclear size and shape of the respiratory epithelium. D) Day 3 1918 infection. Star indicates submucosal gland degeneration and necrosis. Arrow indicates respiratory epithelial cells with cytoplasmic clearing and enlarged irregular nuclei. Affected respiratory and glandular epithelial cells were strongly immunoreactive for polyclonal anti-influenza antibodies (inset, brown staining). E) Day 3 CA04 infection. Arrows indicate lymphocytes in respiratory epithelium. Adjacent epithelial cells are mildly disorganized and exhibit mild variability in their cell and nuclear size and shape. Affected respiratory epithelial cells were moderately immunoreactive for polyclonal anti-influenza antibodies (inset, brown staining). Submucosal glands were largely unaffected; however, some reserve cells exhibited positive immunoreactivity. F) Day 8 1918 infection and G) Day 8 CA04 infection. Remnant submucosal glands are lined by hypertrophic and hyperplastic epithelium (arrowheads). Necrotic glands observed on day 3 (panel D) have been replaced by densely cellular infiltrates of macrophages and lymphocytes (star). Numerous lymphocytes and cellular debris are present in the overlying respiratory epithelium (arrows).
Figure 4
Figure 4. Correlation analysis of lipids and metabolites with phenotypes and protein network analysis
A) Correlation of phenotypic traits (i.e., virologic and histopathologic phenotypes) with lipid metabolite module eigengenes (MEs) using the biweight midcorrelation (bicor) method. Pairwise bicor were calculated between MEs and viral mRNA, viral titer, and histopathologic scores averaged across all subcategories from tracheal, bronchial and alveolar compartments. See also File S1. Listed in each cell of the ME-phenotype matrix is the bicor coefficient and corresponding p-value. Relationships with a P<0.05 were considered significant. For example, for the lm1:bronchoadenitis relationship, the bicor value is 0.72 and the p-value is 2e-04, indicating a significant positive correlation between lm1 and bronchoadenitis. B) Heatmap of average log2 FC abundance of 810 DA proteins from the protein network inferred for 37 samples corresponding to all time points and both lung and trachea compartments. Modules assignments (1 to 9) are shown on the left-hand side of the heatmap. Missing values in 2 or more replicates were treated as a missing value when averaging the replicates and are depicted as grey. Rows are proteins and columns are experimental conditions. See also File S2, second tab. C) Multidimensional scaling (MDS) representation of the distances among samples based protein log2 abundances (Kruskal's stress = 13.57). The Kruskal stress signifies the amount of information lost due to the dimensionality reduction as a fraction of total information. Points coded as per legend and denote individual animals. Convex hulls link points belonging to the same experimental condition and time point. See also Table S4.
Figure 5
Figure 5. Integrated co-expression network analysis of ferret host responses to pandemic H1N1 influenza virus infection
The integrated omics network related to A) influenza virus replication, B) respiratory disease, and C) relationships among different molecular species. The integrated omics network was constructed by calculating pairwise correlations between modules from independent lipid and metabolite, protein, and gene networks and between all modules and phenotypic data. Nodes represent each module as a single point colored according to data type. Gene (g) modules are symbolized by pink squares. Lipid metabolite (lm) modules are symbolized by green circles. Protein (p) modules are symbolized by purple diamonds. Phenotype modules are symbolized by blue triangles. Edges between nodes signify biweight midcorrelation (bicor) coefficients between the representative expression profiles (module eigengenes, MEs) of all lipid and metabolite, gene, and protein module pairs with histopathologic and virologic phenotypes. Only significant correlations are shown (P<0.05). Positive bicor coefficients are represented by a solid line. Negative bicor coefficients are represented by a dashed line. The line thickness corresponds to the strength of the bicor coefficient (bicor 0.4–0.9). B) Dynamics of module expression levels in different respiratory compartments (lung and trachea) and at different time points following infection with either 1918 or CA04 viruses. The heatmap depicts median log2FC values for each module across the experimental dataset. Rows are modules and columns are experimental conditions. See also Figure S3.
Figure 6
Figure 6. Variation in network information exchange between tissue compartments
For each module of the integrated network, MEs were recalculated considering lung and trachea samples separately. Pairwise correlations between MEs (ME:ME) and between ME and phenotypes (ME:traits) were calculated using the bicor method and separate lung and trachea networks were inferred. A) The scatterplot shows the relationships between trachea and lung bicor coefficients. Each point represents an ME:ME comparison and the points are colored according to the p-value of the bicor coefficient. Dark red depicts significant (p<0.05) correlations in both lung and trachea networks. Light red depicts significant (p<0.05) correlations in either the lung or the trachea network. Grey depicts neither trachea nor lung bicor are significant (N.S.). Star points represent the largest changes in relationships between MEs (absolute Δbicor>0.7). All points in the scatterplot are also represented in the integrated network. B) The heatmap shows bicor coefficients in lung and trachea networks for the largest correlation difference between the two tissues. Purple represents positive bicor coefficients and green represents negative bicor coefficients. The difference in correlation between lung and trachea is represented in the column depicting Δbicor values. Edges with an absolute Δbicor value > 0.7 are shown. C) Transcriptionally active regions (TARs) hubs, arbitrarily named (i.e., TAR1, TAR2, etc.), from gene module g3 enriched for T cell receptor signaling genes, with the top 15 most correlated entries for each TAR hub shown. Darkgreen nodes = module g3 and blue nodes = module g1. Circles depict coding genes and unannotated genes. Squares with red outline depict TAR hubs. TAR1: tu_XLOC_159227; TAR2: muXLOC_025170; TAR3: mu_XLOC_164742; TAR4: tu_XLOC_232027; TAR5: mu_XLOC_063539; TAR6: mu_XLOC_236016; TAR7: tu_XLOC_232026. D) Expression of 45 DE ferret genes and TARs shown in C). The average log2FC values for each virus condition relative to day 1 mock at each time point (days 1, 3 and 8 post-inoculation) in the lung and trachea are shown in the heatmap. Red is increased expression relative to mock and blue is decreased expression relative to mock. White depicts no change in expression. Associated gene names were used for annotation. TARs are in bold. E) Predicted immune cell types in the trachea were inferred using Digital Cell Quantifier (DCQ). Cell populations with relative cell quantities > 0.03 in at least 1 of 6 conditions are shown for each virus condition and time-point. The y-axis shows the relative cell quantity measure for inferred cells. The x-axis shows the inferred cells at each time-point and condition. See also Table S6.
Figure 7
Figure 7. Variation in network information exchange between 1918 and CA04 viruses
For each module of the integrated network, MEs were recalculated considering 1918 and CA04 samples separately. Pairwise correlations between MEs (ME:ME) and between ME and phenotypes (ME:traits) were calculated using the bicor method and separate 1918 and CA04 networks were inferred. A) The scatterplot shows the relationships between 1918 and CA04 bicor coefficients. Each point represents an ME:ME comparison and the points are colored according to the p-value of the bicor coefficient. Dark red depicts significant (p<0.05) correlations in both 1918 and CA04 networks. Light red depicts significant (p<0.05) correlations in either the 1918 or the CA04 network. Grey depicts neither 1918 nor CA04 bicor are significant (N.S.). Star points represent the largest changes in relationships between MEs (absolute Δbicor>0.7). All points in the scatterplot are also represented in the integrated network. B) The heatmap shows bicor coefficients in 1918 and CA04 networks for the largest correlation difference between the two viruses. Purple represents positive bicor coefficients and green represents negative bicor coefficients. The difference in correlation between 1918 and CA04 is represented in the column depicting Δbicor values. Edges with an absolute Δbicor value > 0.7 are shown. C) Lipid metabolite module lm3 differentially correlated with alveolitis between 1918 and CA04. The ave alveolits score is shown for each condition; 1918 (pink); CA04 (green); PBS (blue). Heatmap of log2FC abundance for lipids and metabolites grouped into lm3 are shown. D) Predicted immune cell types in the lung were inferred using DCQ. Cell populations with relative cell quantities > 0.02 in at least 3 of 6 conditions are shown. The y-axis shows the relative cell quantity measure for the inferred cells. The x-axis shows the inferred cells at each time-point and condition. See also Table S6.

Similar articles

Cited by

References

    1. Altboum Z, Steuerman Y, David E, Barnett-Itzhaki Z, Valadarsky L, Keren-Shaul H, Meningher T, Mendelson E, Mandelboim M, Gat-Viks I, et al. Digital cell quantification identifies global immune cell dynamics during influenza infection. Mol Syst Biol. 2014;10:720. - PMC - PubMed
    1. Audoy-Remus J, Richard JF, Soulet D, Zhou H, Kubes P, Vallieres L. Rod-Shaped monocytes patrol the brain vasculature and give rise to perivascular macrophages under the influence of proinflammatory cytokines and angiopoietin-2. J Neurosci. 2008;28:10187–10199. - PMC - PubMed
    1. Barbalat R, Lau L, Locksley RM, Barton GM. Toll-like receptor 2 on inflammatory monocytes induces type I interferon in response to viral but not bacterial ligands. Nat Immunol. 2009;10:1200–1207. - PMC - PubMed
    1. Chignalia AZ, Vogel SM, Reynolds AB, Mehta D, Dull RO, Minshall RD, Malik AB, Liu Y. p120-catenin expressed in alveolar type II cells is essential for the regulation of lung innate immune response. Am J Pathol. 2015;185:1251–1263. - PMC - PubMed
    1. Coulombe F, Jaworska J, Verway M, Tzelepis F, Massoud A, Gillard J, Wong G, Kobinger G, Xing Z, Couture C, et al. Targeted prostaglandin E2 inhibition enhances antiviral immunity through induction of type I interferon and apoptosis in macrophages. Immunity. 2014;40:554–568. - PubMed

Publication types