

Review
doi: 10.1259/bjr.20151018.
Epub 2016 Mar 2.
Adrenal imaging for adenoma characterization: imaging features, diagnostic accuracies and differential diagnoses
Affiliations
- PMID: 26867466
- PMCID: PMC5258164
- DOI: 10.1259/bjr.20151018
Item in Clipboard
Review
Adrenal imaging for adenoma characterization: imaging features, diagnostic accuracies and differential diagnoses
Br J Radiol.
2016 Jun.
Abstract
Adrenocortical adenoma is the most common adrenal tumour. This lesion is frequently encountered on cross-sectional imaging that has been performed for unrelated reasons. Adrenal adenoma manifests various imaging features on CT, MRI and positron emission tomography/CT. The learning objectives of this review are to describe the imaging findings of adrenocortical adenoma, to compare the sensitivities of different imaging modalities for adenoma characterization and to introduce differential diagnoses.
Figures
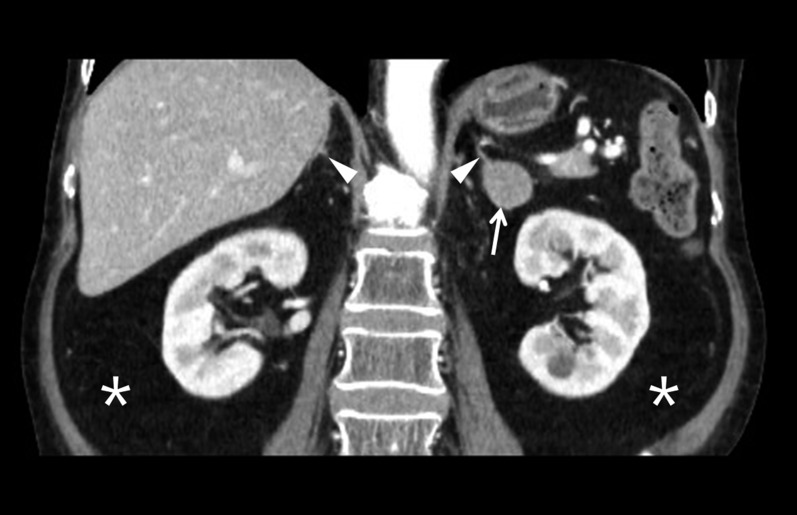
A 58-year-old female with Cushing’s syndrome. Contrast-enhanced coronal CT image showing a left adrenal adenoma (arrow). Adrenocortical atrophy (arrowhead) is seen owing to excessive production of cortisol. The asterisks show a huge amount of fat, resulting from Cushing’s syndrome, the so-called adrenal Cushing’s.
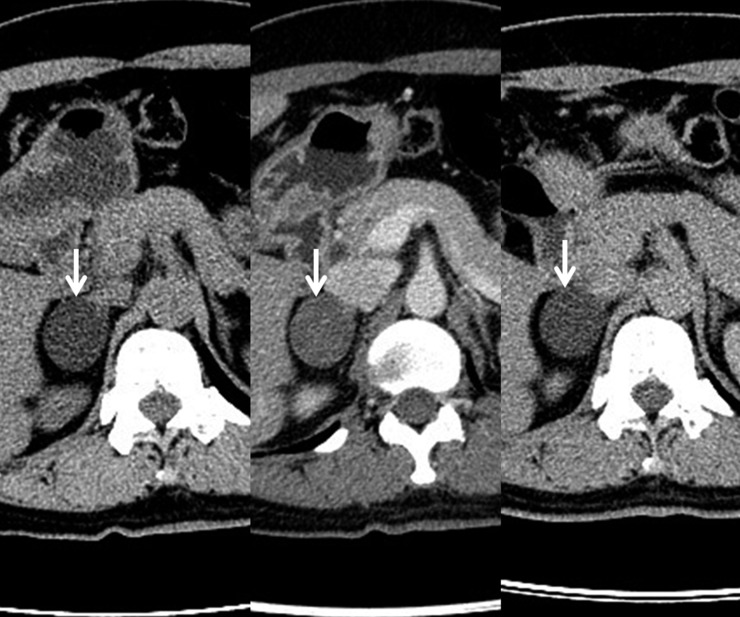
A 44-year-old female with a lipid-rich adenoma. A right adrenal adenoma (arrow) measuring −16 HU on unenhanced (left sided) CT image. The lesion measures 42 HU and −4.5 HU on 1-min (middle) and 15-min (right sided) CT images after injection of the contrast material. The absolute and relative percentage washouts are calculated as 79% and 110%, respectively.
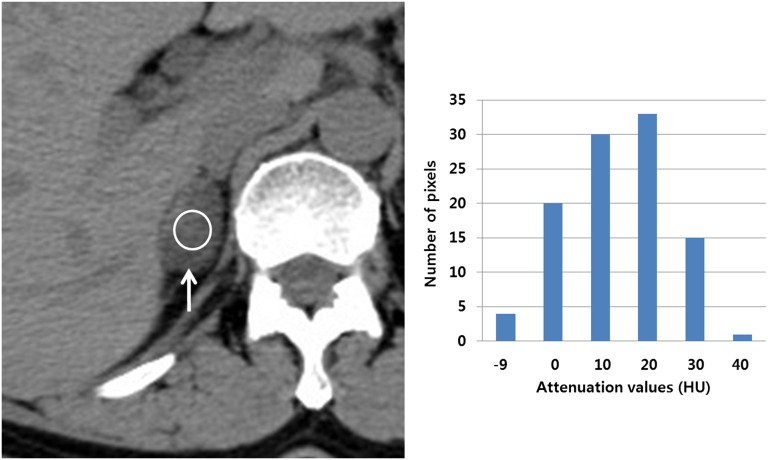
Histogram analysis in a 48-year-old female with a lipid-poor adenoma. Unenhanced CT (UCT) image showing a right adrenal mass (arrow) in which a region of interest (ROI) (circle) is present measuring 15.1 HU. The lesion is not consistent with the adenoma on UCT. Bar graph showing that the lesion contains approximately 23% negative pixels within the ROI. The following pixel statistics include the total pixel count, 103; pixel range, −9 to 40 HU; average, 15.1 HU; and standard deviation, 10.5 HU. However, the lesion does not contain any negative pixels on contrast-enhanced CT images (not shown). Therefore, UCT histogram analysis alone can characterize the adenoma without the necessity of washout CT scans.
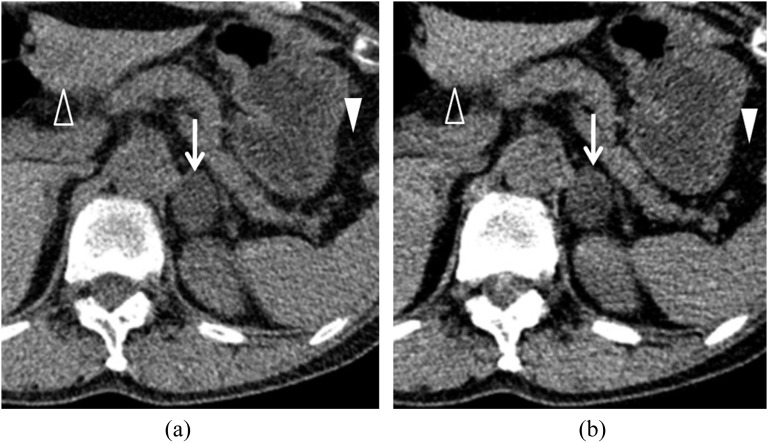
Dual-energy unenhanced CT (UCT) in a 66-year-old female with an adenoma. (a) Unenhanced 140-kVp CT image showing a left adrenal mass (arrow) that is measuring 11 HU. A solid arrowhead indicates the fat tissue within the gastrosplenic ligament. An open arrowhead indicates left hepatic parenchyma. (b) Unenhanced 80-kVp CT image showing that the lesion (arrow) attenuation value has decreased to −7 HU. The gastrosplenic fat attenuation (solid arrowhead) is decreasing, while the left hepatic parenchyma (open arrowhead) attenuation is increasing.
Virtual unenhanced CT (UCT) in a 59-year-old male with a lipid-rich adenoma. Portal-phase dual-energy CT image (left sided) showing that a left adrenal mass (arrow) is present measuring 72 HU. Virtual UCT image (right side) from the raw data of the dual-energy CT image showing that the lesion (arrow) is measuring 6 HU.

Macronodular hyperplasia a 49-year-old male with hyperplasia. (a) Left adrenal hyperplasia (arrow) is present measuring 8 HU on unenhanced (left sided) CT image. The lesion (arrow) is measuring 95 HU and 29 HU on 1-min (middle) and 15-min (right sided) CT images after the injection of the contrast material, respectively. The absolute and relative percentage washouts are calculated as 76% and 69%, respectively. (b) In-phase MR image (left sided) showing that left macronodular hyperplasia (arrow) is as hyperintense as the spleen (asterisk). In contrast, opposed-phase MR image (right sided) showing that the lesion (arrow) is hypointense compared with the spleen (asterisk). Adrenal-to-spleen ratio and signal intensity index are calculated as 0.25 and 50%, respectively.
Chemical-shift imaging in a 57-year-old female with a lipid-rich adenoma. Unenhanced CT image (left sided) showing a right adrenal mass (arrow) which is measuring 5 HU, suggesting a lipid-rich adenoma. In-phase MR image (middle) showing that the lesion (arrow) is homogeneously hyperintense and the opposed-phase MR image (right side) is showing that it (arrow) is homogeneously hypointense, also suggesting a lipid-rich adenoma. These MR findings do not require quantitative analysis but visual assessment alone.

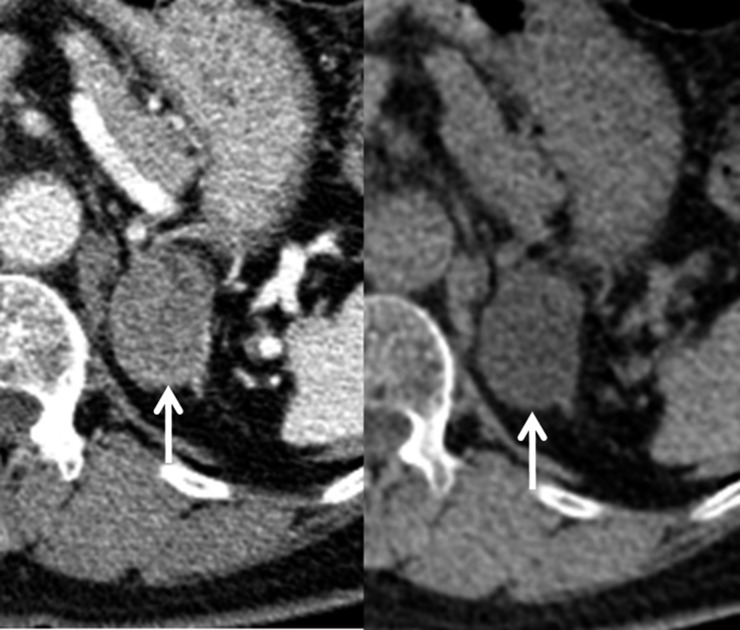
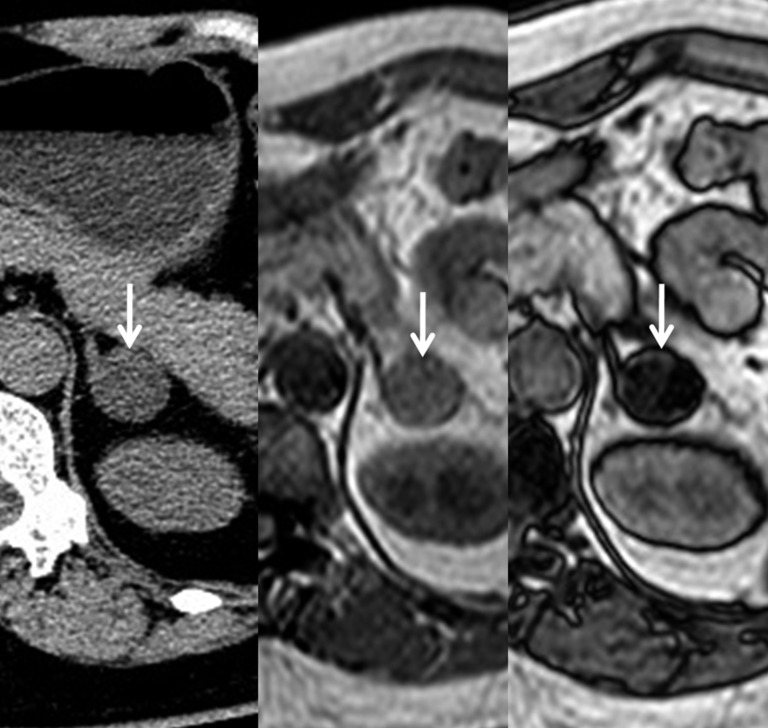
A 43-year-old male with a lipid-poor adenoma. (a) Unenhanced (left side) CT image showing that a right adrenal mass (arrow) is present measuring 14 HU. The lesion (arrow) is measuring 63 HU and 19 HU on 1-min (middle) and 15-min (right side) contrast-enhanced CT images after the injection of the contrast material, respectively. The absolute and relative percentage washouts are calculated as 89% and 69%, respectively. These findings are consistent with a lipid-poor adenoma. (b) The right adrenal mass (arrow) is slightly hyperintense on the in-phase MR image (left side), while the lesion (arrow) contains hypointense foci on the opposed-phase MR image (right side). Adrenal-to-spleen ratio is calculated as 0.68, suggesting an adenoma.
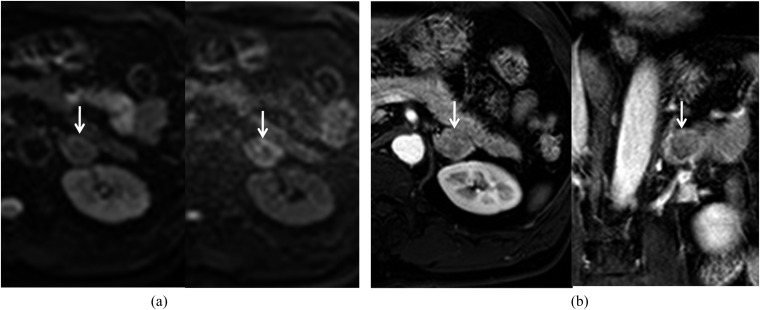
Diffusion-weighted and dynamic contrast-enhanced images in a 60-year-old male with an adenoma. (a) Diffusion-weighted images (left side for b = 0 s mm−2 and right side for b = 800 s mm−2) showing that a left adrenal mass (arrow) is mixed with high and low signal intensities. (b) Early contrast-enhanced axial image (left side) showing that the lesion (arrow) is homogeneously enhanced, while the delayed contrast-enhanced coronal image (right side) is showing that the lesion's (arrow) signal intensity is decreasing.
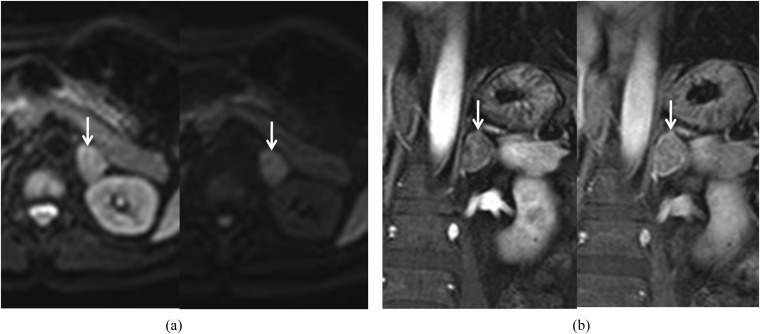
Diffusion-weighted and dynamic contrast-enhanced images in a 59-year-old male with adrenocortical carcinoma. (a) Diffusion-weighted images (left side for b = 0 s mm−2 and right side for b = 800 s mm−2) showing that a left adrenal mass (arrow) is homogeneously hyperintense owing to diffusion restriction. (b) Early contrast-enhanced coronal image (left side) showing that the lesion (arrow) is mildly enhanced, while the delayed contrast-enhanced coronal image (right side) is demonstrating the persistent enhancement of the lesion (arrow).
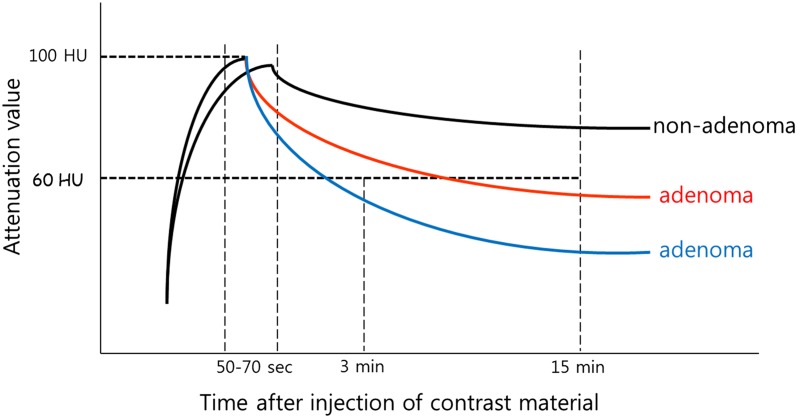
Time–attenuation curves of adenoma and non-adenoma. Most adenomas (middle) show an early wash-in and washout time–intensity curve (middle) so that these lesions require delayed enhanced CT in order to differentiate from non-adenomas (upper). However, some adenomas (lower) show an earlier wash-in and washout time–intensity curve, and these lesions do not require 10-min or 15-min delay contrast-enhanced CT scans. Multiphasic CT alone has the potential to characterize these adenomas because of high relative percentage washout (≥40%).
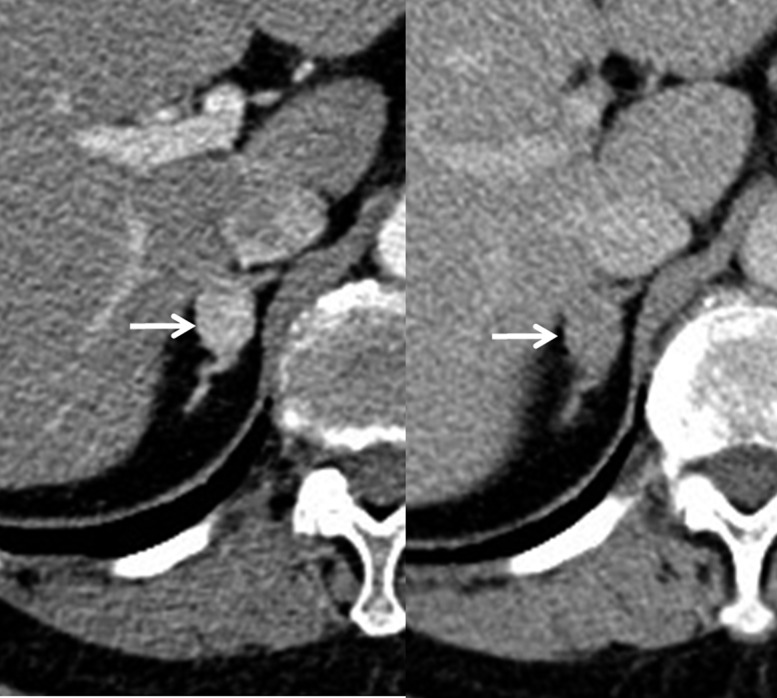
Renal CT angiography in a 77-year-old female with hypertension. A right adrenal mass (arrow) is present measuring 146 HU and 77 HU on 1-min (left side) and 3-min (right side) contrast-enhanced CT images after the injection of the contrast material. The relative percentage washout is calculated as 47%, which is consistent with the adenoma. These CT scans were obtained as renal CT arteriography protocols for evaluating renal artery stenosis. Therefore, the patient does not require additional adrenal protocol CT scans in order to determine whether or not the lesion is an adenoma.
An adenoma-mimicking pheochromocytoma in a 40-year-old male. Unenhanced (left sided) CT image showing that a left adrenal mass (arrow) is measuring 40 HU. The lesion is measuring 120 HU and 70 HU on 1-min (middle) and 15-min (right sided) contrast-enhanced CT images. The absolute and relative percentage washouts are calculated as 63% and 42%, respectively. However, the histologic diagnosis was confirmed as pheochromocytoma after adrenalectomy.

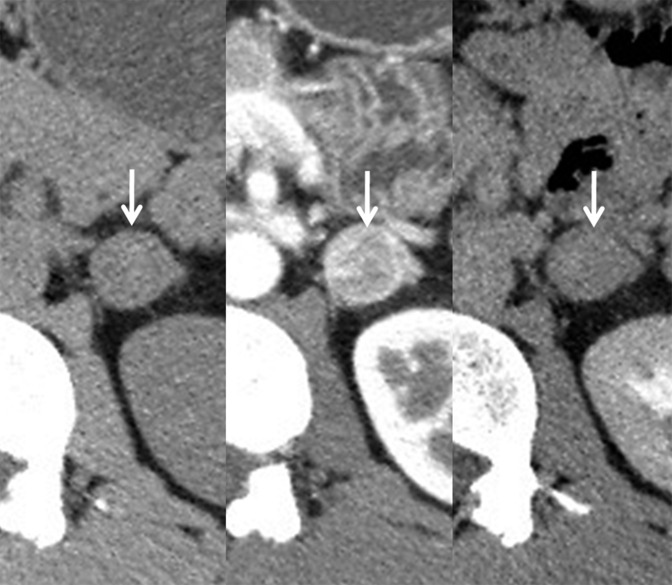
Atypical adenoma in a 71-year-old male. A right adrenal mass (arrow) is measured as 62 HU, 75 HU and 42 HU on 1-min (left sided), 3-min (middle) and 15-min (right sided) contrast-enhanced CT images after intravenous injection of the contrast material. The relative percentage washout is calculated as 32% with the lesion attenuation value on the 1-min CT image suggesting non-adenoma. However, relative percentage washout has increased to 44% with the lesion attenuation value on 3-min CT image suggesting adenoma.
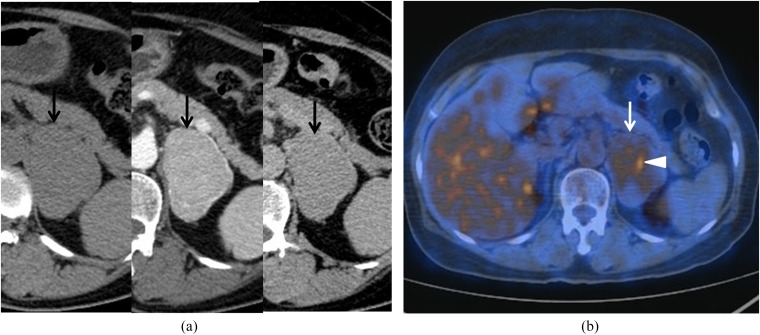
Fluorine-18-fludeoxyglucose positron emission tomography/CT (18F-FDG PET/CT) in a 61-year-old female with an adenoma. (a) Unenhanced (left sided) CT image showing that a 6-cm left adrenal mass (arrow) is present measuring 42 HU. The lesion (arrow) is measuring 151 HU and 66 HU on 1-min (middle) and 15-min (right sided) contrast-enhanced CT images, respectively. The absolute and relative percentage washouts are calculated as 78% and 56%, respectively. These findings are consistent with an adenoma. The patient was under staging work-up after rectal cancer was detected. (b) The axial fusion image of 18F-FDG PET/CT shows a hypermetabolic focus (arrowhead) within the lesion (arrow). This finding may suggest the possibility of a focal metastasis or adenocarcinoma. However, the histologic diagnosis confirmed adenoma after adrenalectomy.
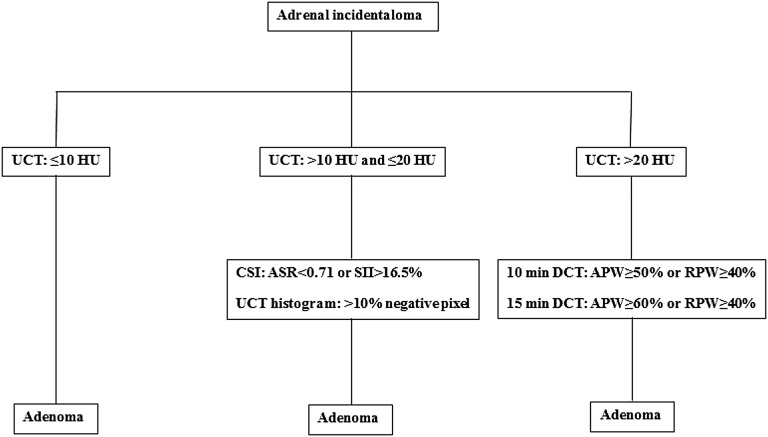
Imaging algorithm using quantitative parameters for adenoma characterization. ASR, adrenal-to-spleen ratio; APW, absolute percentage washout; CSI, chemical-shift imaging; DCT, delayed contrast-enhanced CT; RPW, relative percentage washout; SII, signal intensity index; UCT, unenhanced CT.
Similar articles
-
Comparison of computed tomography histogram analysis and chemical-shift magnetic resonance imaging for adrenal mass characterization.Acta Radiol. 2009 Nov;50(9):1071-9. doi: 10.3109/02841850903207170. Acta Radiol. 2009. PMID: 19863419
-
The indeterminate adrenal lesion.Cancer Imaging. 2010 Mar 18;10(1):102-13. doi: 10.1102/1470-7330.2010.0012. Cancer Imaging. 2010. PMID: 20299300 Free PMC article. Review.
-
Iodine and Fat Quantification for Differentiation of Adrenal Gland Adenomas From Metastases Using Third-Generation Dual-Source Dual-Energy Computed Tomography.Invest Radiol. 2018 Mar;53(3):173-178. doi: 10.1097/RLI.0000000000000425. Invest Radiol. 2018. PMID: 28990974
-
Chemical-shift MRI versus washout CT for characterizing adrenal incidentalomas.Clin Imaging. 2016 Jul-Aug;40(4):780-7. doi: 10.1016/j.clinimag.2016.02.006. Epub 2016 Feb 6. Clin Imaging. 2016. PMID: 27317224
-
[Imaging of tumours of the adrenal gland].Wien Klin Wochenschr. 2003;115 Suppl 2:65-70. Wien Klin Wochenschr. 2003. PMID: 15518149 Review. German.
Cited by
-
Assessment of biochemical outcomes in patients with primary aldosteronism after adrenalectomy based on CT scan diagnosis of unilateral adenoma without adrenal vein sampling.Front Oncol. 2022 Nov 16;12:944035. doi: 10.3389/fonc.2022.944035. eCollection 2022. Front Oncol. 2022. PMID: 36465361 Free PMC article.
-
Differential diagnosis of adrenal adenomas and metastases using spectral parameters in dual-layer detector spectral CT.J Cancer Res Clin Oncol. 2023 Sep;149(12):10453-10463. doi: 10.1007/s00432-023-04931-8. Epub 2023 Jun 6. J Cancer Res Clin Oncol. 2023. PMID: 37278828 Free PMC article.
-
Integrated Multiparametric MRI Scoring System-Based Approach in Differentiating Adrenal Adenoma From Other Adrenal Lesions.Cureus. 2025 May 21;17(5):e84564. doi: 10.7759/cureus.84564. eCollection 2025 May. Cureus. 2025. PMID: 40546489 Free PMC article.
-
CT and MRI of adrenal gland pathologies.Quant Imaging Med Surg. 2018 Sep;8(8):853-875. doi: 10.21037/qims.2018.09.13. Quant Imaging Med Surg. 2018. PMID: 30306064 Free PMC article. Review.
-
A Comparison of Near-Infrared Autofluorescence Findings in Benign Versus Malignant Adrenal Tumors.Ann Surg Oncol. 2024 Aug;31(8):5122-5127. doi: 10.1245/s10434-024-15430-6. Epub 2024 May 27. Ann Surg Oncol. 2024. PMID: 38802716 Free PMC article.
References
Publication types
MeSH terms
LinkOut - more resources
Full Text Sources
Other Literature Sources
Medical
