Review
. 2016 Apr:37:92-98.
doi: 10.1016/j.conb.2015.12.010. Epub 2016 Feb 8.

Brain structure and dynamics across scales: in search of rules

Affiliations
Review

Brain structure and dynamics across scales: in search of rules

Xiao-Jing Wang et al. Curr Opin Neurobiol. 2016 Apr.

Abstract

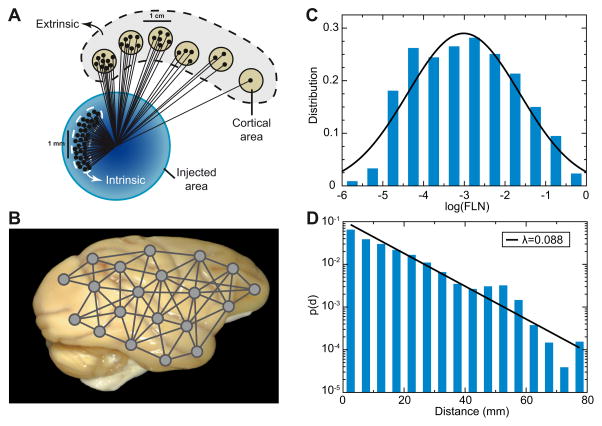
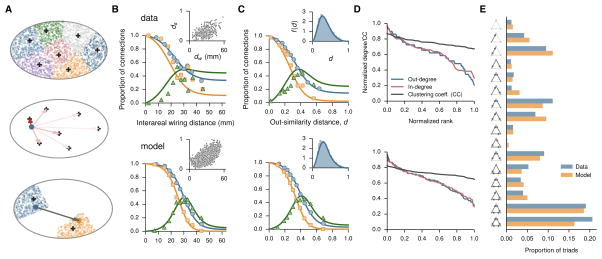
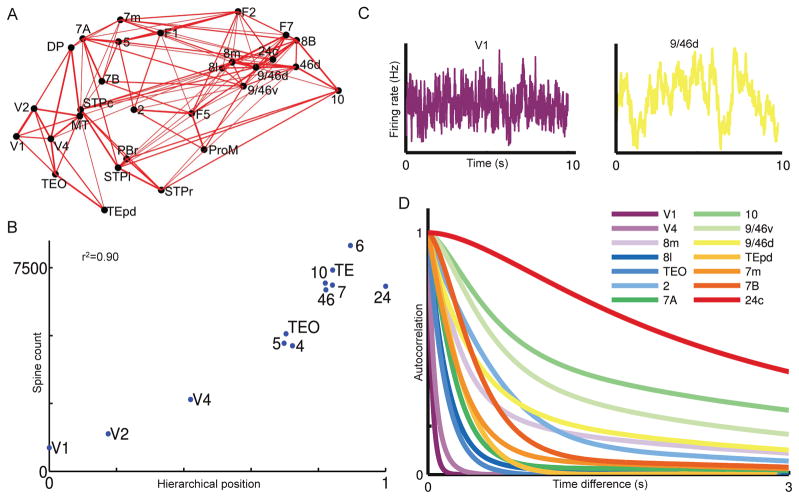
Louis Henry Sullivan, the father of skyscrapers, famously stated 'Form ever follows function'. In this short review, we will focus on the relationship between form (structure) and function (dynamics) in the brain. We summarize recent advances on the quantification of directed- and weighted-mesoscopic connectivity of mammalian cortex, the exponential distance rule for mesoscopic and microscopic circuit wiring, a spatially embedded random model of inter-areal cortical networks, and a large-scale dynamical circuit model of money's cortex that gives rise to a hierarchy of timescales. These findings demonstrate that inter-areal cortical networks are dense (hence such concepts as 'small-world' need to be refined when applied to the brain), spatially dependent (therefore purely topological approach of graph theory has limited applicability) and heterogeneous (consequently cortical areas cannot be treated as identical 'nodes').


Figures

Figure 1
Figure 1
Inter-areal connections of macaque monkey cortex. (A) A retrograde tracer is injected in a (target) area, and relative weight of connection between a source area and the target area is quantified by the fraction of labelled neurons (FLN), which is the number of labelled neurons in the source area divided by the total number of labelled neurons. (B) The analysis is carried out with a number of cortical areas, leading to a weighted- and directed- inter-areal network connectivity. (C) FLNs span five order of magnitudes and are fit by a lognormal distribution. (D) FLN between a pair of cortical areas is an exponential function of their distance, with the characteristic distance length of ~ 11 mm. Adapted with permission from [1••].
Figure 2
Figure 2
A spatially embedded random network model of large-scale cortical system. (A) The model cortex is a continuous volume in a 3D Euclidean space in the shape of a spheroid, here represented in 2D as an ellipse for illustration purposes. Top: N areal centers are chosen randomly from the spheroid (plus symbols), and the configuration of the areal centers defines the parcellation of the model cortex into N areas (various colors) through a Voronoi partition of the spheroid, i.e., each area is the set of points closer to a given center than to any other center. Middle: The source of an axon (blue dot) is sampled uniformly from within the spheroid, and the direction of the axon is determined by the sum of the forces which attract the axon to the areal centers. The individual forces decay with the distance to the areal centers (arrows) according to an inverse power law, with the strengths represented here by the red intensity from light (weak) to dark (strong) red. Bottom: With the direction fixed, the axon extends from the source (blue dot) to the target (orange dot); the length is determined by sampling from an exponential distribution. The areas corresponding to the source and target of the axon are assigned according to the parcellation shown at the top. (B) Proportion of directed connections and occurrence of reciprocal and unidirectional pairs as a function of interareal (center-to-center) wiring distance in data (top) and model (bottom). The occurrence of reciprocal (squares) and unidirectional (triangles) connections are compared with p2 (orange line) and 2p(1-p) (green line), respectively, where p is the maximum-likelihood estimate of the proportion of directed connections (blue line). (Insets) Relationship between similarity and wiring distances in the edge-complete subnetwork. (C) Same as B but as a function of output similarity distance. (Insets) Distribution of similarity distances. (D) Normalized in- and out-degree sequences and clustering coefficients (for areas in the edge-complete subnetwork). In-degree represents input from all 91 source areas, for the 29 injected areas; out-degree represents output to the 29 injected areas, from all 91 source areas. (E) Comparison of the triad motif distribution in model and data. Reproduced with permission from [6••].
Figure 3
Figure 3
Hierarchy of timescales in an anatomically-constrained dynamical model of macaque cortex. (A) Connections between 29 areas in the macaque cortex. Strong connections are indicated by lines, with line thickness determined by connection strength. (B) The number of spines on the basal dendrites of pyramidal cells in an area is strongly correlated with the area’s hierarchical position determined by the pattern of laminar projections. This is incorporated into the model, in which the excitation input strength is larger in areas higher in the hierarchy. (C) Stochastic activity fluctuations are fast in Area V1 but much slower in dorsolateral prefrontal cortex area 9/64d. (D) Autocorrelation functions in response to white-noise input to area V1, from which a dominant time constant was extracted for each cortical area. The model shows a hierarchy of timescales, with sensory areas and association areas characterized by short versus long timescales, respectively. Reproduced with permission from [11••].

Comment in

References

    1. Markov NT, Misery P, Falchier A, Lamy C, Vezoli J, Quilodran R, Gariel MA, Giroud P, Ercsey-Ravasz M, Pilaz LJ, Huissoud C, Barone P, Dehay C, Toroczkai Z, Van Essen DC, Kennedy H, Knoblauch K. Weight consistency specifies regularities of macaque cortical networks. Cereb Cortex. 2011;21:1254–1272. The study reports the first consistent, directed and weighted interareal cortical connectome for macaque, showing that weight heterogeneity and asymmetry are highly characteristic. - PMC - PubMed
    1. Markov NT, Ercsey-Ravasz M, Van Essen DC, Knoblauch K, Toroczkai Z, Kennedy H. Cortical high-density counterstream architectures. Science. 2013;342:1238406. - PMC - PubMed
    1. Ercsey-Ravasz M, Markov NT, Lamy C, Van Essen DC, Knoblauch K, Toroczkai Z, Kennedy H. A predictive network model of cerebral cortical connectivity based on a distance rule. Neuron. 2013;80:184–197. This study shows that the exponential decline of connection weight with distance is a distinctive feature of interareal connectivity and can be used to predict numerous local and global features including a core-periphery structure, global and local efficiency and wire minimization. - PMC - PubMed
    1. Oh SW, Harris JA, Ng L, Winslow B, Cain N, Mihalas S, Wang Q, Lau C, Kuan L, Henry AM, Mortrud MT, Ouellette B, Nguyen TN, Sorensen SA, Slaughterbeck CR, Wakeman W, Li Y, Feng D, Ho A, Nicholas E, Hirokawa KE, Bohn P, Joines KM, Peng H, Hawrylycz MJ, Phillips JW, Hohmann JG, Wohnoutka P, Gerfen CR, Koch C, Bernard A, Dang C, Jones AR, Zeng H. A mesoscale connectome of the mouse brain. Nature. 2014;508:207–214. The first report of the mouse whole-brain, cellular-level mesoscopic connectome, including the cortico-thalamic network. The authors used EGFP-expressing adeno-associated viral vectors to anterogradely trace axonal projections, and the connection weights were quantified by the intensity of EGFP-labeling of axons. - PMC - PubMed
    1. Zingg B, Hintiryan H, Gou L, Song MY, Bay M, Bienkowski MS, Foster NN, Yamashita S, Bowman I, Toga AW, Dong HW. Neural networks of the mouse neocortex. Cell. 2014;156:1096–1111. A comprehensive cortico-cortical connectome for the mouse, using both anterograde tracing and retrograde tracing. - PMC - PubMed

LinkOut - more resources