. 2017 Feb;37(2):471-484.
doi: 10.1177/0271678X16629977. Epub 2016 Jul 20.

Cerebral functional connectivity and Mayer waves in mice: Phenomena and separability

Affiliations

Cerebral functional connectivity and Mayer waves in mice: Phenomena and separability

Jonathan R Bumstead et al. J Cereb Blood Flow Metab. 2017 Feb.

Abstract

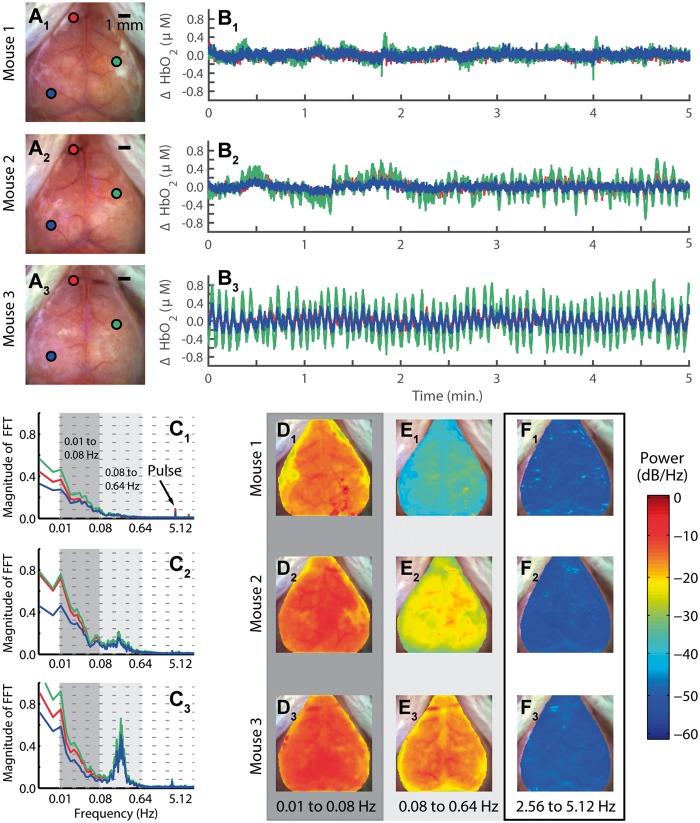
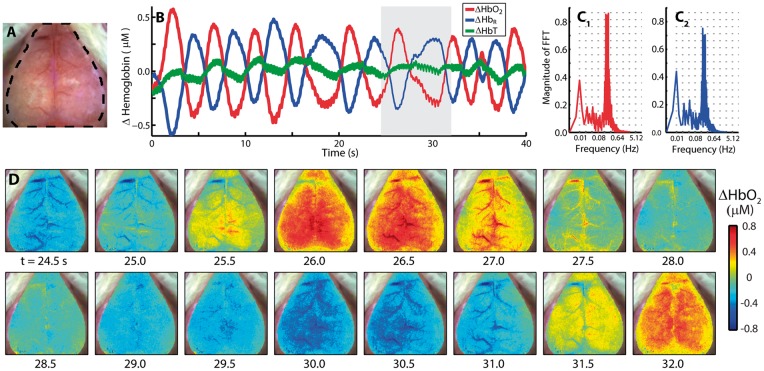
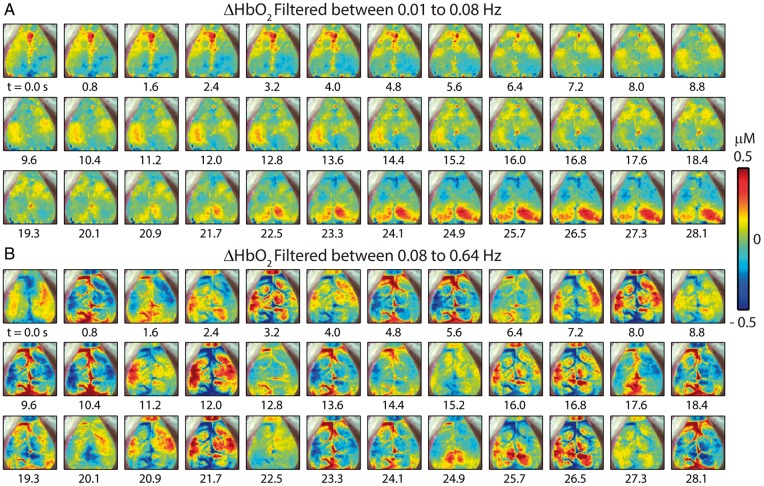
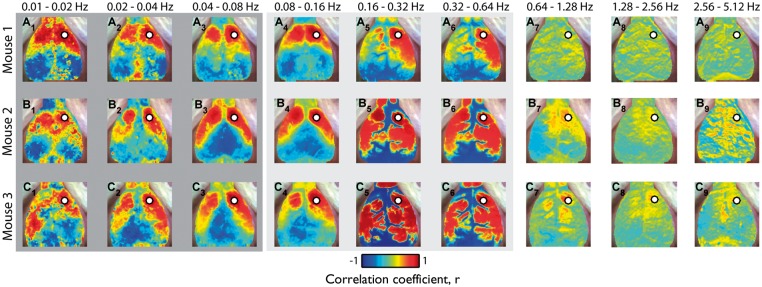
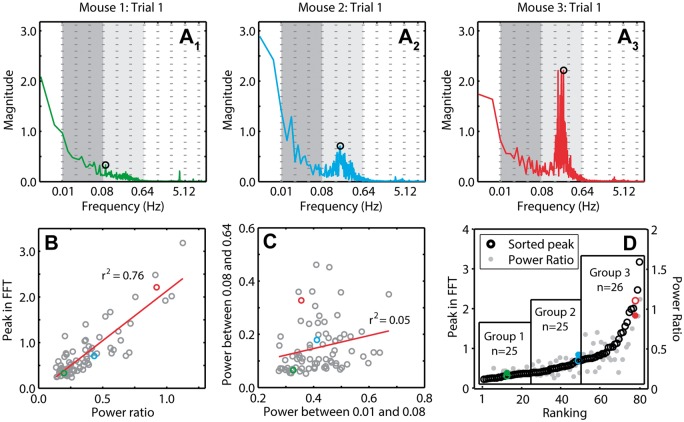
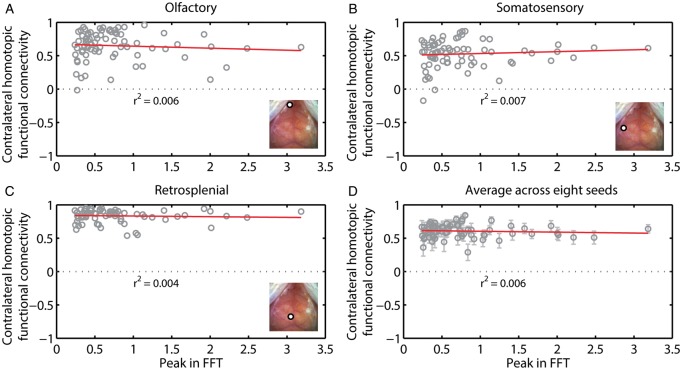
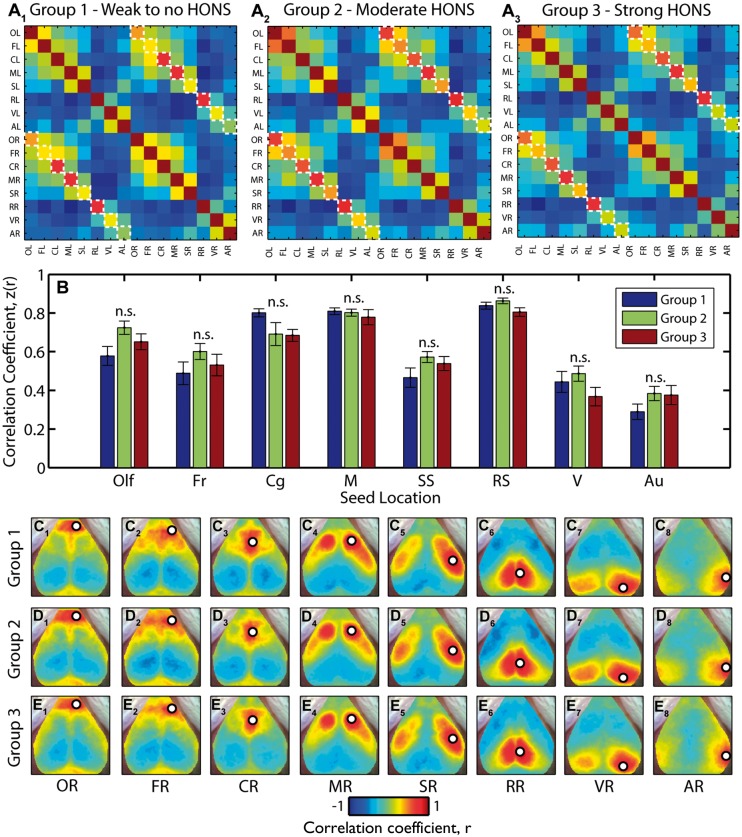
Resting-state functional connectivity is a growing neuroimaging approach that analyses the spatiotemporal structure of spontaneous brain activity, often using low-frequency (<0.08 Hz) hemodynamics. In addition to these fluctuations, there are two other low-frequency hemodynamic oscillations in a nearby spectral region (0.1-0.4 Hz) that have been reported in the brain: vasomotion and Mayer waves. Despite how close in frequency these phenomena exist, there is little research on how vasomotion and Mayer waves are related to or affect resting-state functional connectivity. In this study, we analyze spontaneous hemodynamic fluctuations over the mouse cortex using optical intrinsic signal imaging. We found spontaneous occurrence of oscillatory hemodynamics ∼0.2 Hz consistent with the properties of Mayer waves reported in the literature. Across a group of mice (n = 19), there was a large variability in the magnitude of Mayer waves. However, regardless of the magnitude of Mayer waves, functional connectivity patterns could be recovered from hemodynamic signals when filtered to the lower frequency band, 0.01-0.08 Hz. Our results demonstrate that both Mayer waves and resting-state functional connectivity patterns can co-exist simultaneously, and that they can be separated by applying bandpass filters.

Keywords: Brain imaging; cerebral hemodynamics; cortical mapping; intrinsic optical imaging; neurovascular coupling.


Figures

Figure 1.
Figure 1.
Measurements of low-frequency hemodynamics in mouse cortex reveal varying degrees of hemodynamic oscillations with narrow spectral width (HONS). (A) White light images of three mouse cortices (mice 1–3) with three points selected on each cortex. (B) ΔHbO2 traces of the three points selected in white light image of three mice shown in A. (C) Frequency spectra of traces shown in B. The frequency axis is on a log scale, but the labels are linear. The dark gray indicates the canonical bandwidth for functional connectivity analysis (0.01–0.08 Hz), and the light gray indicates the bandwidth in which HONS were found in some of the mice (0.08–0.64 Hz). (D) Spectral maps for 0.01 to 0.08 Hz (dark gray region in C). (E) Spectral maps for 0.08 to 0.64 Hz (light gray region in C). (F) Spectral maps for 2.56 to 5.12 Hz.
Figure 2.
Figure 2.
The spatiotemporal features of HONS. (A) White light image of Mouse 3 with dashed region indicating which part of image contained a cerebral hemodynamic signal. (B) Average ΔHbO2, ΔHbR, and ΔHbT traces for the entire region marked in A over 40 s. (C) FFT of ΔHbO2 (red) and ΔHbR (blue) traces shown in B. The spectral peak is at ∼0.2 Hz. The frequency axis is on a log scale, but the labels are linear. (D) A representative image sequence corresponding to gray region in B. The HONS propagate across the entire cortex.
Figure 3.
Figure 3.
Spatiotemporal patterns of ΔHbO2 filtered within different bandwidths with removal of the global signal (Mouse 3 in Figure 1). (A) Filtered between 0.01 and 0.08 Hz and resampled to 1.25 Hz. Spontaneous correlated activity in somatosensory and visual cortices is present during this 28-s epoch. (B) Filtering between 0.08 and 0.64 Hz, a bandwidth containing the distinct peak in the frequency spectrum. The spatiotemporal patterns vary dramatically from those in A.
Figure 4.
Figure 4.
Robustness of resting-state functional connectivity in the presence of HONS. (A) Correlation maps generated after filtering with nine different bandwidths with equal relative bandwidth ranging from 0.01 to 5.12 Hz for Mouse 1 (no HONS). Scale bar is for the Pearson correlation coefficient. (B) Same as A but for Mouse 2 (moderate HONS). (C) Same as A but for Mouse 3 (strong HONS). For all three mice, high correlations (r ≥ 0.8) were present in spatially confined regions of the cortex when hemodynamic traces were filtered over frequency bands less than the HONS frequency.
Figure 5.
Figure 5.
Quantifying and sorting the intensity of HONS in mouse cortex. (A) Averaged FFT for 5-min block of Mouse 1 (A1), Mouse 2 (A2), and Mouse 3 (A3). The peak in the spectrum within the bandwidth 0.08–0.64 Hz is marked. These spectra can be quantified by either measures of the peak magnitude or the ratio of the power in the HONS band (0.08–0.64 Hz) to the canonical RSFC band (0.01–0.08 Hz). The frequency axis is on a log scale, but the labels are linear. (B) Peak in the FFT within the HONS band plotted against the ratio of the power in the HONS band over the power in the RSFC band. The strong correlation indicates that both measures are congruent. (C) The power within the HONS band plotted against the power within the RSFC band. There is weak correlation between the power in these two bands, indicating separation between these two phenomena. (D) Results of sorting the 76 5-min blocks with respect to the peak in the HONS band (also plotted is the power ratio). Values for Mouse 1 are marked in green, Mouse 2 in blue, and Mouse 3 in red. From this sorting, three groups are specified and were used for group analyses.
Figure 6.
Figure 6.
Contralateral homotopic connectivity is not strongly correlated with the intensity of HONS. (A) Contralateral homotopic connectivity for olfactory seed measured after filtering ΔHbO2 data within the RSFC band is plotted against the intensity of HONS. Each point corresponds to a single 5-min block. There is weak correlation between the peak in the FFT and contralateral homotopic connectivity. Inset shows white light image with seed region specified. (B) Same as A but for somatosensory cortex. (C) Same as A but for retrosplenial cortex. (D) Average contralateral homotopic connectivity for eight brain regions (frontal, cingulate, motor, somatosensory, retrosplenial, visual, auditory, and olfactory) plotted against the intensity of HONS. R-squared value for linear fit of the data is also displayed. These results show that HONS do not affect the magnitude of correlation values when data are filtered between 0.01 and 0.08 Hz.
Figure 7.
Figure 7.
Functional connectivity brain networks across groups are not affected in mice with HONS. (A) Seed–seed correlation matrices for the three groups indicated in Figure 5. The results were generated after filtering ΔHbO2 data within the RSFC band. Contralateral homotopic functional connectivity values are marked with a white dashed line. (B) Z-scores for contralateral homotopic functional connectivity values for eight seeds for all three groups. There is no statistically significant difference in contralateral homotopic functional connectivity values across the three groups. Multiple comparisons corrected for using Benjamini and Hochberg’s FDR-controlling procedure (α = 0.05). (C) Correlation maps for right olfactory bulb (C1), frontal (C2), cingulate (C3), motor (C4), somatosensory (C5), retrosplenial (C6), visual (C7), and auditory (C8) cortices for blocks in group 1. (D) Same as C but for group 2. (E) Same as C but for group 3.

References

    1. De Luca M, Smith S, De Stefano N, et al. Blood oxygenation level dependent contrast resting state networks are relevant to functional activity in the neocortical sensorimotor system. Exper Brain Res 2005; 167: 587–594. - PubMed
    1. Biswal B, Yetkin FZ, Haughton VM, et al. Functional connectivity in the motor cortex of resting human brain using echo-planar MRI. Magn Reson Med 1995; 34: 537–541. - PubMed
    1. Vincent JL, Patel GH, Fox MD, et al. Intrinsic functional architecture in the anaesthetized monkey brain. Nature 2007; 447: 83–86. - PubMed
    1. Pawela CP, Biswal BB, Cho YR, et al. Resting-state functional connectivity of the rat brain. Magn Reson Med 2008; 59: 1021–1029. - PMC - PubMed
    1. White BR, Bauer AQ, Snyder AZ, et al. Imaging of functional connectivity in the mouse brain. PloS One 2011; 6: e16322. - PMC - PubMed

LinkOut - more resources