

Haploinsufficiency of the Insulin Receptor in the Presence of a Splice-Site Mutation in Ppp2r2a Results in a Novel Digenic Mouse Model of Type 2 Diabetes
- PMID: 26868295
- PMCID: PMC5947768
- DOI: 10.2337/db15-1276
Haploinsufficiency of the Insulin Receptor in the Presence of a Splice-Site Mutation in Ppp2r2a Results in a Novel Digenic Mouse Model of Type 2 Diabetes
Abstract
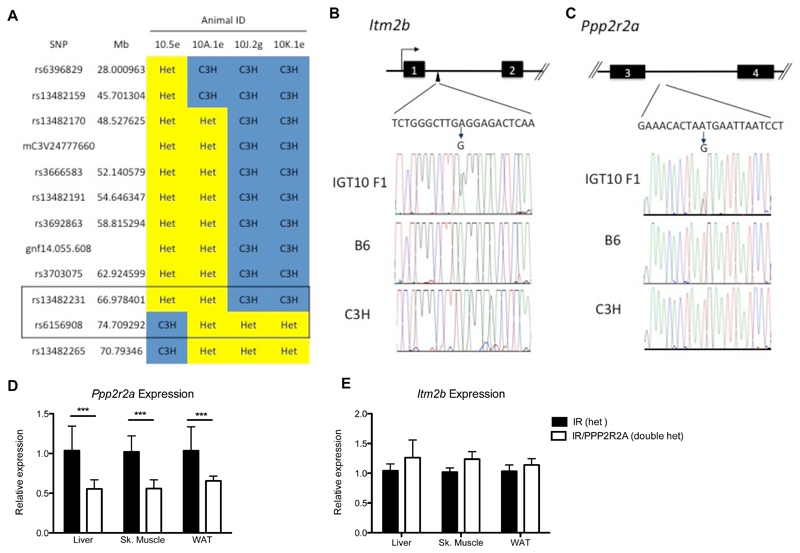
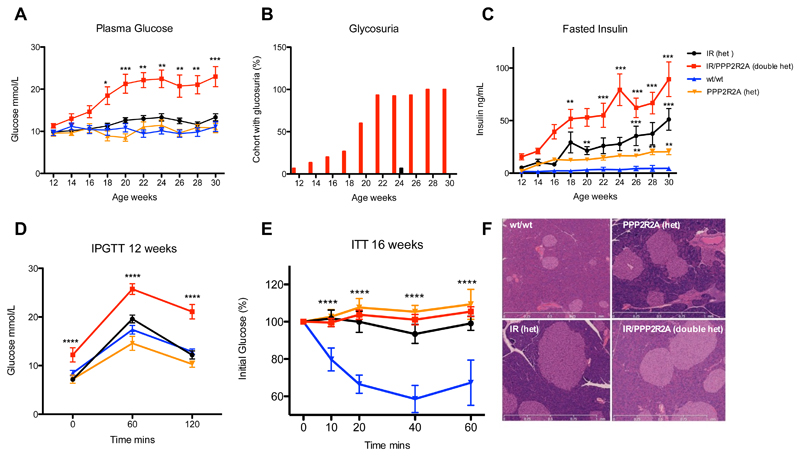
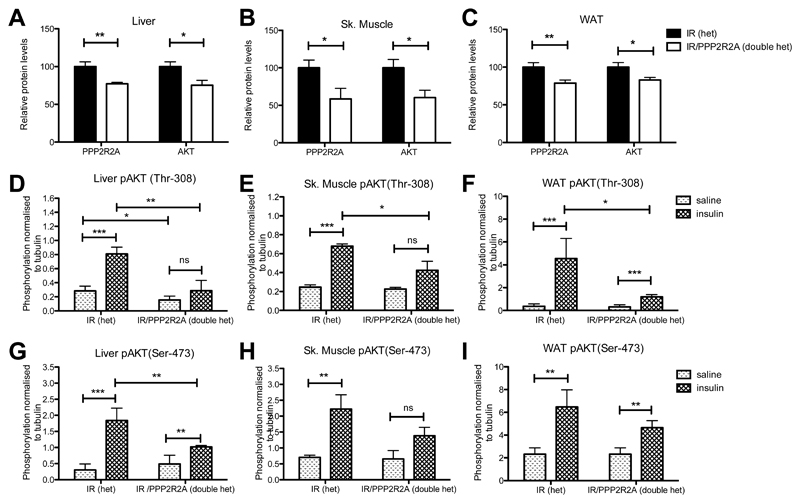
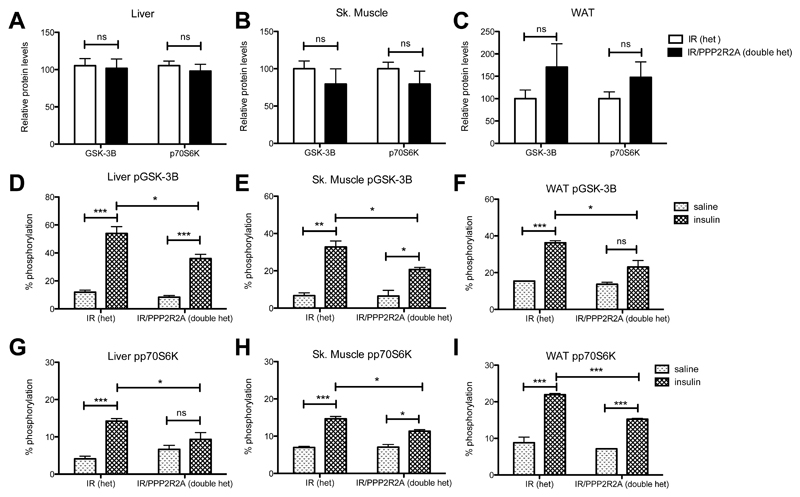
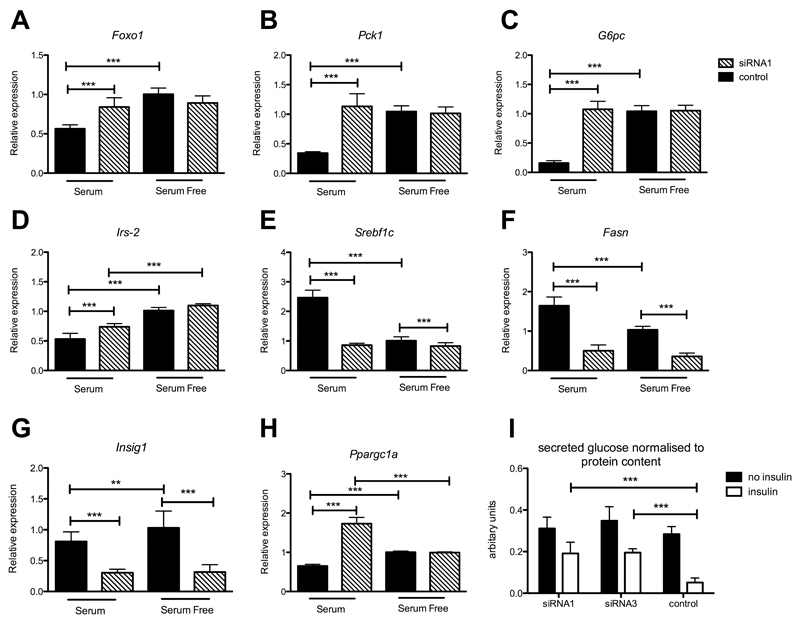
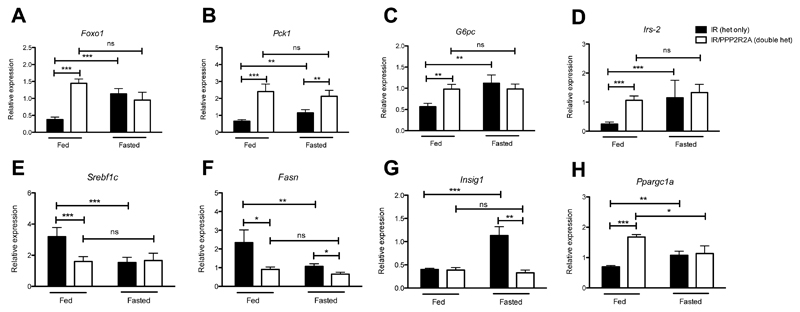
Insulin resistance in mice typically does not manifest as diabetes due to multiple compensatory mechanisms. Here, we present a novel digenic model of type 2 diabetes in mice heterozygous for a null allele of the insulin receptor and an N-ethyl-N-nitrosourea-induced alternative splice mutation in the regulatory protein phosphatase 2A (PP2A) subunit PPP2R2A. Inheritance of either allele independently results in insulin resistance but not overt diabetes. Doubly heterozygous mice exhibit progressive hyperglycemia, hyperinsulinemia, and impaired glucose tolerance from 12 weeks of age without significant increase in body weight. Alternative splicing of Ppp2r2a decreased PPP2R2A protein levels. This reduction in PPP2R2A containing PP2A phosphatase holoenzyme was associated with decreased serine/threonine protein kinase AKT protein levels. Ultimately, reduced insulin-stimulated phosphorylated AKT levels were observed, a result that was confirmed in Hepa1-6, C2C12, and differentiated 3T3-L1 cells knocked down using Ppp2r2a small interfering RNAs. Altered AKT signaling and expression of gluconeogenic genes in the fed state contributed to an insulin resistance and hyperglycemia phenotype. This model demonstrates how genetic changes with individually small phenotypic effects interact to cause diabetes and how differences in expression of hypomorphic alleles of PPP2R2A and potentially other regulatory proteins have deleterious effects and may therefore be relevant in determining diabetes risk.
© 2016 by the American Diabetes Association. Readers may use this article as long as the work is properly cited, the use is educational and not for profit, and the work is not altered.
Conflict of interest statement
Figures
Comment in
-
Comment on Goldsworthy et al. Haploinsufficiency of the Insulin Receptor in the Presence of a Splice-Site Mutation in Ppp2r2a Results in a Novel Digenic Mouse Model of Type 2 Diabetes. Diabetes 2016;65:1434-1446.Diabetes. 2016 Jun;65(6):e22-3. doi: 10.2337/db16-0249. Diabetes. 2016. PMID: 27222400 No abstract available.
Similar articles
-
Comment on Goldsworthy et al. Haploinsufficiency of the Insulin Receptor in the Presence of a Splice-Site Mutation in Ppp2r2a Results in a Novel Digenic Mouse Model of Type 2 Diabetes. Diabetes 2016;65:1434-1446.Diabetes. 2016 Jun;65(6):e22-3. doi: 10.2337/db16-0249. Diabetes. 2016. PMID: 27222400 No abstract available.
-
Reduced expression of the murine p85alpha subunit of phosphoinositide 3-kinase improves insulin signaling and ameliorates diabetes.J Clin Invest. 2002 Jan;109(1):141-9. doi: 10.1172/JCI13305. J Clin Invest. 2002. PMID: 11781359 Free PMC article.
-
Reduced glucose uptake precedes insulin signaling defects in adipocytes from heterozygous GLUT4 knockout mice.FASEB J. 2000 Jun;14(9):1117-25. doi: 10.1096/fasebj.14.9.1117. FASEB J. 2000. PMID: 10834933
-
Metabolism and insulin signaling in common metabolic disorders and inherited insulin resistance.Dan Med J. 2014 Jul;61(7):B4890. Dan Med J. 2014. PMID: 25123125 Review.
-
Mutations in insulin-receptor gene in insulin-resistant patients.Diabetes Care. 1990 Mar;13(3):257-79. doi: 10.2337/diacare.13.3.257. Diabetes Care. 1990. PMID: 1968373 Review.
Cited by
-
Ppp2r2a Knockout Mice Reveal That Protein Phosphatase 2A Regulatory Subunit, PP2A-B55α, Is an Essential Regulator of Neuronal and Epidermal Embryonic Development.Front Cell Dev Biol. 2020 Jun 5;8:358. doi: 10.3389/fcell.2020.00358. eCollection 2020. Front Cell Dev Biol. 2020. PMID: 32582689 Free PMC article.
-
Targeting protein modifications in metabolic diseases: molecular mechanisms and targeted therapies.Signal Transduct Target Ther. 2023 May 27;8(1):220. doi: 10.1038/s41392-023-01439-y. Signal Transduct Target Ther. 2023. PMID: 37244925 Free PMC article. Review.
-
The MASTL/PP2A cell cycle kinase-phosphatase module restrains PI3K-Akt activity in an mTORC1-dependent manner.EMBO J. 2023 Jan 16;42(2):e110833. doi: 10.15252/embj.2022110833. Epub 2022 Nov 10. EMBO J. 2023. PMID: 36354735 Free PMC article.
-
Identification and Validation of miR-222-3p and miR-409-3p as Plasma Biomarkers in Gestational Diabetes Mellitus Sharing Validated Target Genes Involved in Metabolic Homeostasis.Int J Mol Sci. 2022 Apr 12;23(8):4276. doi: 10.3390/ijms23084276. Int J Mol Sci. 2022. PMID: 35457094 Free PMC article.
-
Identification of key DNA methylation changes on fasting plasma glucose: a genome-wide DNA methylation analysis in Chinese monozygotic twins.Diabetol Metab Syndr. 2023 Jul 17;15(1):159. doi: 10.1186/s13098-023-01136-4. Diabetol Metab Syndr. 2023. PMID: 37461060 Free PMC article.
References
-
- Savage DB, Agostini M, Barroso I, Gurnell M, Luan J, Meirhaeghe A, Harding AH, Ihrke G, Rajanayagam O, Soos MA, George S, et al. Digenic inheritance of severe insulin resistance in a human pedigree. Nat Genet. 2002;31:379–384. - PubMed
-
- Suliman SG, Stanik J, McCulloch LJ, Wilson N, Edghill EL, Misovicova N, Gasperikova D, Sandrikova V, Elliott KS, Barak L, Ellard S, et al. Severe insulin resistance and intrauterine growth deficiency associated with haploinsufficiency for INSR and CHN2: new insights into synergistic pathways involved in growth and metabolism. Diabetes. 2009;58:2954–2961. - PMC - PubMed
-
- Bruning JC, Winnay J, Bonner-Weir S, Taylor SI, Accili D, Kahn CR. Development of a novel polygenic model of NIDDM in mice heterozygous for IR and IRS-1 null alleles. Cell. 1997;88:561–572. - PubMed
-
- Taniguchi CM, Emanuelli B, Kahn CR. Critical nodes in signalling pathways: insights into insulin action. Nat Rev Mol Cell Bio. 2006;7:85–96. - PubMed
Publication types
MeSH terms
Substances
Grants and funding
LinkOut - more resources
Full Text Sources
Other Literature Sources
Medical
Molecular Biology Databases
