. 2016 Feb 12:7:10635.
doi: 10.1038/ncomms10635.

A variant at 9p21.3 functionally implicates CDKN2B in paediatric B-cell precursor acute lymphoblastic leukaemia aetiology

Affiliations

A variant at 9p21.3 functionally implicates CDKN2B in paediatric B-cell precursor acute lymphoblastic leukaemia aetiology

Eric A Hungate et al. Nat Commun. .

Abstract

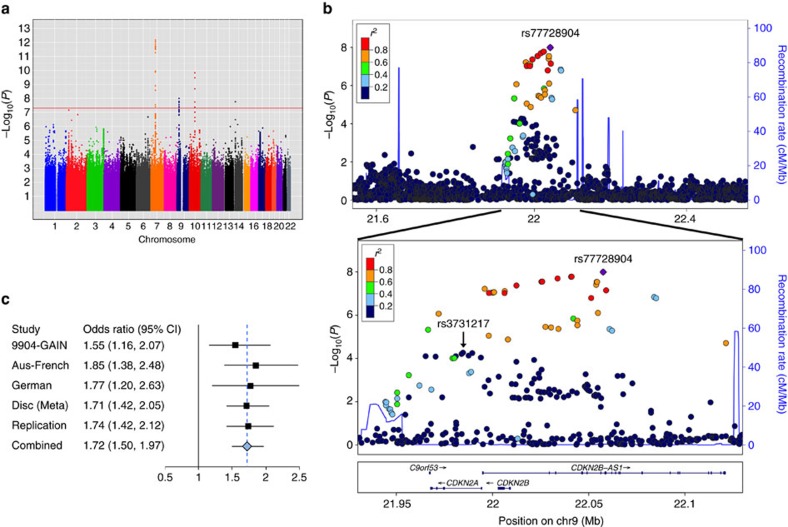
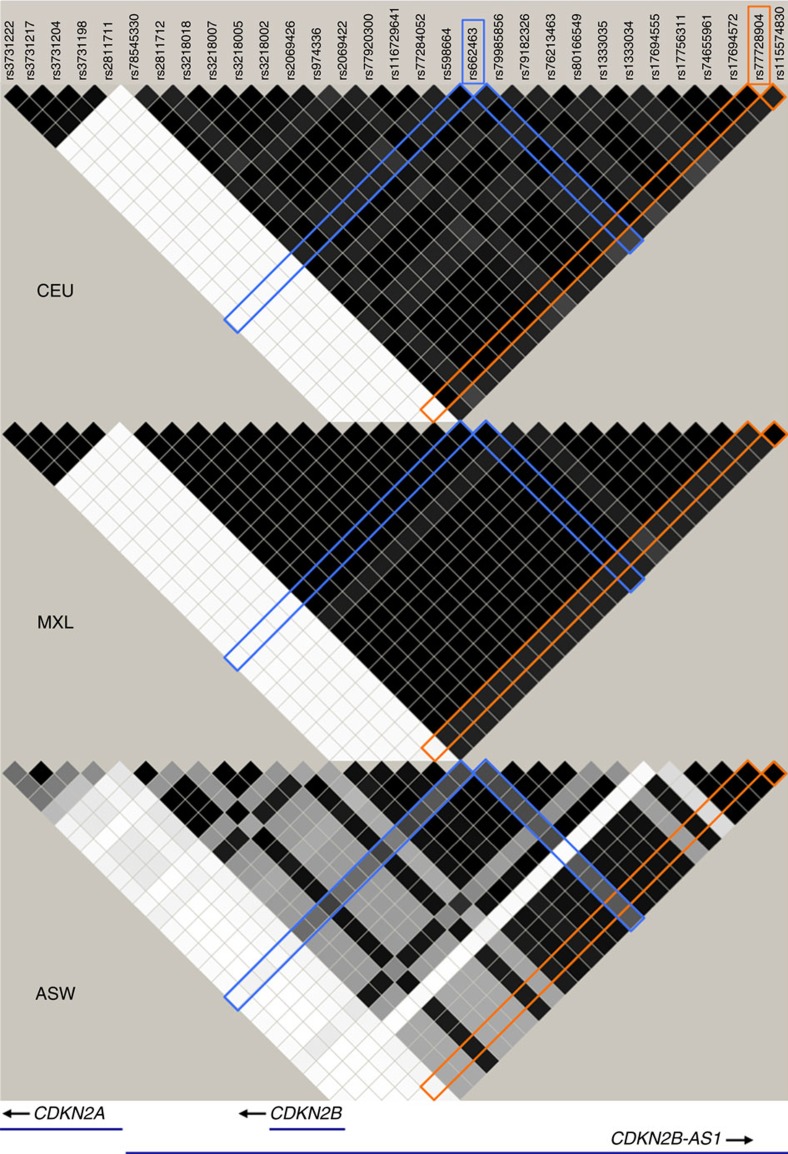
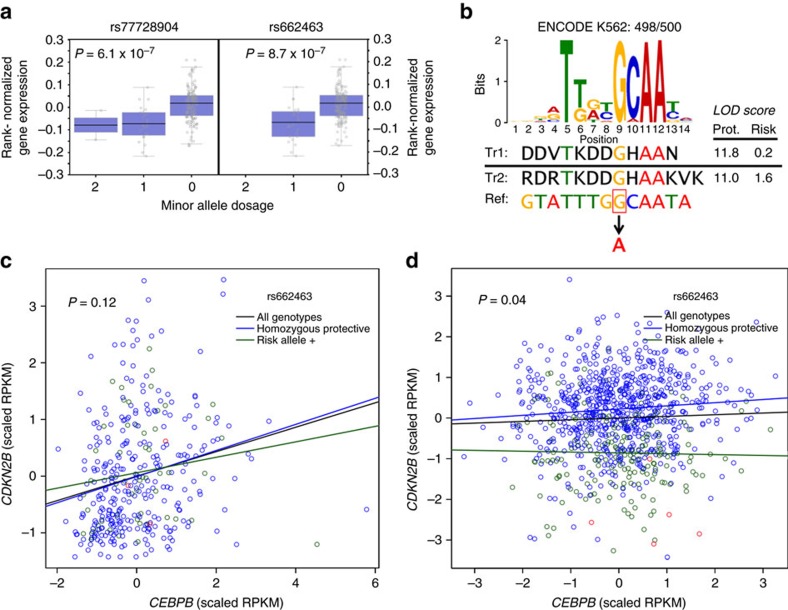
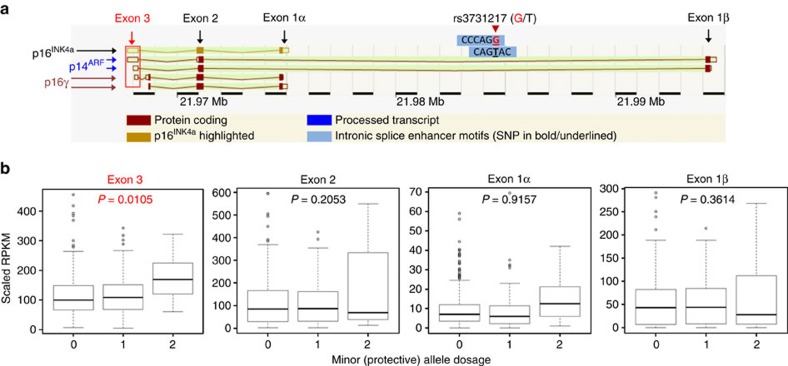
Paediatric B-cell precursor acute lymphoblastic leukaemia (BCP-ALL) is the most common cancer of childhood, yet little is known about BCP-ALL predisposition. In this study, in 2,187 cases of European ancestry and 5,543 controls, we discover and replicate a locus indexed by rs77728904 at 9p21.3 associated with BCP-ALL susceptibility (Pcombined=3.32 × 10(-15), OR=1.72) and independent from rs3731217, the previously reported ALL-associated variant in this region. Of correlated SNPs tagged by this locus, only rs662463 is significant in African Americans, suggesting it is a plausible causative variant. Functional analysis shows that rs662463 is a cis-eQTL for CDKN2B, with the risk allele associated with lower expression, and suggests that rs662463 influences BCP-ALL risk by regulating CDKN2B expression through CEBPB signalling. Functional analysis of rs3731217 suggests it is associated with BCP-ALL by acting within a splicing regulatory element determining CDKN2A exon 3 usage (P=0.01). These findings provide new insights into the critical role of the CDKN2 locus in BCP-ALL aetiology.


Figures

Figure 1
Figure 1. Meta-analysis results for paediatric BCP-ALL.
(a) Manhattan plot of associations for the discovery GWAS of 1,210 cases and 4,144 controls from four independent studies. The red line denotes the threshold for genome-wide significance. Peaks surpassing this threshold are found at the following: 7p12.2 (IKZF1), 10q21.2 (ARID5B) and 9p21.3 (CDKN2). (b) The top panel is the regional LocusZoom plot of the 9p21.3 locus extending 500 kb on either side of the index SNP, rs77728904 (shown in purple), and including all genotyped and imputed SNPs with MAF >0.01. The bottom panel is zoomed in (indicated by the solid black lines between plots) to include only the CDKN2 locus and surrounding recombination peaks. The r2 (visualized by colour) demonstrates that rs77728904 and rs3731217 are in independent linkage blocks between the recombination peaks. r2 for all SNPs in both panels is shown relative to rs77728904. (c) Forest plot of OR with 95% confidence intervals (CIs) for rs77728904 in each of the studies comprising the discovery meta-analysis (Disc (Meta)), the full meta-analysis, the replication analysis and the combined analysis. Squares represent the OR; horizontal lines represent the CI; the solid vertical line represents OR=1; the blue dashed vertical line represents the OR in the combined discovery+replication sets.
Figure 2
Figure 2. Haploview LD map of the 9p21.3 locus showing differences in the LD structure by ancestry in 1,000 Genomes Phase 1 populations.
LD is reported as r2 with r2=0.01 white; 0.01<r2<1 shades of grey; r2=1 black. ASW, African American ancestry; CEU, European ancestry; MXL, Hispanic ancestry. rs77728904 is highlighted in orange and rs662463 is highlighted in blue.
Figure 3
Figure 3. Multi-ethnic and functional analysis suggesting rs662463 is the causative BCP-ALL SNP tagged by the rs77728904-defined locus.
(a) eQTL analysis from GTEx in whole blood showing the association of CDKN2B expression with rs77728904 and rs662463 genotypes. For both SNPs, the minor allele is the risk allele. Each grey circle represents an individual. Each box plot shows the median rank normalized gene expression (black horizontal line), the first through third quartiles (purple box) and 1.5 × the interquartile range (whiskers). (b) Motifs derived from ChIP data showing the effect of rs662463 on CEBPB binding. The genomic sequence (Ref) surrounding rs662463 is shown below the CEBPB-binding site motif logo for K562 cells from Factorbook, with the reference protective G-allele boxed and the risk A-allele in red. The CEBPB motif logo represents the position weight matrix (PWM) for each base. The PWM LOD scores calculated by HaploReg from TRANSFAC for two CEBPB-binding motifs (‘Tr1' or TRANSFAC accession M00912 and ‘Tr2' or TRANSFAC accession M00109) including either the protective or the risk allele of rs662463 demonstrate that the risk allele disrupts CEBPB binding. (c) RNA-seq analysis in European ancestry LCLs, suggesting that the rs662463 genotype influences the correlation between CDKN2B and CEBPB expression, and that the rs662463 risk allele is associated with lower CDKN2B expression. Shown are the best-fit lines overall (black line), for LCLs homozygous for the protective allele (blue line) and for LCLs with at least one copy (one copy: green circles and two copies: red circles) of the risk allele (green line). (d) RNA-seq analysis in whole blood from an independent set of European ancestry individuals, demonstrating that the rs662463 genotype significantly influences the correlation between CDKN2B and CEBPB expression. The rs662463 risk allele attenuates this correlation and is associated with lower CDKN2B expression. Shown are the best-fit lines overall (black line), for individuals homozygous for the protective allele (blue line) and for individuals with at least one copy (one copy: green circles and two copies: red circles) of the risk allele (green line).
Figure 4
Figure 4. Functional analysis demonstrating rs3731217 is associated with CDKN2A exon 3 usage.
(a) Cartoon showing the major protein isoforms encoded by CDKN2A: p14ARF (blue arrows), p16γ (red arrows) and p16INK4a (black arrow). The four main exons are labelled with exon 3 surrounded by a red box. rs3731217 is located in two overlapping intronic splicing elements between exon 1α and exon 1β. The image is modified from AceView. (b) RNA-seq data from LCLs correlating exon usage with rs3731217 genotype showing that exon 3 usage is significantly associated with the protective G-allele (0, 1 and 2 on the x axis refer to G-allele dosage). Each box plot shows the median rank normalized gene expression (black horizontal line), the first through third quartiles (box) and 1.5 × the interquartile range (whiskers).

References

    1. Mullighan C. G. Molecular genetics of B-precursor acute lymphoblastic leukemia. J. Clin. Invest. 122, 3407–3415 (2012). - PMC - PubMed
    1. Cazzaniga G. et al.. Developmental origins and impact of BCR-ABL1 fusion and IKZF1 deletions in monozygotic twins with Ph+ acute lymphoblastic leukemia. Blood 118, 5559–5564 (2011). - PMC - PubMed
    1. van der Weyden L. et al.. Modeling the evolution of ETV6-RUNX1-induced B-cell precursor acute lymphoblastic leukemia in mice. Blood 118, 1041–1051 (2011). - PMC - PubMed
    1. Enciso-Mora V. et al.. Common genetic variation contributes significantly to the risk of childhood B-cell precursor acute lymphoblastic leukemia. Leukemia 26, 2212–2215 (2012). - PubMed
    1. Trevino L. R. et al.. Germline genomic variants associated with childhood acute lymphoblastic leukemia. Nat. Genet. 41, 1001–1005 (2009). - PMC - PubMed

Publication types

Substances