

Phosphorylation Regulates Functions of ZEB1 Transcription Factor
- PMID: 26868487
- PMCID: PMC5902805
- DOI: 10.1002/jcp.25338
Phosphorylation Regulates Functions of ZEB1 Transcription Factor
Abstract
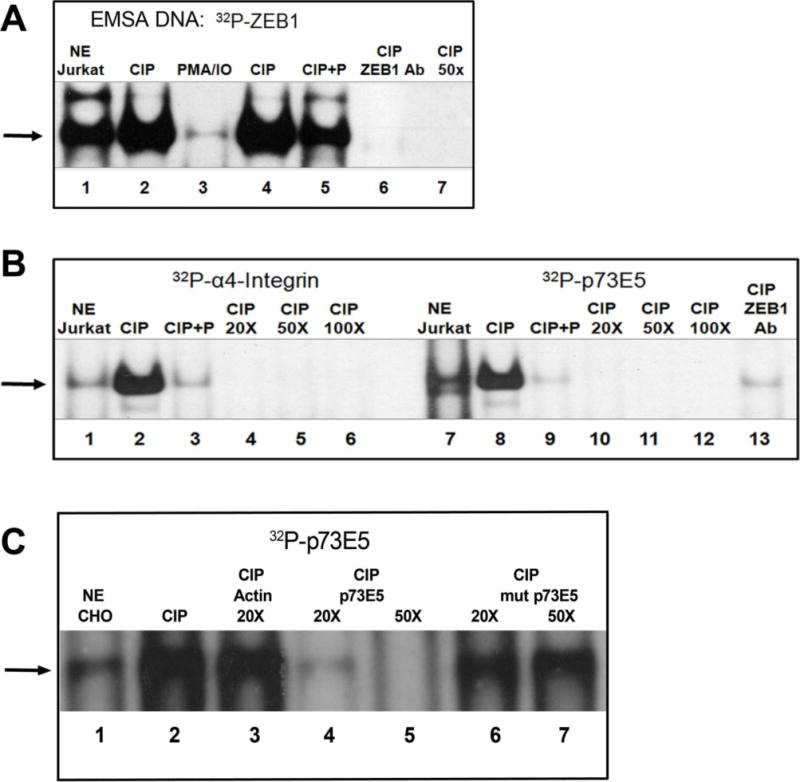
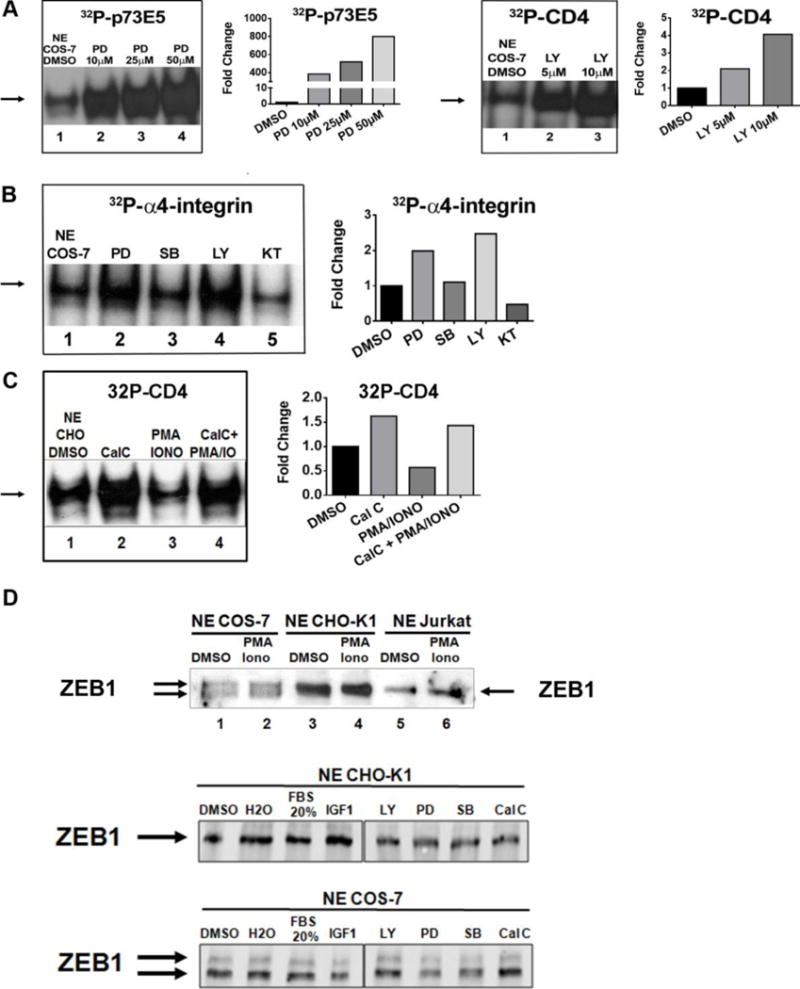
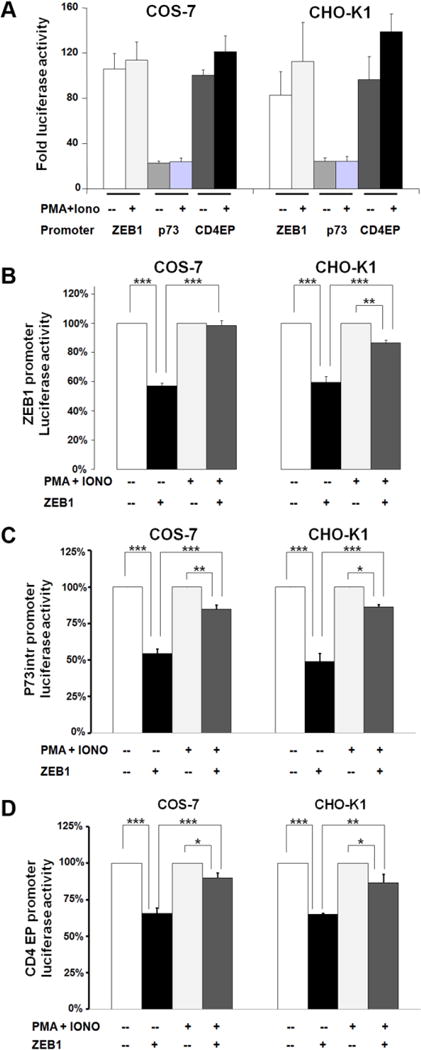
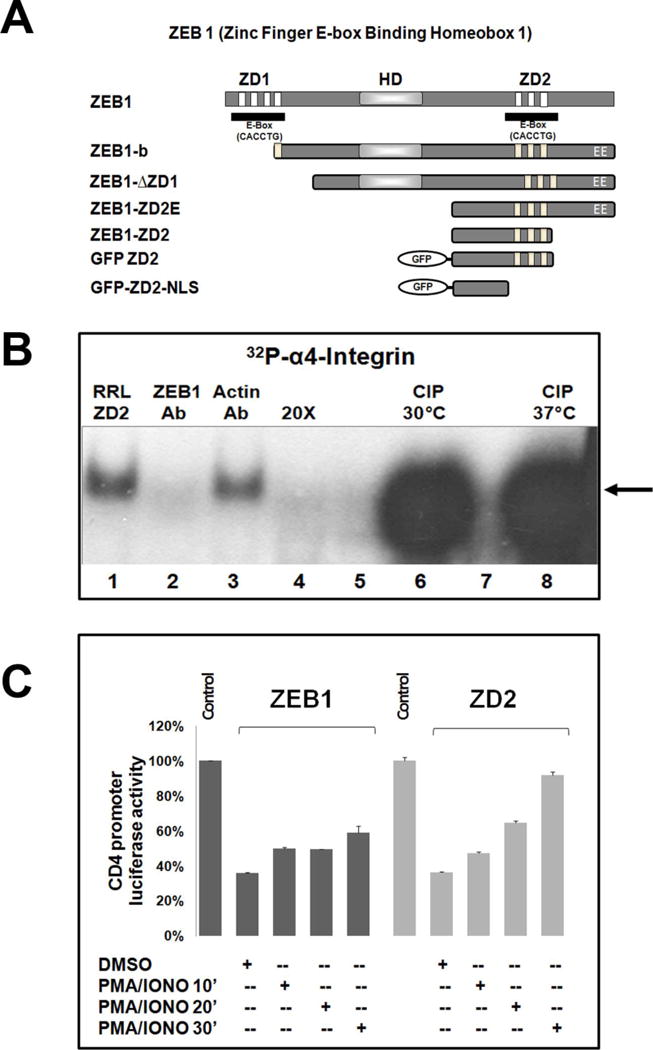
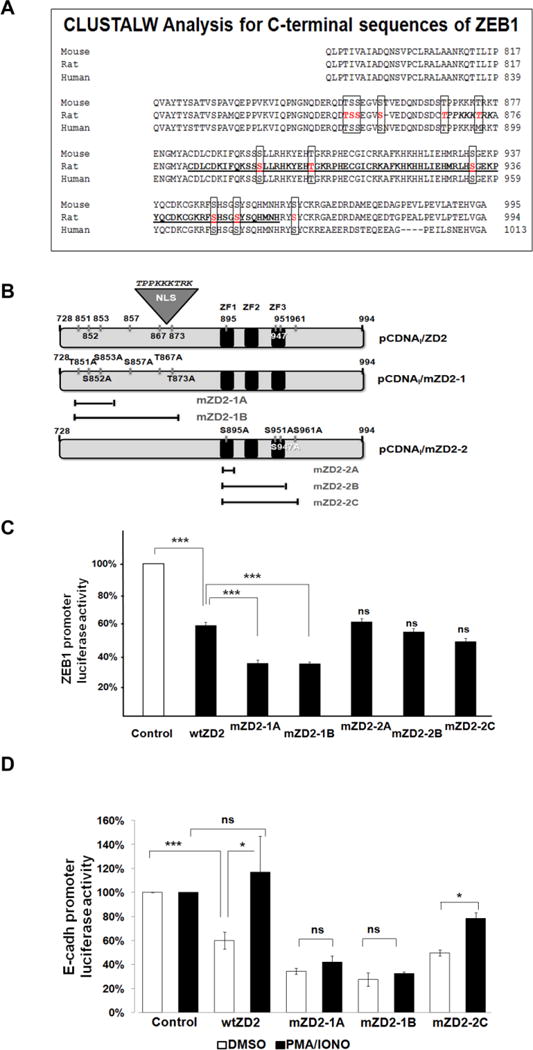
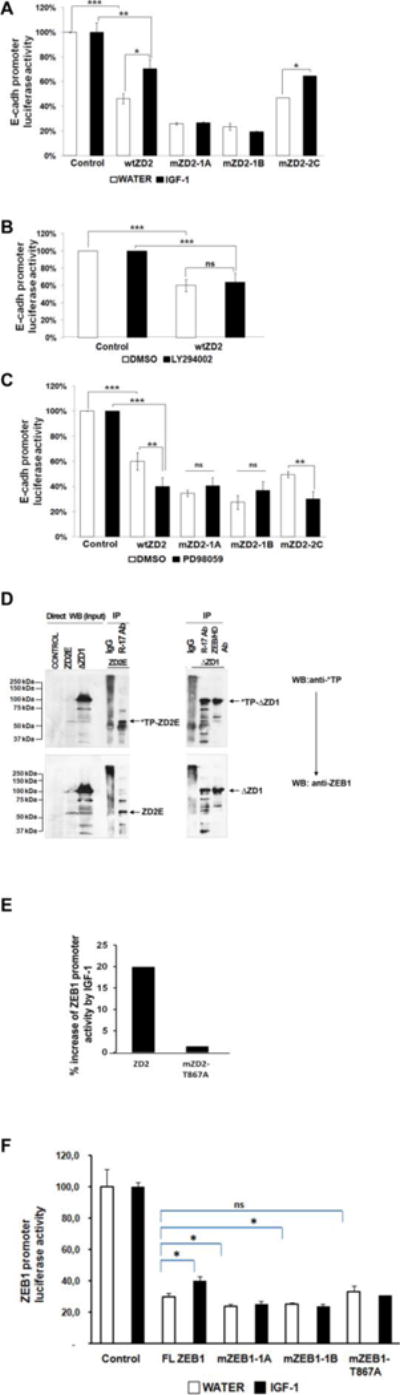
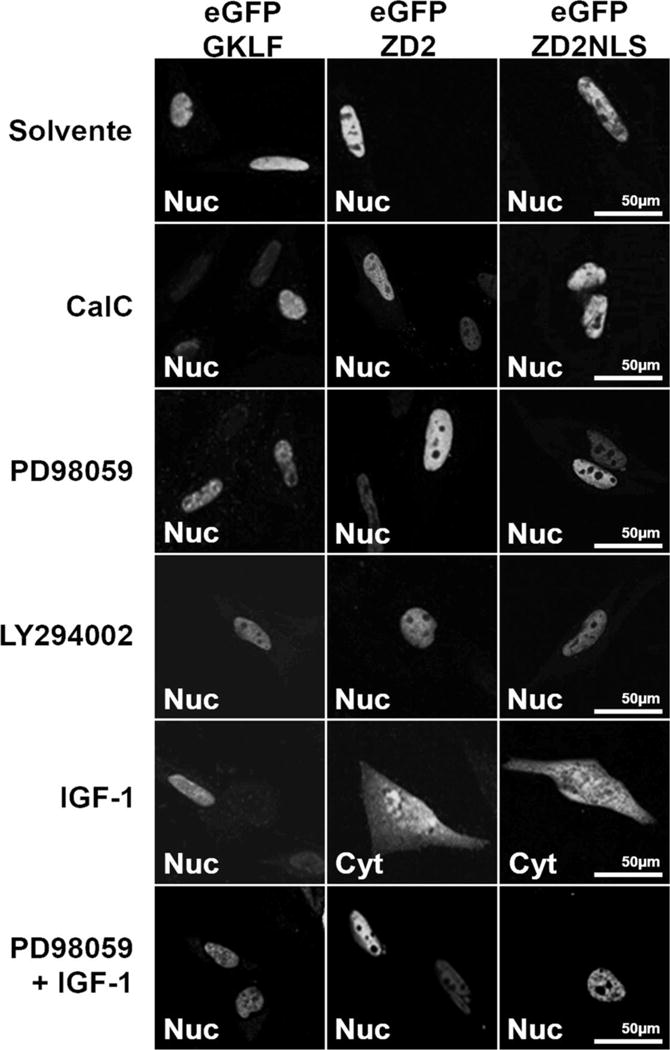
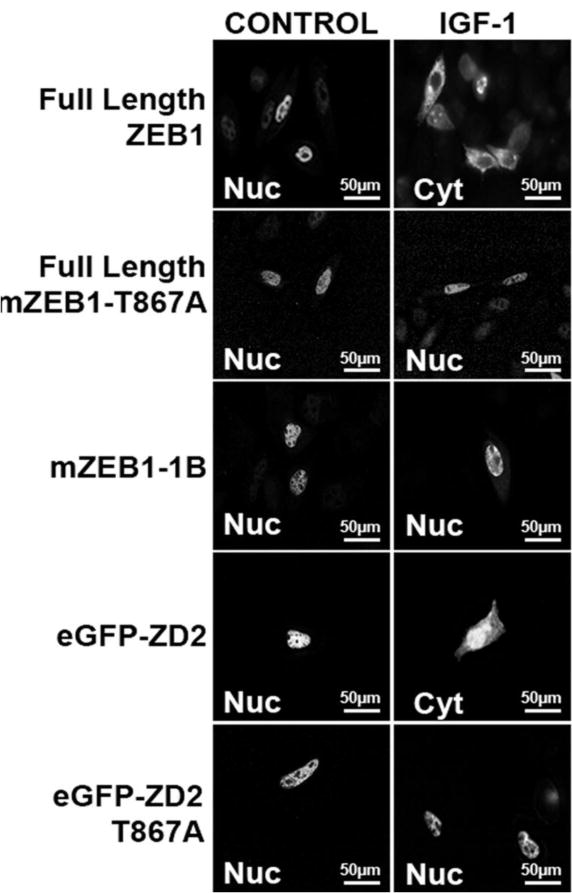
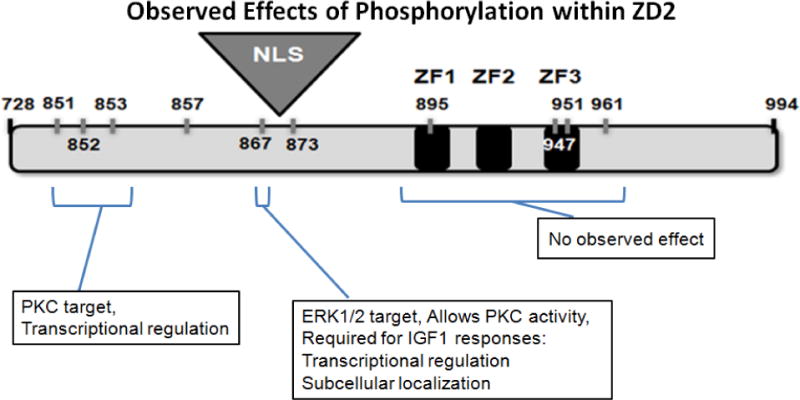
ZEB1 transcription factor is important in both development and disease, including many TGFβ-induced responses, and the epithelial-to-mesenchymal transition (EMT) by which many tumors undergo metastasis. ZEB1 is differentially phosphorylated in different cell types; however the role of phosphorylation in ZEB1 activity is unknown. Luciferase reporter studies and electrophoresis mobility shift assays (EMSA) show that a decrease in phosphorylation of ZEB1 increases both DNA-binding and transcriptional repression of ZEB1 target genes. Functional analysis of ZEB1 phosphorylation site mutants near the second zinc finger domain (termed ZD2) show that increased phosphorylation (due to either PMA plus ionomycin, or IGF-1) can inhibit transcriptional repression by either a ZEB1-ZD2 domain clone, or full-length ZEB1. This approach identifies phosphosites that have a substantial effect regulating the transcriptional and DNA-binding activity of ZEB1. Immunoprecipitation with anti-ZEB1 antibodies followed by western analysis with a phospho-Threonine-Proline-specific antibody indicates that the ERK consensus site at Thr-867 is phosphorylated in ZEB1. In addition to disrupting in vitro DNA-binding measured by EMSA, IGF-1-induced MEK/ERK phosphorylation is sufficient to disrupt nuclear localization of GFP-ZEB1 fusion clones. These data suggest that phosphorylation of ZEB1 integrates TGFβ signaling with other signaling pathways such as IGF-1. J. Cell. Physiol. 231: 2205-2217, 2016. © 2016 Wiley Periodicals, Inc.
© 2016 Wiley Periodicals, Inc.
Conflict of interest statement
The authors have no conflicts of interest.
Figures
Similar articles
-
USP10 Regulates ZEB1 Ubiquitination and Protein Stability to Inhibit ZEB1-Mediated Colorectal Cancer Metastasis.Mol Cancer Res. 2023 Jun 1;21(6):578-590. doi: 10.1158/1541-7786.MCR-22-0552. Mol Cancer Res. 2023. PMID: 36940483 Free PMC article.
-
Src promotes EGF-induced epithelial-to-mesenchymal transition and migration in gastric cancer cells by upregulating ZEB1 and ZEB2 through AKT.Cell Biol Int. 2018 Mar;42(3):294-302. doi: 10.1002/cbin.10894. Epub 2017 Nov 15. Cell Biol Int. 2018. PMID: 29052277
-
MiR-186-5p upregulation inhibits proliferation, metastasis and epithelial-to-mesenchymal transition of colorectal cancer cell by targeting ZEB1.Arch Biochem Biophys. 2018 Feb 15;640:53-60. doi: 10.1016/j.abb.2018.01.002. Epub 2018 Jan 8. Arch Biochem Biophys. 2018. PMID: 29325758
-
SHP-2-upregulated ZEB1 is important for PDGFRα-driven glioma epithelial-mesenchymal transition and invasion in mice and humans.Oncogene. 2016 Oct 27;35(43):5641-5652. doi: 10.1038/onc.2016.100. Epub 2016 Apr 4. Oncogene. 2016. PMID: 27041571 Free PMC article.
-
Tumor suppressor miR-128-3p inhibits metastasis and epithelial-mesenchymal transition by targeting ZEB1 in esophageal squamous-cell cancer.Acta Biochim Biophys Sin (Shanghai). 2018 Feb 1;50(2):171-180. doi: 10.1093/abbs/gmx132. Acta Biochim Biophys Sin (Shanghai). 2018. PMID: 29329360
Cited by
-
Epithelial-Mesenchymal Transition by Synergy between Transforming Growth Factor-β and Growth Factors in Cancer Progression.Diagnostics (Basel). 2022 Sep 1;12(9):2127. doi: 10.3390/diagnostics12092127. Diagnostics (Basel). 2022. PMID: 36140527 Free PMC article. Review.
-
The Scribble-SGEF-Dlg1 complex regulates E-cadherin and ZO-1 stability, turnover and transcription in epithelial cells.J Cell Sci. 2024 Oct 1;137(19):jcs262181. doi: 10.1242/jcs.262181. Epub 2024 Oct 14. J Cell Sci. 2024. PMID: 39350674
-
Epithelial-mesenchymal transition: The history, regulatory mechanism, and cancer therapeutic opportunities.MedComm (2020). 2022 May 18;3(2):e144. doi: 10.1002/mco2.144. eCollection 2022 Jun. MedComm (2020). 2022. PMID: 35601657 Free PMC article. Review.
-
Detection of zeb1 Gene in Granulosa Cells in Women Undergoing IVF Treatment.J Clin Med. 2023 Aug 30;12(17):5652. doi: 10.3390/jcm12175652. J Clin Med. 2023. PMID: 37685721 Free PMC article.
-
USP10 Regulates ZEB1 Ubiquitination and Protein Stability to Inhibit ZEB1-Mediated Colorectal Cancer Metastasis.Mol Cancer Res. 2023 Jun 1;21(6):578-590. doi: 10.1158/1541-7786.MCR-22-0552. Mol Cancer Res. 2023. PMID: 36940483 Free PMC article.
References
-
- Blom N, Sicheritz-Ponten T, Gupta R, Gammeltoft S, Brunak S. Prediction of post-translational glycosylation and phosphorylation of proteins from the amino acid sequence. Proteomics. 2004;4(6):1633–1649. - PubMed
-
- Brabletz T, Jung A, Hlubek F, Lohberg C, Meiler J, Suchy U, Kirchner T. Negative regulation of CD4 expression in T cells by the transcriptional repressor ZEB. Int Immunol. 1999;11(10):1701–1708. - PubMed
-
- Broege AM, Anose BM, Sanders MM. Regulating the expression of the ZEB1 transcription factor in health and disease. Current Trends in Endocrinology. 2011;5:75–91.
-
- Buchner K. The role of protein kinase C in the regulation of cell growth and in signalling to the cell nucleus. J Cancer Res Clin Oncol. 2000;126(1):1–11. - PubMed
-
- Cabanillas A, Smith G, Darling D. T3-activation of the rat growth hormone gene is inhibited by a zinc finger/homeodomain protein. Mol Cell Endocrinol. 2001;181(1–2):131–137. - PubMed
Publication types
MeSH terms
Substances
Grants and funding
LinkOut - more resources
Full Text Sources
Other Literature Sources
Molecular Biology Databases
Miscellaneous
