

Range Measurement and a Habitat Suitability Map for the Norway Rat in a Highly Developed Urban Environment
- PMID: 26868708
- PMCID: PMC4729406
Range Measurement and a Habitat Suitability Map for the Norway Rat in a Highly Developed Urban Environment
Abstract
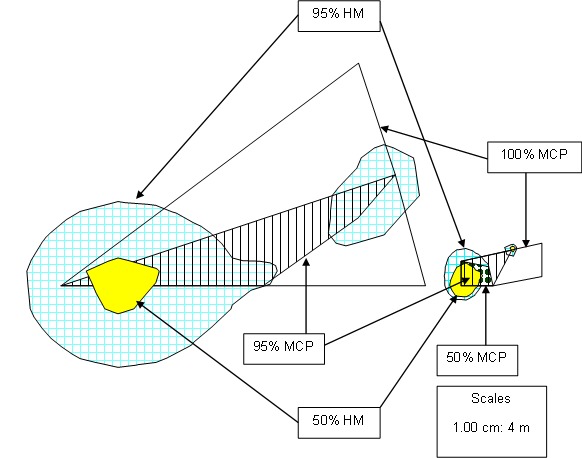
Studies of habitat suitability (HS) are essential when animals' habitats have been altered or when animals migrate to a habitat different from their natural habitat. This study assessed HS and used an integrated geographic information system in the assessment of Rattus norvegicus in a highly developed urban environment. Using data from the Campbell market and the police quarters of George Town, Malaysia, home range (through the use of 100% Minimum Convex Polygon [MCP], 95% MCP and 95% Harmonic Mean [HM]) was estimated. Home range for male rats at Campbell market reached an asymptote, with a slight increase, at 96 radio fixes (home range = 133.52 m(2); core area = 29.39 m(2)). Female rats reached an asymptote at 62 radio fixes (home range = 13.38 m(2); core area = 9.17 m(2)). At Campbell market, male rats emerged at 1900 hours every day, whereas females emerged at 2000 hours; at police quarters, the most common time of emergence for males was 2000 hours and for females was 2200. Raster charts of R. norvegicus showed that rat hot spots can be grouped into 4 zones (market, shop houses, settlement and general places). The standardised raster chart isolated the market as the major rallying points of the rats (hot spots) by producing the highest rats frequencies of 255. All of the habitat suitability thresholds, including the built-up points, skip bins, water source and nature of the site explored in this study, produced a structural pattern (monotonic increase or decrease) of habitat suitability.
Kajian kesesuaian habitat (KS) sangat diperlukan apabila habitat haiwan telah diubahsuai atau haiwan berhijrah ke habitat yang sangat berbeza daripada habitat asli mereka. Kajian ini dijalankan untuk menaksir KS dan mengabungkan sistem maklumat geografi untuk Rattus norvegicus di kawasan perbandaran yang sangat membangun. Menggunakan data daripada pasar Campbell dan kuarters polis di George Town, Malaysia, kawasan rayau (kaedah 100% Minimum Convex Polygon [MCP], 95% MCP dan 95% Harmonic Mean [HM]) dianggarkan. Kawasan rayau tikus jantan di pasar Campbell mencapai asimptot pada 96 isyarat radio dengan sedikit peningkatan (kawasan rayau = 133.52 m2; titik pusat = 29.39 m2). Tikus betina mencapai asimptot pada 62 isyarat radio (kawasan rayau = 13.38 m2; titik pusat = 9.17 m2). Di pasar Campbell, tikus jantan muncul pada jam 1900 setiap hari manakala betina muncul pada jam 2000 tetapi di kuarters polis, masa kebiasaan kemunculan untuk jantan adalah pada jam 2000 dan betina pada jam 2200. Carta raster R. norvegicus menunjukkan titik tumpuan tikus boleh dikategorikan kepada 4 zon (pasar, rumah kedai, kediaman dan kawasan tumpuan awam). Carta raster yang diseragamkan memisahkan kawasan utama titik tumpuan tikus ialah di pasar dengan frekuensi tikus tertinggi iaitu 225. Semua analisis kesesuaian habitat termasuk kawasan dibangunkan, kawasan tong sampah, sumber air dan tapak semulajadi dalam kajian ini mempamerkan corak berstruktur (peningkatan atau penurunan monotonik) kesesuaian habitat.
Keywords: Algorithm; Asymptote; Fixes; Monotonic; Raster; Trap.
Figures


Similar articles
-
Habitat use and home range of brown-nosed coati, Nasua nasua (Carnivora: Procyonidae) in the Brazilian Cerrado biome.Rev Biol Trop. 2010 Sep;58(3):1069-77. doi: 10.15517/rbt.v58i2.5263. Rev Biol Trop. 2010. PMID: 20737855
-
Multiple Paternity in the Norway Rat, Rattus norvegicus, from Urban Slums in Salvador, Brazil.J Hered. 2016 Mar;107(2):181-6. doi: 10.1093/jhered/esv098. Epub 2016 Jan 4. J Hered. 2016. PMID: 26733693 Free PMC article.
-
Home range size and habitat use of the blue-crowned laughingthrush during the breeding season.PeerJ. 2020 Apr 21;8:e8785. doi: 10.7717/peerj.8785. eCollection 2020. PeerJ. 2020. PMID: 32341888 Free PMC article.
-
Leptospira infection in rats: A literature review of global prevalence and distribution.PLoS Negl Trop Dis. 2019 Aug 9;13(8):e0007499. doi: 10.1371/journal.pntd.0007499. eCollection 2019 Aug. PLoS Negl Trop Dis. 2019. PMID: 31398190 Free PMC article. Review.
-
The functional value of Caribbean coral reef, seagrass and mangrove habitats to ecosystem processes.Adv Mar Biol. 2006;50:57-189. doi: 10.1016/S0065-2881(05)50002-6. Adv Mar Biol. 2006. PMID: 16782451 Review.
Cited by
-
Detection parameters for managing invasive rats in urban environments.Sci Rep. 2022 Oct 3;12(1):16520. doi: 10.1038/s41598-022-20677-8. Sci Rep. 2022. PMID: 36192476 Free PMC article.
-
Estimation of the maximum utilization area including home range and peripheral sites.Ecol Evol. 2022 May 7;12(5):e8893. doi: 10.1002/ece3.8893. eCollection 2022 May. Ecol Evol. 2022. PMID: 35571756 Free PMC article.
-
Sprague-Dawley Rats Differ in Responses to Medial Perforant Path Paired Pulse and Tetanic Activation as a Function of Sex and Age.eNeuro. 2023 Jul 5;10(7):ENEURO.0431-22.2023. doi: 10.1523/ENEURO.0431-22.2023. Print 2023 Jul. eNeuro. 2023. PMID: 37364997 Free PMC article.
-
Field Efficacy of Anticoagulant Rodenticide Towards Managing Rodent Pests in Jitra Rice Field, Kedah, Malaysia.Trop Life Sci Res. 2024 Oct;35(3):243-264. doi: 10.21315/tlsr2024.35.3.11. Epub 2024 Oct 7. Trop Life Sci Res. 2024. PMID: 39464665 Free PMC article.
-
Population dynamics of synanthropic rodents after a chemical and infrastructural intervention in an urban low-income community.Sci Rep. 2022 Jun 16;12(1):10109. doi: 10.1038/s41598-022-14474-6. Sci Rep. 2022. PMID: 35710879 Free PMC article.
References
-
- Bell E, Boyle D, Floyd K, Garner-Richard P, Swann B, Luxmoore R, Patterson A, Thomson R. The ground based eradication of Norway rats (Rattus norvegicus) from the Isle of Canna, Inner Hebrides, Scotland. In: Vietch CR, Clout MN, Town DR, editors. Island invasives: Eradication and management. Gland, Switzerland: International Union for Conservation of Nature and Natural Resources (IUCN); 2011. pp. 269–274.
-
- Belmain S, Chakman N, Sarker NJ, Saker S, Kamal N, Sarker S. Prospects for Ecologically-based management of rodent population outbreaks: Can we mitigate 50 years cyclic famine in South Asia? In: Huitu O, Henttonen H, editors. 9th European Vertebrate Pest Management Conference. Turku, Finland 22–26 September 2013. Painosalama, Finland: Finnish Forest Research Institute (Metla); 2013. pp. 68–73.
LinkOut - more resources
Full Text Sources
Miscellaneous