. 2016 Feb 12:6:20864.
doi: 10.1038/srep20864.

Selective inhibition of EZH2 by ZLD1039 blocks H3K27 methylation and leads to potent anti-tumor activity in breast cancer

Affiliations

Selective inhibition of EZH2 by ZLD1039 blocks H3K27 methylation and leads to potent anti-tumor activity in breast cancer

Xuejiao Song et al. Sci Rep. .

Abstract

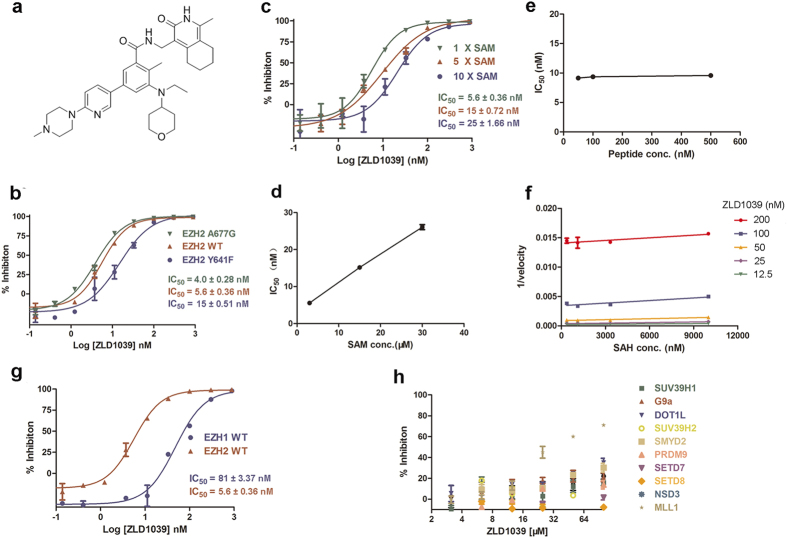
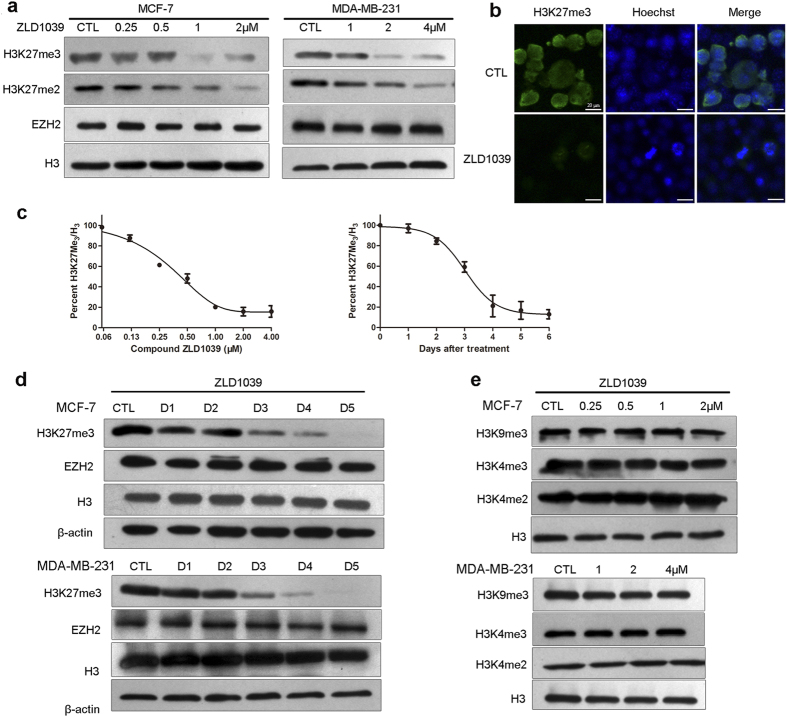
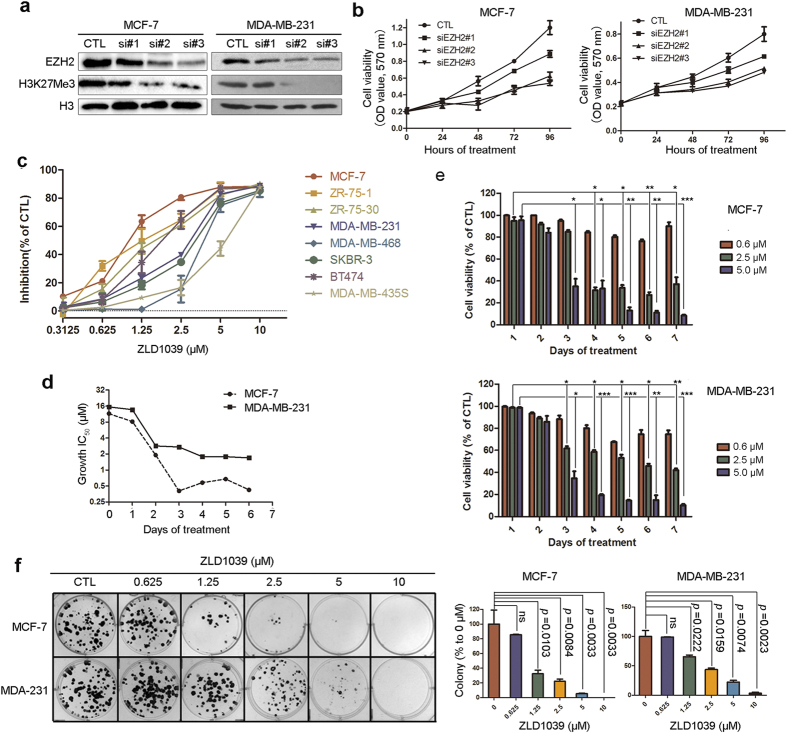
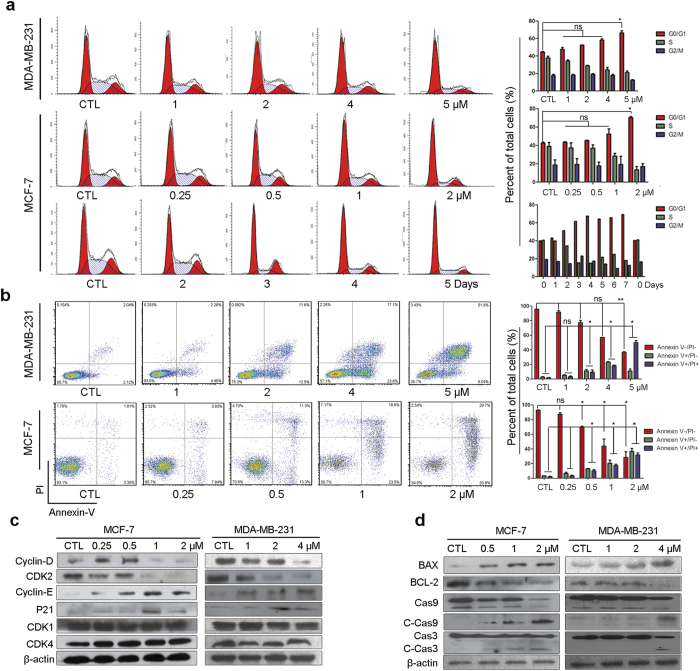
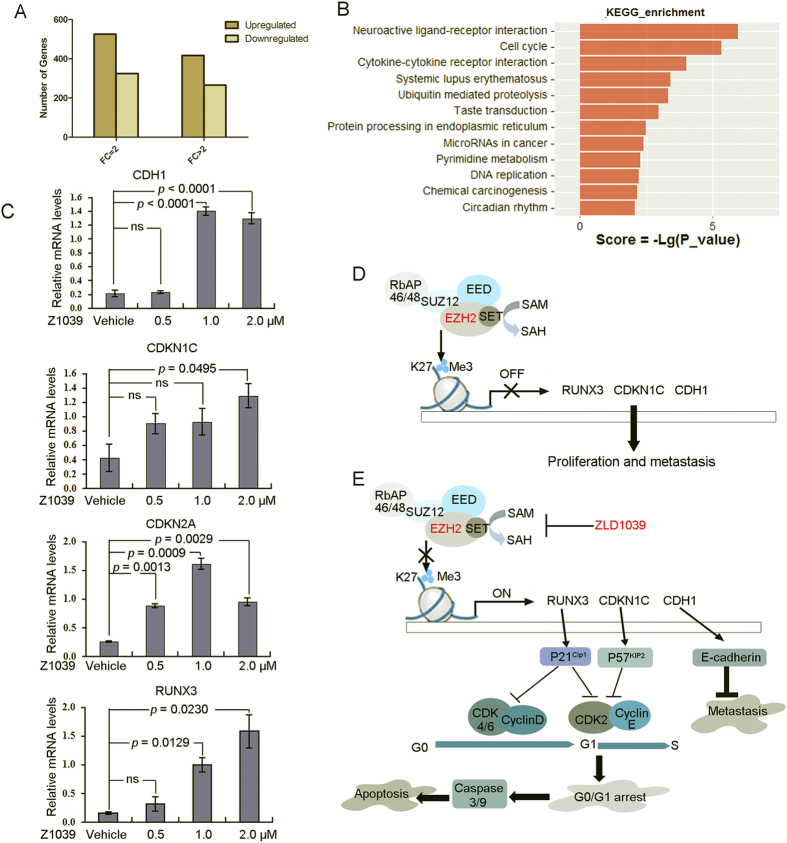
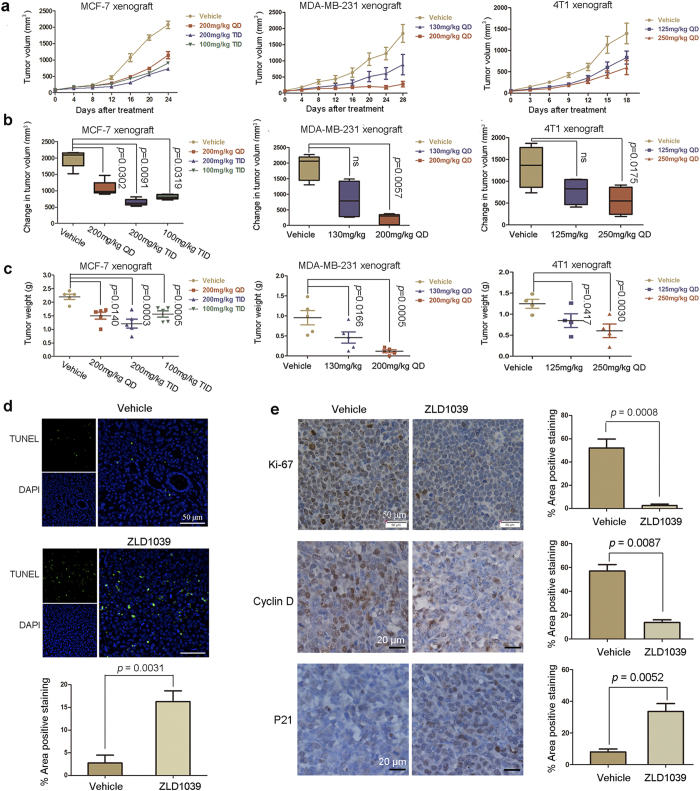
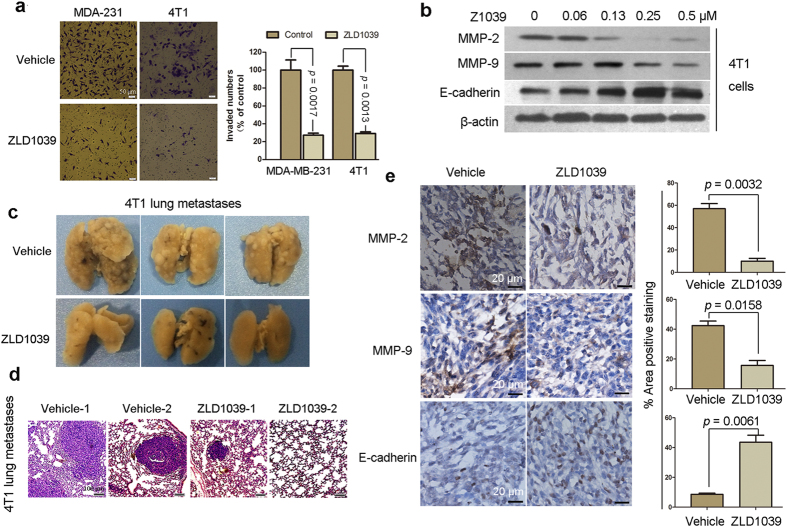
Enhancer of zeste homolog 2 (EZH2) is a candidate oncogenic driver due to its prevalent overexpression and aberrant repression of tumor suppressor genes in diverse cancers. Therefore, blocking EZH2 enzyme activity may present a valid therapeutic strategy for the treatment of cancers with EZH2 overexpression including breast cancers. Here, we described ZLD1039 a potent, highly selective, and orally bioavailable small molecule inhibitor of EZH2, which inhibited breast tumor growth and metastasis. ZLD1039 considerably inhibited EZH2 methyltransferase activity with nanomolar potency, decreased global histone-3 lysine-27 (H3K27) methylation, and reactivated silenced tumor suppressors connected to increased survival of patients with breast cancer. Comparable to conditional silencing of EZH2, its inhibition by ZLD1039 decreased cell proliferation, cell cycle arrest, and induced apoptosis. Comparably, treatment of xenograft-bearing mice with ZLD1039 led to tumor growth regression and metastasis inhibition. These data confirmed the dependency of breast cancer progression on EZH2 activity and the usefulness of ZLD1039 as a promising treatment for breast cancer.


Figures

Figure 1
Figure 1. Characterization of a potent, selective EZH2 small molecule inhibitor.
(a) Chemical structure of ZLD1039. (b) Potency of ZLD1039 against wild-type and mutant EZH2. IC50 values were calculated from 10 point dose response. All data are mean ± SD of triplicate experiments. (c,d) S-Adenosylmethionine (SAM) competition inhibition of ZLD1039. Activity assays were carried out with either standard assay, 5×SAM or 10 × SAM. The ~4-fold shift of IC50 values at higher SAM was consistent with ZLD1039 being SAM-competitive. Data are derived from 10 point dose response. All data are mean ± SD of triplicates. (e) Plot of IC50 values of ZLD1039 under the conditions of various peptide (H3[21–24]) concentrations. The IC50 was unaffected as the concentration of peptide was increased. All data points are mean of triplicates ± SD. (f) Assays were performed by combining various concentrations of SAH and ZLD1039 and yielded parallel lines in a plot of 1/velocity as a function of SAH concentration for different concentrations of ZLD1039 tested. All data points are mean of triplicates ± SD. (g,h) Selectivity of ZLD1039 was tested against a panel of HMTs, including EZH1, SETD7, SUV39H1, G9a, DOT1L, SUV39H2, SMYD2, PRDM9, SETD8, NSD3 and MLL1. All enzyme assays were carried out under balance conditions as six-point dose response. All data points are mean ± SD of triplicates. HMTs, histone methyltransferases; SETD7, SET domain containing lysine methyltransferase 7; SUV39H1, suppressor of variegation 3–9 homolog 1; DOT1L, DOT1-like histone H3K79 methyltransferase; SMYD2, SET and MYND domain containing 2; PRDM9, positive regulatory domain containing zinc finger protein 9; NSD3, nuclear receptor SET domain-containing 3; MLL1, mixed-lineage leukemia 1.
Figure 2
Figure 2. Effects of ZLD1039 on cellular global histone methylation.
(a) Dose-dependent inhibition of cellular H3K27 methylation by 4-day ZLD1039 treatment of MCF-7 and MDA-MB-231 cells. H3K27me3, H3K27me2, EZH2, and H3 were detected using immunoblot. (b) H3K27me3 levels were analysed using immunofluorescence (IF) microscopy. MCF-7 cells were treated with 2 μM ZLD1039 for 3 days and Hoechst staining was used to illustrate similar cell numbers in both treatment groups. (c) ZLD1039 inhibited cellular H3K27me3 in MCF-7 cells time- and dose-dependently (ELISA assay). Data are mean ± SD of three independent experiments. (d) Time course of H3K27me3 inhibition by ZLD1039. MCF-7 and MDA-MB-231 cells were treated (2 and 4 μM, respectively) for indicated days. (e) ZLD1039 selectively inhibited cellular H3K27 methylation without other H3 methylation modifications in MCF-7 and MDA-MB-231 cells.
Figure 3
Figure 3. Antiproliferative activities of ZLD1039 against breast cancer cells in vitro.
(a) Cells were transfected with EZH2 siRNA for 4 days. Levels of EZH2 expression were detected using immunoblots. (b) MCF-7 and MDA-MB-231 cells were transfected with EZH2 siRNA for 0, 1, 2, 3, and 4 days and cell viability was determined. Data are mean ± SD (n = 3). (c) Cells were treated with indicated agents for 4 days, and cell viability was measured using MTT assay. Results are expressed as mean ± SD of three independent experiments. (d) Potency of ZLD1039 against growth of MCF-7 and MDA-MB-231 cells over time represented as growth half-maximal inhibitory concentration (IC50, μM). (e) Proliferation of MCF-7 and MDA-MB-231 cells treated with various concentrations of ZLD1039 for indicated days. Values are mean ± SD (n = 3). *P < 0.05, **P< 0.01, and ***P< 0.001 compared with control. (f) Effects of ZLD1039 on MCF-7 and MDA-MB-231 cell colony formation after incubation for 14 days. Quantification is shown in right panel. Data are mean ± SD (n = 3). P-values for comparison of two groups were determined using two-tailed Student’s t-test; ns, not statistically significant.
Figure 4
Figure 4. Induction of G0/G1 phase arrest and apoptosis by ZLD1039 treatment in breast cancer cells in vitro.
(a) ZLD1039 induced G0/G1 phase arrest of MCF-7 and MDA-MB-231 cells. MDA-MB-231 cells (up) and MCF-7 cells (middle) were treated with indicated concentration of ZLD1039 for 4 days, and MCF-7 cells (down) were treated with ZLD1039 (2 μM) for indicated days, and then cell-cycle distribution was analysed by flow cytometry (FCM). Percentages of the cell cycle are presented (right). Values are mean ± SD (n = 3); ns, not statistically significant; *P < 0.05 among groups. (b) FCM analysis of cells stained with Annexin V- FITC/PI after treatment with various concentrations of ZLD1039 for 4 days. Quantified values of apoptosis are shown (right). Results are mean ± SD of three independent experiments; ns, not statistically significant; *P < 0.05 and **P < 0.01 among groups. (c,d) Cells were treated with various concentrations of ZLD1039 for 4 days and proteins were analysed using immunoblot analysis. Cas9, pro-caspase 9; C-Cas9, cleaved-caspase 9; Cas3, pro-caspase 3; C-Cas3, cleaved-caspase 3.
Figure 5
Figure 5. ZLD1039 induced transcription activation in MCF-7 cells.
(A) Gene-expression changes in MCF-7 cells after ZLD1039 (1.5 μM for 3 days) treatment. Changes in gene expression were evaluated using fold-change >2 and P < 0.05. (B) KEGG analysis of expression microarray assays of PRC2 in MCF-7 cells, categorized by molecular function (MF). Top 12 pathways with the highest significance in KEGG analysis were listed. KEGG, Kyoto Encyclopedia of Genes and Genomes. (C) MCF-7 cells were incubated with indicated concentration of ZLD1039 for 3 days. Gene expression was determined using qRT-PCR and expressed relative to control of each time point. Data are mean ± SD of three independent experiments. P-values for comparison of two groups were determined using two-tailed Student’s t-test; ns, not statistically. (D,E) Proposed signalling pathways of ZLD1039-induced G0/G1 arrest, apoptosis, and antimetastatic activity in breast cancer cells.
Figure 6
Figure 6. Antitumor efficacy of ZLD1039 in vivo.
(a) Tumor regression of MCF-7, MDA-MB-231, or 4T1 tumor xenografts in mice treated with different dosing schedules of ZLD1039 three times a day (TID) or once a day (QD). Data are tumor volume mean ± SEM (n = 5). (b) Quantitative analysis of tumor volume change on final study day. Boxes display lower (25th) and upper (75th) quartiles with a line at the median; whiskers extend from minimum to maximum observation. P-values were determined using two-tailed Student’s t-test; ns, not significant. (c) Represented weight of tumors from mice in different groups. Data are mean ± SEM. P-values comparing two groups were determined using two-tailed Student’s t-test. (d) After 14 days treatment, MCF-7 tumors treated with 200 mg/kg ZLD1039 or vehicle were examined using terminal deoxynucleotidyl transferase (TdT) dUTP nick-end labelling (TUNEL) assay (n = 3). TUNEL-positive cells were counted in four high power fields/slide, and data were summarized as a percentage of positive cells. Data are mean ± SD. P-values were determined using two-tailed Student’s t-test. (e) Tumor tissues from MCF-7 xenografts treated with vehicle or ZLD1039 (200 mg/kg) for 14 days were immunohistochemically analysed with anti-Ki67, anti-cyclin D, and anti-P21 antibodies (n = 3). Representative images and quantitative analysis of percentage of positive staining are shown. P-values for comparing two groups were determined using two-tailed Student’s t-test.
Figure 7
Figure 7. ZLD1039 inhibited tumor metastasis.
(a) MDA-MB-231 and 4T1 cells were seeded in top chamber of transwell and treated with ZLD1039 (2 and 1 μM, respectively) for 24 h. Migrated cells were stained, photographed, and quantified. Results are mean ± SD of three independent experiments. P-values for comparing two groups were determined using two-tailed Student’s t-test. (b) 4T1 cells were treated with indicated concentration of ZLD1039 for 4 days and expression of proteins were detected using immunoblot. (c) Metastatic lung nodules were visualized to show antimetastatic activity of ZLD1039 (250 mg/kg) against 4T1 tumors after 18-day treatment. (d) Haematoxylin and eosin (H&E) staining of lung tissues was performed, and representative images are shown. (e) Tumors were harvested from 4T1 tumor-bearing mice after 18-day treatment with ZLD1039 (250 mg/kg) and expression of matrix metalloproteinase MMP-2, MMP-9, and E-cadherin was detected using immunohistochemical (IHC) analysis (n = 3). Representative images and quantitative analysis of percentage of positively stained cells are shown. P-values for comparing two groups were determined using two-tailed Student’s t-test.

Similar articles

Cited by

References

    1. Kouzarides T. Chromatin modifications and their function. Cell 128, 693–705 (2007). - PubMed
    1. Helin K. & Dhanak D. Chromatin proteins and modifications as drug targets. Nature 502, 480–488 (2013). - PubMed
    1. Daigle S. R. et al. Selective killing of mixed lineage leukemia cells by a potent small-molecule DOT1L inhibitor. Cancer Cell 20, 53–65 (2011). - PMC - PubMed
    1. Kubicek S. et al. Reversal of H3K9me2 by a small-molecule inhibitor for the G9a histone methyltransferase. Mol. Cell 25, 473–481 (2007). - PubMed
    1. Liu F. et al. Exploiting an allosteric binding site of PRMT3 yields potent and selective inhibitors. J. Med. Chem. 56, 2110–2124 (2013). - PMC - PubMed

Publication types

MeSH terms