

Application of imaging mass spectrometry for the molecular diagnosis of human breast tumors
- PMID: 26868906
- PMCID: PMC4751527
- DOI: 10.1038/srep21043
Application of imaging mass spectrometry for the molecular diagnosis of human breast tumors
Abstract
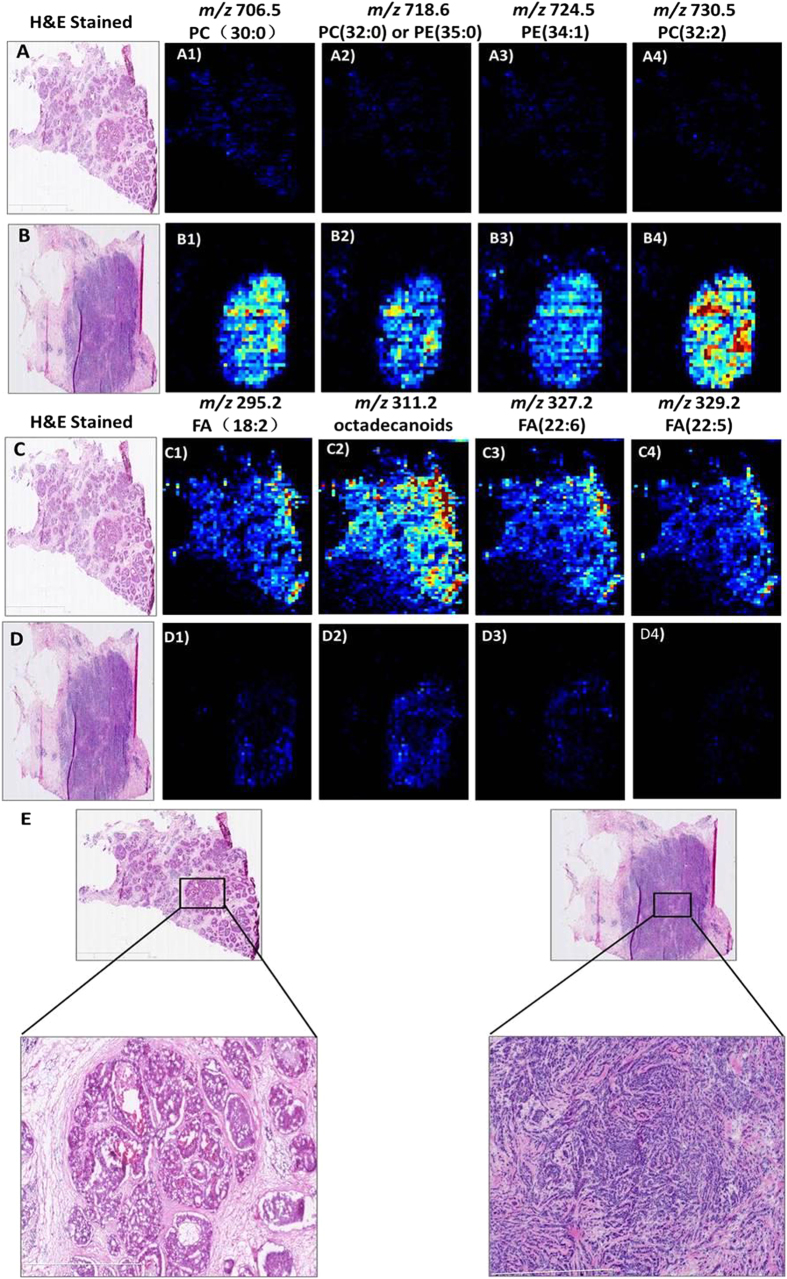
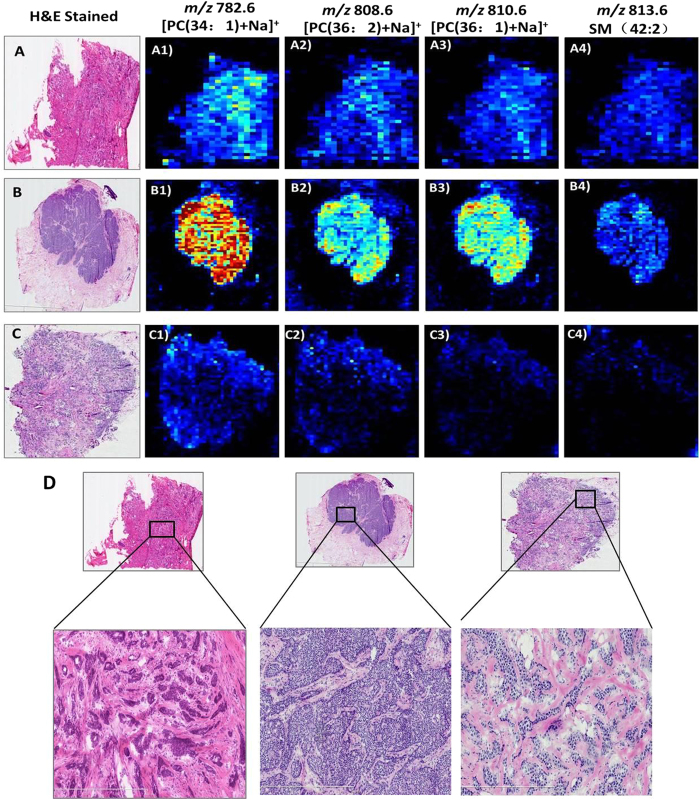
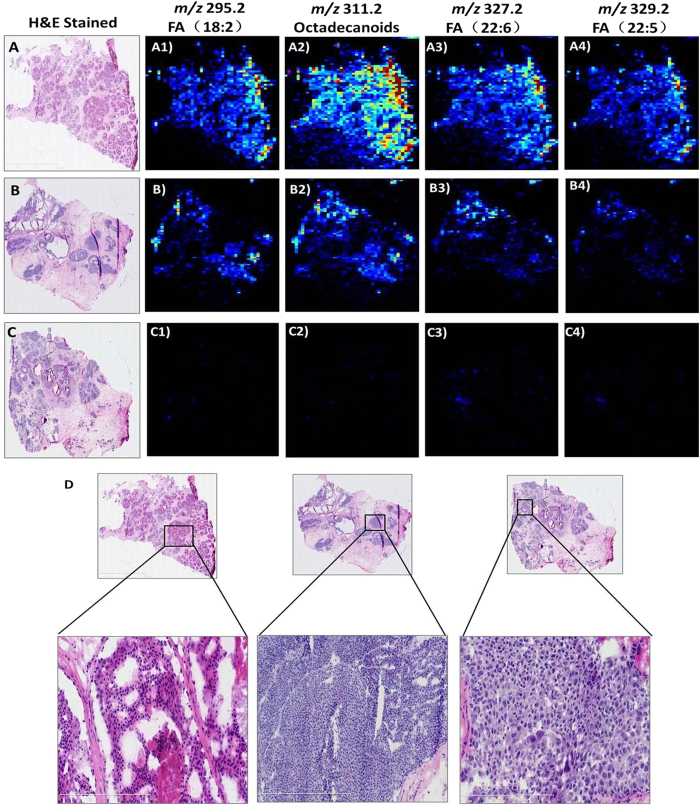
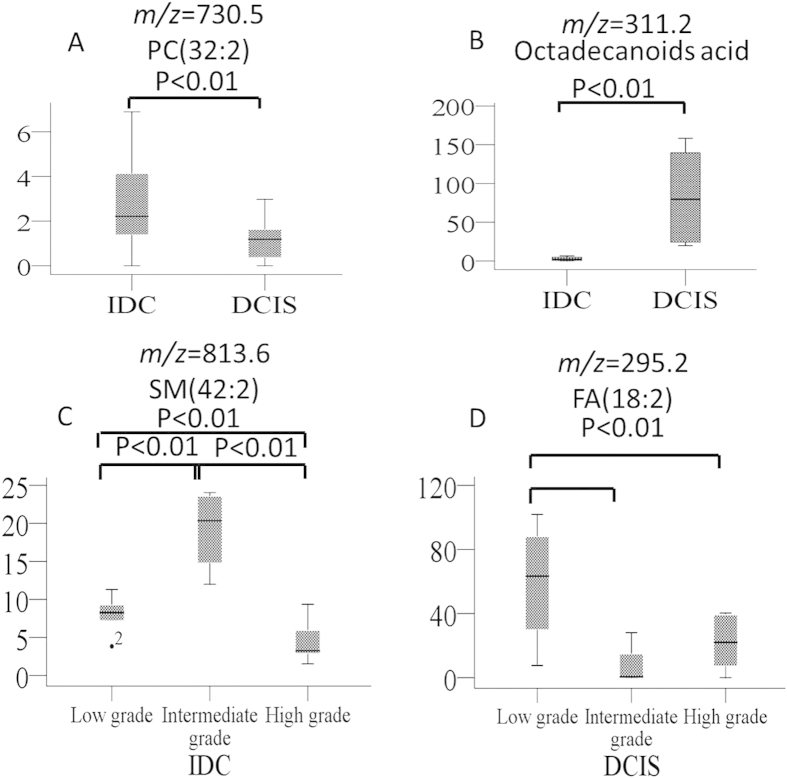
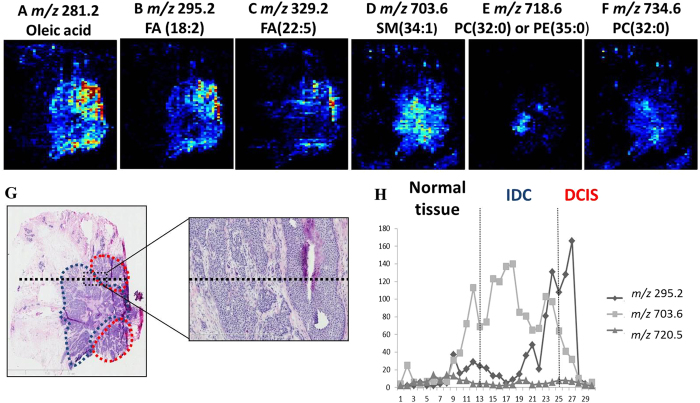
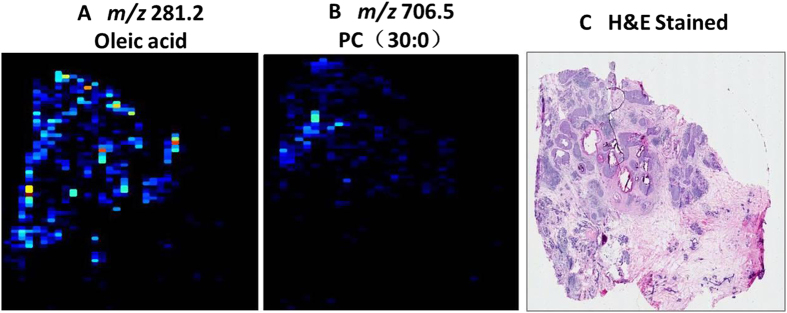
Distinguishing breast invasive ductal carcinoma (IDC) and breast ductal carcinoma in situ (DCIS) is a key step in breast surgery, especially to determine whether DCIS is associated with tumor cell micro-invasion. However, there is currently no reliable method to obtain molecular information for breast tumor analysis during surgery. Here, we present a novel air flow-assisted ionization (AFAI) mass spectrometry imaging method that can be used in ambient environments to differentiate breast cancer by analyzing lipids. In this study, we demonstrate that various subtypes and histological grades of IDC and DCIS can be discriminated using AFAI-MSI: phospholipids were more abundant in IDC than in DCIS, whereas fatty acids were more abundant in DCIS than in IDC. The classification of specimens in the subtype and grade validation sets showed 100% and 78.6% agreement with the histopathological diagnosis, respectively. Our work shows the rapid classification of breast cancer utilizing AFAI-MSI. This work suggests that this method could be developed to provide surgeons with nearly real-time information to guide surgical resections.
Figures
Similar articles
-
Expression of Her2/neu, steroid receptors (ER and PR), Ki67 and p53 in invasive mammary ductal carcinoma associated with ductal carcinoma In Situ (DCIS) Versus invasive breast cancer alone.Anticancer Res. 2005 May-Jun;25(3A):1719-23. Anticancer Res. 2005. PMID: 16033090
-
Breast density, scintimammographic (99m)Tc(V)DMSA uptake, and calcitonin gene related peptide (CGRP) expression in mixed invasive ductal associated with extensive in situ ductal carcinoma (IDC + DCIS) and pure invasive ductal carcinoma (IDC): correlation with estrogen receptor (ER) status, proliferation index Ki-67, and histological grade.Breast Cancer. 2011 Oct;18(4):286-91. doi: 10.1007/s12282-009-0192-y. Epub 2010 Feb 9. Breast Cancer. 2011. PMID: 20143189
-
Recognizing breast ductal carcinoma in situ on fine-needle aspiration: a diagnostic dilemma.Diagn Cytopathol. 2013 Aug;41(8):710-5. doi: 10.1002/dc.23015. Epub 2013 Jun 1. Diagn Cytopathol. 2013. PMID: 23729369
-
Carcinoma in situ of the female breast. A clinico-pathological, immunohistological, and DNA ploidy study.APMIS Suppl. 2003;(108):1-67. APMIS Suppl. 2003. PMID: 12874968 Review.
-
Pitfalls in lipid mass spectrometry of mammalian samples - a brief guide for biologists.Nat Rev Mol Cell Biol. 2024 Oct;25(10):759-760. doi: 10.1038/s41580-024-00758-4. Nat Rev Mol Cell Biol. 2024. PMID: 38951702 Review. No abstract available.
Cited by
-
Biomarker discovery to improve prediction of breast cancer survival: using gene expression profiling, meta-analysis, and tissue validation.Onco Targets Ther. 2016 Oct 11;9:6177-6185. doi: 10.2147/OTT.S113855. eCollection 2016. Onco Targets Ther. 2016. PMID: 27785066 Free PMC article.
-
Ductal Carcinoma in Situ Biomarkers in a Precision Medicine Era: Current and Future Molecular-Based Testing.Am J Pathol. 2019 May;189(5):956-965. doi: 10.1016/j.ajpath.2018.08.020. Epub 2018 Oct 29. Am J Pathol. 2019. PMID: 30385093 Free PMC article. Review.
-
Integrated landscape of copy number variation and RNA expression associated with nodal metastasis in invasive ductal breast carcinoma.Oncotarget. 2018 Dec 7;9(96):36836-36848. doi: 10.18632/oncotarget.26386. eCollection 2018 Dec 7. Oncotarget. 2018. PMID: 30627325 Free PMC article.
-
Single-cell and spatial multi-omics in the plant sciences: Technical advances, applications, and perspectives.Plant Commun. 2023 May 8;4(3):100508. doi: 10.1016/j.xplc.2022.100508. Epub 2022 Dec 20. Plant Commun. 2023. PMID: 36540021 Free PMC article. Review.
-
MALDI-TOF MS as a Novel Tool for the Estimation of Postmortem Interval in Liver Tissue Samples.Sci Rep. 2017 Jul 7;7(1):4887. doi: 10.1038/s41598-017-05216-0. Sci Rep. 2017. PMID: 28687792 Free PMC article.
References
-
- Reis-Filho J. S. & Lakhani S. R. Breast cancer special types: why bother? J. Pathol. 216, 394–398 (2008). - PubMed
-
- Vargo-Gogola T. & Rosen J. M. Modelling breast cancer: one size does not fit all. Nat. Rev. Cancer. 7, 659–672 (2007). - PubMed
-
- Ellis I. O. et al. Pathological prognostic factors in breast cancer. II. Histological type: relationship with survival in a large study with long-term follow-up. Histopathology. 20, 479–489 (1992). - PubMed
-
- Elston C. W. & ellis I. O. Pathological prognostic factors in breast cancer. I. The value of histological grade in breast cancer: experience from a large study with long-term follow-up. Histopathology. 19, 403–410 (1991). - PubMed
-
- Bourgier C. et al. Overview of preoperative radiochemotherapy in breast cancer: past or future? Clin Transl Oncol. Jul. 13(7), 446–50 (2011). - PubMed
Publication types
MeSH terms
Substances
LinkOut - more resources
Full Text Sources
Other Literature Sources
Medical
