. 2016 Jul;23(7):1219-31.
doi: 10.1038/cdd.2015.176. Epub 2016 Feb 12.

Inflammasome-dependent IL-1β release depends upon membrane permeabilisation

Affiliations

Inflammasome-dependent IL-1β release depends upon membrane permeabilisation

F Martín-Sánchez et al. Cell Death Differ. 2016 Jul.

Abstract

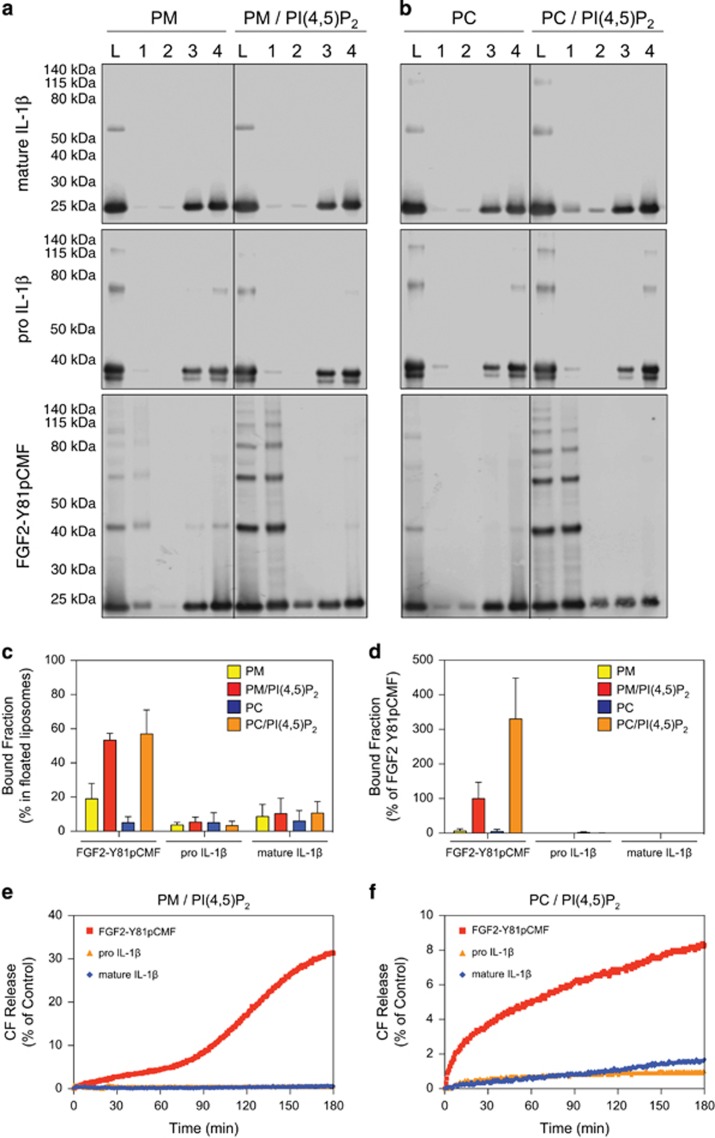
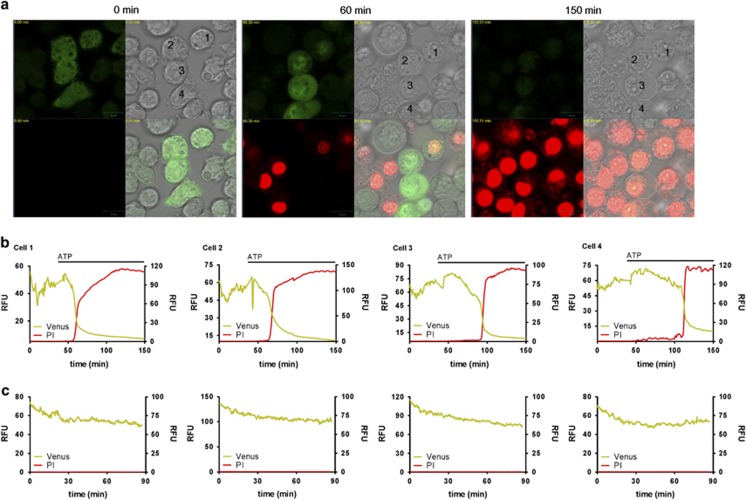
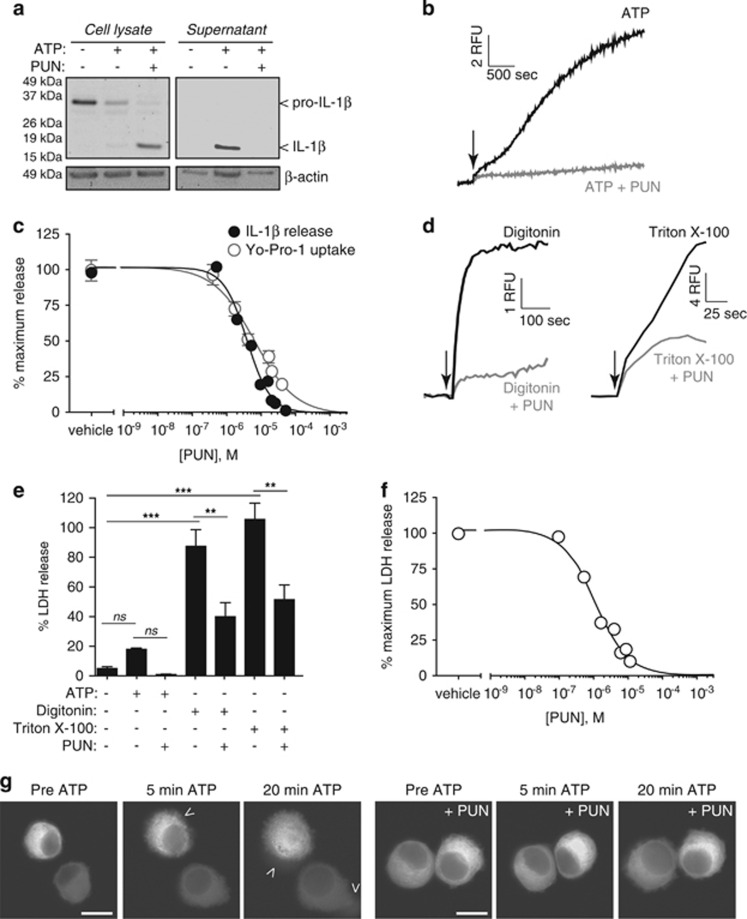
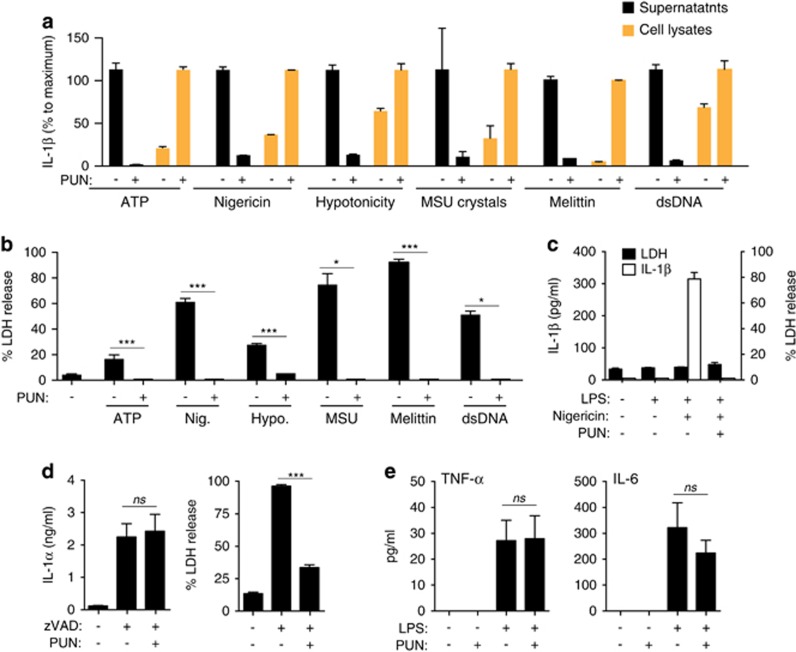
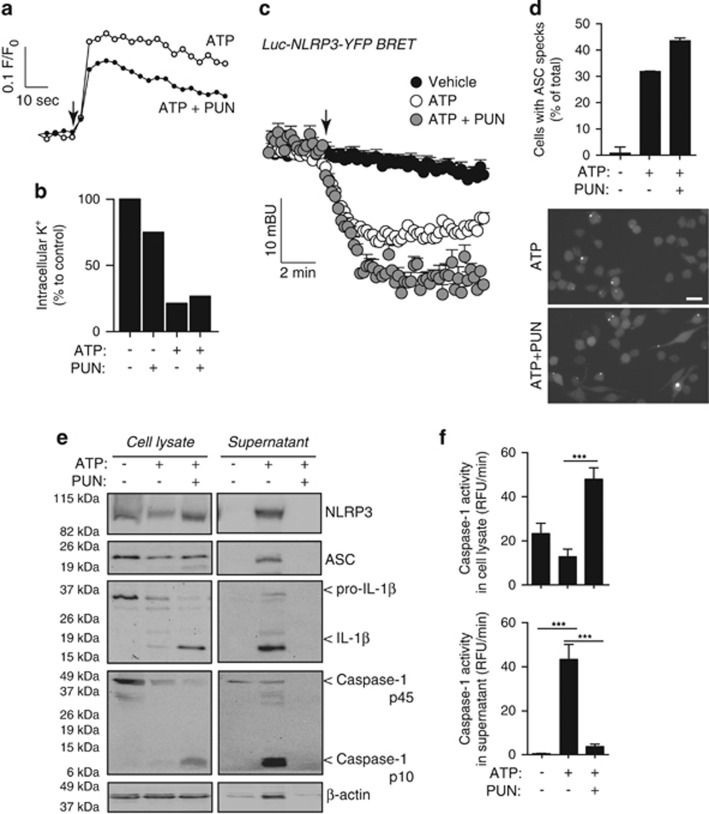
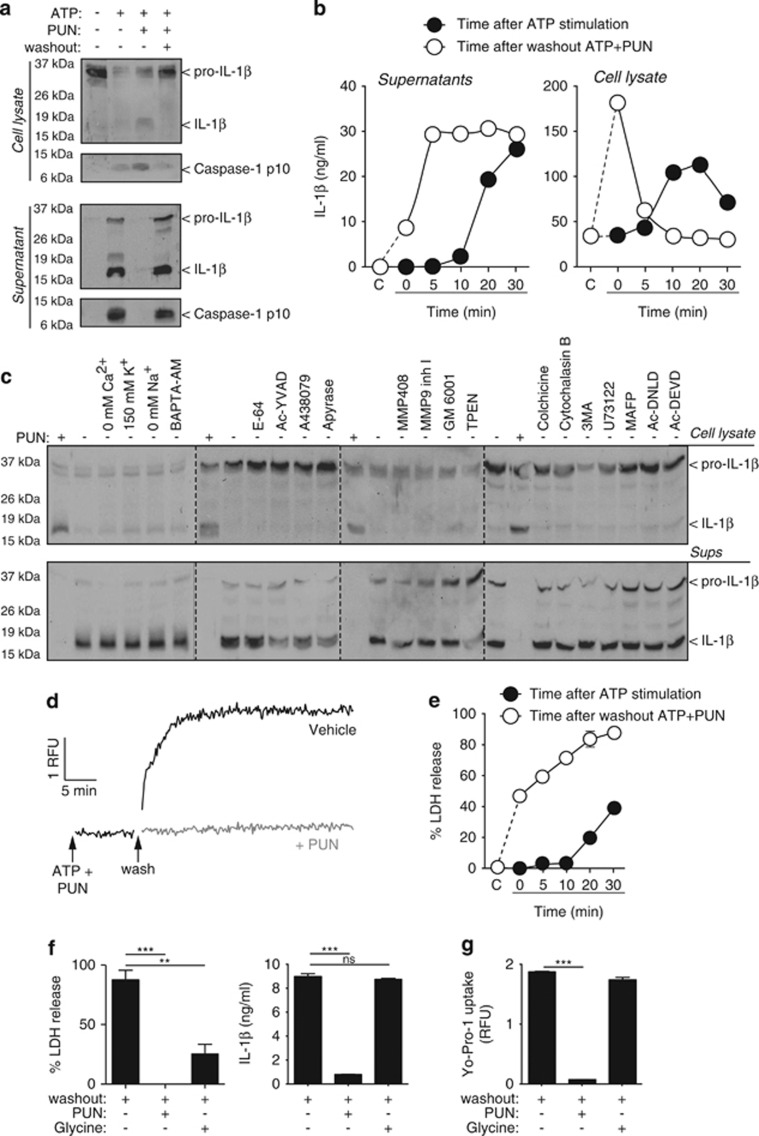
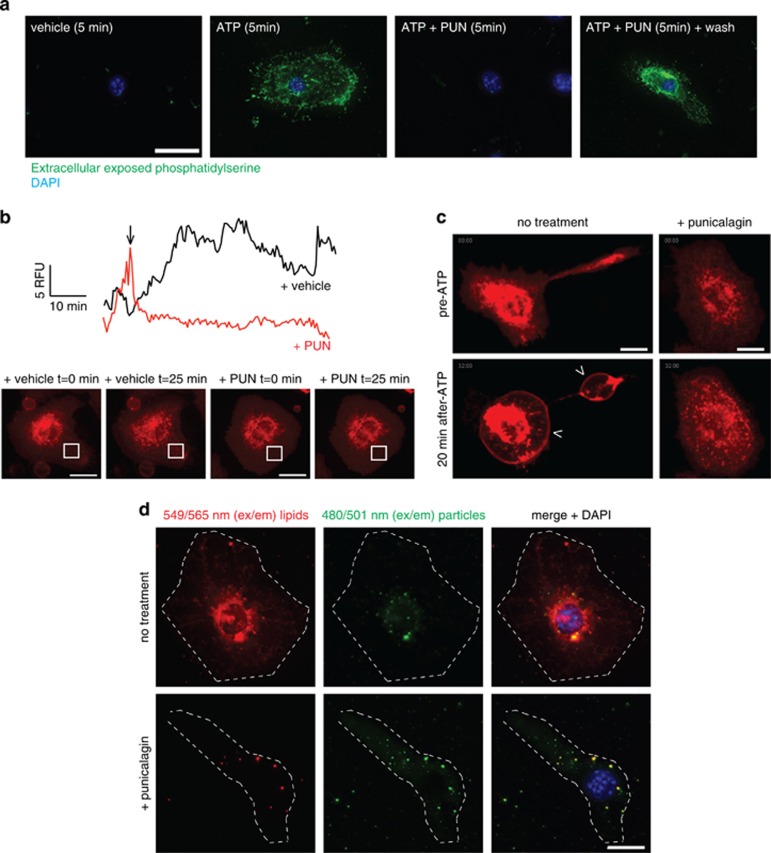
Interleukin-1β (IL-1β) is a critical regulator of the inflammatory response. IL-1β is not secreted through the conventional ER-Golgi route of protein secretion, and to date its mechanism of release has been unknown. Crucially, its secretion depends upon the processing of a precursor form following the activation of the multimolecular inflammasome complex. Using a novel and reversible pharmacological inhibitor of the IL-1β release process, in combination with biochemical, biophysical, and real-time single-cell confocal microscopy with macrophage cells expressing Venus-labelled IL-1β, we have discovered that the secretion of IL-1β after inflammasome activation requires membrane permeabilisation, and occurs in parallel with the death of the secreting cell. Thus, in macrophages the release of IL-1β in response to inflammasome activation appears to be a secretory process independent of nonspecific leakage of proteins during cell death. The mechanism of membrane permeabilisation leading to IL-1β release is distinct from the unconventional secretory mechanism employed by its structural homologues fibroblast growth factor 2 (FGF2) or IL-1α, a process that involves the formation of membrane pores but does not result in cell death. These discoveries reveal key processes at the initiation of an inflammatory response and deliver new insights into the mechanisms of protein release.


Conflict of interest statement

MP is an employee of Probelte Biotechnology S.L. The other authors declare no conflict of interest.

Figures

Figure 1
Figure 1
Membrane binding and pore formation properties of pro-IL-1β, mature IL-1β, and phosphomimetic FGF2. (ac) Biochemical analysis using liposomes characterised by either a plasma membrane-like lipid composition (PM) with or without 2 mol% PI(4,5)P2 (panel A) or phosphatidylcholine (PC) liposomes with or without 10 mol% PI(4,5)P2 (b). Binding properties of mature IL-1β, pro-IL-1β, and FGF2-Y81pCMF were compared. Membrane-bound material (fraction 1) was separated from free proteins (fractions 2–4) by membrane flotation in density gradients. Fractions were analysed by SDS-PAGE and western blotting using anti-IL-1β and anti-FGF2 antibodies, respectively. Quantification was done using an Odyssey infrared imaging system (LI-COR Bioscience). The amount of protein found in fraction 1 was quantified as the percentage of the total signal from fractions 1–4 (c). Mean values with S.D. of three independent experiments (n=3) are shown. (d) Binding of GFP-tagged variants of mature IL-1β, pro-IL-1β, and FGF2-Y81pCMF to liposomes with various lipid compositions as indicated was examined using an assay based upon flow cytometry. Signals were normalised based on FGF2-Y81pCMF binding to PM liposomes containing PI(4,5)P2 that was set to 100%. Mean values with S.D. (n=3) are shown. (e and f) Liposomes containing luminal carboxyfluorescein either consisting of a plasma membrane-like lipid composition (PM) containing PI(4,5)P2 (e) or phosphatidylcholine (PC) containing PI(4,5)P2 (f) were used to monitor membrane integrity upon incubation with the proteins indicated. Membrane pore formation was detected by the release of carboxyfluorescein that can be measured through dequenching. The results shown are representative for three independent experiments
Figure 2
Figure 2
Real-time secretion of IL-1β. Immortalised mouse BMDMs expressing IL-1βVenus were treated with LPS (1 μg/ml, 4 h). Fluorescence of IL-1βVenus (green) and PI (red) was then observed when treated with or without ATP (5 mM). (a) Shown are images of brightfield (upper right quad), Venus (upper left quad), PI (lower left quad), and merged (lower right quad). Shown are images for time 0, 60, and 150 min. Raw fluorescence data from cells labelled 1–4 are shown in (b) The fluorescence traces shown in (c) are from control movies where no ATP was added. Scale bar represents 10 μm
Figure 3
Figure 3
Punicalagin blocks mature IL-1β release and membrane permeabilisation. (a) Immunoblot analysis of the processing and release of pro-IL-1β in cell lysates and supernatants of LPS-primed (1 μg/ml, 4 h) BMDM unstimulated (−) or stimulated (+) for 30 min with ATP (5 mM) in the presence (+) or absence (−) of punicalagin (PUN; 25 μM). (b) Kinetics of Yo-Pro uptake in BMDMs treated as in (a). (c) Punicalagin concentration–inhibition curves obtained for IL-1β release and Yo-Pro uptake in BMDMs treated as in (a); punicalagin IC50 values were 3.91 and 7.65 μM for IL-1β release and Yo-Pro uptake respectively. (d) Kinetics of Yo-Pro uptake in LPS-primed BMDMs treated with digitonin (50 μM) or Triton X-100 (0.1%) in the presence or absence of punicalagin (PUN; 25 μM). (e) Percentage of extracellular LDH from BMDM treated as in (a) or for 30 min with detergents as in (d) in the presence (+) or absence (−) of punicalagin (PUN; 25 μM). **P<0.005; ***P<0.001; n.s., not significant (P>0.05) difference (ANOVA with Bonferroni's post-test). (f) Punicalagin concentration–inhibition curves obtained for LDH release in BMDMs treated as in (a); punicalagin IC50 was 3.67 μM. (g) Deconvolved images of immortalised macrophages expressing pro-IL-1βVenus and stimulated as in (a). Shown are images of Venus fluorescence for time 0 (pre-ATP) and 5 or 20 min after ATP application; see Supplementary Movies 4 and 5. Scale bar represents 10 μm; arrowheads indicate areas where the fluorescence is leaking from the cell
Figure 4
Figure 4
Punicalagin retain mature IL-1β in response to different NLRP3 activators. (a) IL-1β ELISA in cell lysates (orange bars) or supernatants (black bars) from BMDMs primed with LPS (1 μg/ml, 4 h) followed by no stimulation (−) or stimulation with ATP (5 mM, 30 min), nigericin (10 μm, 30 min), hypotonic solution (90 mOsm, 1 h), monosodium urate crystal (MSU; 200 μg/ml, 3 h), melittin (5 μM, 30 min), or double-stranded DNA (dsDNA; 2 μg/ml, 30 min) in the absence or presence of punicalagin (PUN; 25 μM). (b) Extracellular LDH from macrophages treated as in (a). (c) IL-1β ELISA in supernatants (white bars) or extracellular LDH (black bars) from mouse bone marrow-isolated neutrophils primed with LPS (100 ng/ml, 4 h) followed by no stimulation (−) or stimulation with nigericin (10 μm, 30 min) in the absence or presence of punicalagin (PUN; 25 μM). (d) IL-1α ELISA in supernatants (left panel) or extracellular LDH (right panel) from BMDMs primed with LPS (1 μg/ml, 4 h) followed by no stimulation (−) or stimulation (+) with zVAD (100 μM, 20 h) in the absence or presence of punicalagin (PUN; 25 μM). (e) TNF-α and IL-6 ELISA in supernatants from BMDMs primed with LPS (1 μg/ml, 4 h), washed, and followed by incubation for 30 min in the absence or presence of punicalagin (PUN; 25 μM). *P<0.05; ***P<0.001 (Student's t-test)
Figure 5
Figure 5
Punicalagin does not block NLRP3 or caspase-1 activation. (a) Intracellular Ca2+ rise in mouse BMDMs primed with LPS (1 μg/ml, 4 h) followed by stimulation with ATP (1 mM, added when indicated with an arrow) in the absence or presence of punicalagin (PUN; 25 μM). (b) Relative intracellular K+ concentration of BMDMs treated as in (a) with ATP for 30 min. (c) Kinetic of net BRET signal for NLRP3 protein expressed in P2X7-HEK293 cells unstimulated or stimulated with ATP (5 mM, added when indicated with an arrow). (d) Average quantification (top) and fluorescence microscopy images (bottom) of immortalised ASC-Cherry macrophages containing ASC specks treated as in (b); n >400 cells/condition from 2 independent experiments; scale bar represents 20 μm. (e and f) Immunoblot analysis (e) and caspase-1 activity measurements (f) of cell lysate and supernatant of BMDMs treated as in (b); ***P<0.001 difference (Student's t-test)
Figure 6
Figure 6
IL-1β release pharmacology. (a) Immunoblot analysis of cell lysate and supernatant of mouse BMDMs primed with LPS (1 μg/ml, 4 h), followed by no stimulation (−) or stimulation (+) with ATP (5 mM, 20 min) in the absence (−) or presence (+) of punicalagin (PUN; 25 μM) and then washout (+) or not (−) for 20 min. (b) ELISA of IL-1β of cell lysate and supernatant from BMDMs primed as in (a). Measures are taken every 5 min during 30 min of ATP stimulation (5 mM) after priming (black circles) or washout after 30 min stimulation with ATP (5 mM) with punicalagin (PUN; 25 μM) (white circles). (c) Immunoblot analysis of cell lysate and supernatant of BMDMs treated as in (a) and during washout after ATP+PUN cells were incubated with punicalagin (PUN; 25 μM), in a buffer without Ca2+, high K+ (150 mM), with NMDG+ (0 mM Na+), or normal ion buffer with BAPTA-AM (100 μM), E-64 cathepsin inhibitor (50 μM), Ac-YVAD caspase 1 inhibitor (100 μM), A438079 P2X7 antagonist (25 μM), apyrase (3 U/ml), MMP408 (1 μM), MMP9 (0.5 μM) and GM6001 (0.5 μM) metalloprotease inhibitors, TPEN Zn2+ chelator (50 μM), colchicine (50 μM) and cytochalasin B (2.5 μg/ml), 3-MA autophagy inhibitor (6 mM), U73122 phospholipase C inhibitor (10 μM), MAFP phospholipase A inhibitor (10 μM), Ac-DNLD, or Ac-DEVD caspase-3 inhibitors (100 μM). (d and e) Kinetic of Yo-Pro uptake (d) and percentage of extracellular LDH (e) from macrophages treated as in (b). (f) Percentage of extracellular LDH release and ELISA of IL-1β in supernatant from BMDMs treated as in (a) and during washout after ATP+PUN cells were incubated with punicalagin (PUN; 25 μM) or glycine (5 mM). (g) Yo-Pro uptake in BMDMs treated as in (f). **P<0.01; ***P<0.001; n.s., not significant (P>0.05) difference (ANOVA with Bonferroni multiple comparison test)
Figure 7
Figure 7
Punicalagin stabilises plasma membrane lipids. (a) Deconvolved maximum projection fluorescence images of representative BMDMs primed with LPS (1 μg/ml, 4 h), followed by no stimulation (vehicle) or stimulation with ATP (3 mM) for 5 min in the absence or presence of punicalagin (PUN, 25 μm) and then labelled with FITC-annexin V. Nuclei stained with DAPI (blue); scale bar represents 20 μm. (b) Mean of relative fluorescence unit (RFU) quantification in different regions of interest of the plasma membrane, as indicated in the images inserted, of macrophages primed with LPS as in (a) and then labelled with cholera toxin B-Alexa fluor 647 (CTB), untreated (vehicle, black trace), or treated with punicalagin (PUN, 25 μm, red trace) from the time indicated with an arrow. Movements of stained cholesterol-rich patches with CTB results in variations of RFU on the selected ROI, and punicalagin prevented these movements; see Supplementary Movies 6 and 7. (c) Deconvolved images of representative BMDMs stimulated as in (a), but with 5 mM of ATP and stained with CTB; shown are images of CTB fluorescence for time 0 (pre-ATP) and 20 min after ATP application; see Supplementary Movies 8 and 9. Scale bar represents 10 μm. (d) Deconvolved maximum projection fluorescence images of representative BMDMs primed with LPS as in (a) and incubated for 2 h with the Fuse-It liposomes in the absence or presence of punicalagin. Cells are visualised with red-labelled membranes, green-labelled cell lumen, and nuclei counterstained with DAPI (blue). Scale bar represents 10 μm, cellular edges are shown with a white dotted line

References

    1. Garlanda C, Dinarello CA, Mantovani A. The interleukin-1 family: back to the future. Immunity 2013; 39: 1003–1018. - PMC - PubMed
    1. Takeuchi O, Akira S. Pattern recognition receptors and inflammation. Cell 2010; 140: 805–820. - PubMed
    1. Latz E, Xiao TS, Stutz A. Activation and regulation of the inflammasomes. Nat Rev Immunol 2013; 13: 397–411. - PMC - PubMed
    1. Cassel SL, Sutterwala FS. Sterile inflammatory responses mediated by the NLRP3 inflammasome. Eur J Immunol 2010; 40: 607–611. - PMC - PubMed
    1. Lopez-Castejon G, Brough D. Understanding the mechanism of IL-1beta secretion. Cytokine Growth Factor Rev 2011; 22: 189–195. - PMC - PubMed

Publication types

MeSH terms