. 2016 Feb 12:6:20231.
doi: 10.1038/srep20231.

Dynamic mesolimbic dopamine signaling during action sequence learning and expectation violation

Affiliations

Dynamic mesolimbic dopamine signaling during action sequence learning and expectation violation

Anne L Collins et al. Sci Rep. .

Abstract

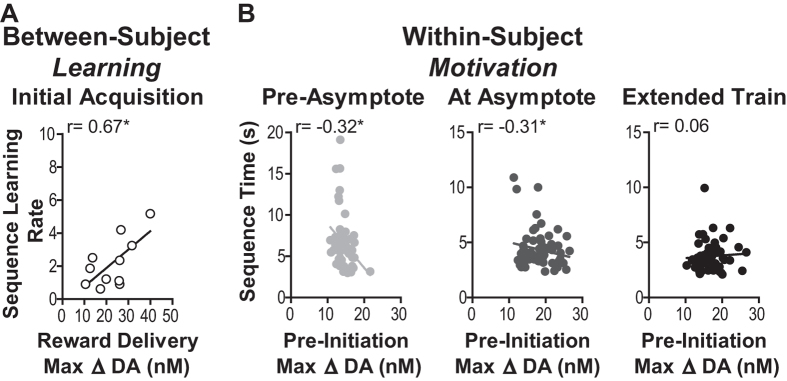
Prolonged mesolimbic dopamine concentration changes have been detected during spatial navigation, but little is known about the conditions that engender this signaling profile or how it develops with learning. To address this, we monitored dopamine concentration changes in the nucleus accumbens core of rats throughout acquisition and performance of an instrumental action sequence task. Prolonged dopamine concentration changes were detected that ramped up as rats executed each action sequence and declined after earned reward collection. With learning, dopamine concentration began to rise increasingly earlier in the execution of the sequence and ultimately backpropagated away from stereotyped sequence actions, becoming only transiently elevated by the most distal and unexpected reward predictor. Action sequence-related dopamine signaling was reactivated in well-trained rats if they became disengaged in the task and in response to an unexpected change in the value, but not identity of the earned reward. Throughout training and test, dopamine signaling correlated with sequence performance. These results suggest that action sequences can engender a prolonged mode of dopamine signaling in the nucleus accumbens core and that such signaling relates to elements of the motivation underlying sequence execution and is dynamic with learning, overtraining and violations in reward expectation.


Figures

Figure 1
Figure 1. Histological verification of recording sites and experimental design.
(A) Coronal section drawings taken from. These figures were published in The rat brain in stereotaxic coordinates, 4th edn, Paxinos & Watson, 175–177, Copyright Elsevier (1998). Numbers to the lower right represent anterior-posterior distance (mm) from bregma. Gray circles represent electrode placements. 8 actual recording sites were in the right and 3 in the left hemisphere. (B) Behavioral task design. See methods. d: day(s); LPI: Initiating lever press; LPT: Terminating lever press; Org 12.5% Suc: Orange-flavored 12.5% sucrose reward (training reward); Org 20% Suc: Orange-flavored 20% sucrose; Grp 12.5% Suc: Grape-flavored 12.5% sucrose; Poly: Polycose solution; Pellet; grain-based food pellet; H2O: water.
Figure 2
Figure 2. Dopamine concentration changes during action sequence learning and performance.
(A) Average sequence completion time (initial lever press-reward collection) across training. (B) Single-trial representative dopamine concentration v. time traces from the same rat for each phase of training. All except the top trace where the break is indicated, show continuous, unaveraged, non-concatenated traces. Blue arrows: time of initial approach towards the initiating lever. Insertion of the terminating lever occurs immediately following the initiating lever press. Red bars: reward delivery and consumption (rats collected earned reward on average 0.27 s, SEM = 0.02, following the terminating lever press). Insets: Background-subtracted cyclic voltammograms (CVs) showing oxidation and reduction peaks that identify the detected electrochemical signal as dopamine. Initial acquisition CV from the peak of current following reward delivery. All other CVs are average of CVs taken at 1-s intervals for the duration of the concentration ramp starting 1 s (pre-asymptote) or 6 s (at asymptote and extended train) prior to the initiating press and extending 9 s after this press. Shading reflects +1 within-sample SEM. X-axis scale bar: 0.5 V and the y-axis scale bar: 0.5 nA. (C) Concatenated, baseline-subtracted dopamine concentration v. time traces (see Methods) were averaged across bins of 10 sequence completions (3 bins/training session), for each rat and then averaged across rats. Dopamine concentration change coded in false color. (D) Average dopamine concentration elevation onset time v. training session number within-subject correlation. (E) Trial-averaged peak dopamine concentration change during sequence execution (preceding the initiating press, after the initial press but prior to the terminating press, or following sequence termination when the reward was delivered and consumed). Dashed line: baseline root mean square (RMS) noise in the dopamine concentration trace in the absence of lever pressing activity. Error bars indicate +1 SEM. *p < 0.05, **p < 0.01, ***p < 0.001. See also Supplementary Figures 1–4 and Supplementary Table 1.
Figure 3
Figure 3. Dopamine correlates of acquisition and performance.
(A) Peak amplitude dopamine response to the unexpectedly earned reward during the first sequence training session (averaged across earned rewards for each rat) v. rate of sequence task acquisition (slope to asymptotic performance) between-subject correlation. (B) Peak amplitude dopamine concentration change within 4 s prior to the initiating press v. time to complete the immediately following sequence within-subject correlation. All 30 sequence completions from each of the two training sessions/phase are included, with session number used as a controlling factor. *p < 0.05.
Figure 4
Figure 4. Dopamine signals following extended training during stereotyped v. atypical sequence paths.
(A) Representative example of continuous (unaveraged, nonconcatenated) dopamine concentration v. time traces for individual sequence performance from the last training session from the same rat for a stereotypical and atypical sequence path trial. Blue arrows: time of initial approach towards initiating lever. Insertion of the terminating lever occurs immediately following the initiating lever press. Red bars: time of reward delivery and consumption. Insets: Averaged CVs taken at 1-s intervals starting 2 s prior to the initiating press and extending 7 s after this press; shading reflects +1 within-sample SEM; x-axis scale bar: 0.5 V, y-axis scale bar: 0.5 nA. (B) Average dopamine concentration v. time trace during action sequence performance at asymptotic performance and during overtraining divided for typical v. atypical path sequences. Shading reflects between-subject SEM.
Figure 5
Figure 5. NAc dopamine response to the most distal predictor of reward.
(A) Average baseline-subtracted dopamine concentration v. time traces surrounding presentation of the session start stimulus (light on and lever extended) for each training session. Dopamine concentration change coded in false color. (B) Representative dopamine concentration v. time trace around the session start cue from the same rat for each phase of training. Inset: background-subtracted CVs from the peak of current for each trace; x-axis scale bar: 0.5 V, y-axis scale bar: 1 nA. (C) Peak dopamine response to session start cue. (D) Peak amplitude dopamine response to session start cue v. average sequence completion time during the extended training phase between-subject correlation. Error bars indicate +1 SEM. *p < 0.05.
Figure 6
Figure 6. Reward preference and discrimination tests.
Reward preference and discriminability tests were conducted in a separate group of rats from those used in the main FSCV study. Control reward: Cont, orange-flavored 12.5% sucrose. Higher value reward: 20%, orange-flavored 20% sucrose. Alternate identity rewards: Grp: Grape-flavored 12.5% sucrose reward; Poly: Polycose solution; Pel; grain-based food pellet; H2O: water. (A) Palatability test; isolated, non-contingent deliveries of each reward delivered in separate test sessions. Because this test requires a liquid reward it was not conducted for the pellet outcome Left: Lick frequency (Licks/second). Y axis truncated at floor lick rate of 3.5 licks/s based. Middle: Average number of licks/reward delivery. Right: Average number of pauses >0.5 s in licking/reward delivery. (B) Preference ratio [alternate reward consumption/(alternate reward consumption +12.5% orange sucrose consumption)] during consumption choice tests. (D) Consumption of the orange-flavored 12.5% sucrose on each of the 3 days it was followed by LiCl-induced nausea. (E) Preference ratios during consumption choice tests following conditioning of taste aversion to orange-flavored 12.5% sucrose. Errors bars indicate +1 SEM. *p < 0.05; ***p < 0.001. See also Supplementary Table 2.
Figure 7
Figure 7. Dopamine signals during reward value expectation violation.
(A) Average baseline-subtracted dopamine concentration v. time traces surrounding presentation of the session start stimulus for the preceding control training session (gray) and the test at which the value of the reward was unexpectedly increased (blue). Shading reflects +1 SEM. (B) Average dopamine concentration v. time trace during action sequence performance for the control training session and value expectation violation test. (C) Single-trial representative (continuous, unaveraged, nonconcatenated) dopamine concentration v. time traces from the same rat during sequence performance after extended training and during value expectation violation. Taken from the 9th sequence completion trial. Red bars: time of reward delivery/consumption. Inset: background-subtracted CV from the peak of current for the test trace; X-axis scale bar: 0.5 V, y-axis scale bar: 0.1 nA. (D) Peak dopamine concentration change during sequence execution. (E) Trial-averaged peak amplitude dopamine concentration change to reward delivery v. latency to reinitiate the sequence following reward consumption (reward collection to next initiating press time) within-subjects correlation. Error bars indicate +1 SEM. *p < 0.05, **p < 0.01, ***p < 0.001. See also Supplementary Figure 5 and Supplementary Table 2.
Figure 8
Figure 8. Dopamine signals during reward identity expectation violation.
Left Panel: Average baseline-subtracted dopamine concentration v. time traces surrounding presentation of the session start stimulus for the preceding control training session (gray) and the tests at which the identity of the reward was altered (green). Shading reflects +1 SEM. Middle Panel: Average dopamine concentration v. time traces during action sequence performance for the control training session and identity expectation violation tests. Red bars: time of reward delivery and consumption. Right Panel: Trial-averaged peak dopamine concentration change during sequence execution. (A) Unexpected change in the flavor of the earned reward (grape-flavored 12.5% sucrose). (B) Unexpected change in the type of caloric liquid (12.5% polycose) (C). Unexpected change to an alternate food type (grain-based food pellet) (D). Unexpected change to a non-food reward (water when 18 hr water deprived). Error bars indicate +1 SEM. See also Supplementary Table 2.

References

    1. Schultz W. Getting formal with dopamine and reward. Neuron 36, 241–263 (2002). - PubMed
    1. Schultz W. Updating dopamine reward signals. Curr Opin Neurobiol 23, 229–238 (2013). - PMC - PubMed
    1. Waelti P., Dickinson A. & Schultz W. Dopamine responses comply with basic assumptions of formal learning theory. Nature 412, 43–48 (2001). - PubMed
    1. Keiflin R. & Janak P. H. Dopamine Prediction Errors in Reward Learning and Addiction: From Theory to Neural Circuitry. Neuron 88, 247–263 (2015). - PMC - PubMed
    1. Day J. J., Roitman M. F., Wightman R. M. & Carelli R. M. Associative learning mediates dynamic shifts in dopamine signaling in the nucleus accumbens. Nat Neurosci 10, 1020–1028 (2007). - PubMed

Publication types