. 2016 Feb 12:7:10728.
doi: 10.1038/ncomms10728.

Mucosal immunoglobulins at respiratory surfaces mark an ancient association that predates the emergence of tetrapods

Affiliations

Mucosal immunoglobulins at respiratory surfaces mark an ancient association that predates the emergence of tetrapods

Zhen Xu et al. Nat Commun. .

Abstract

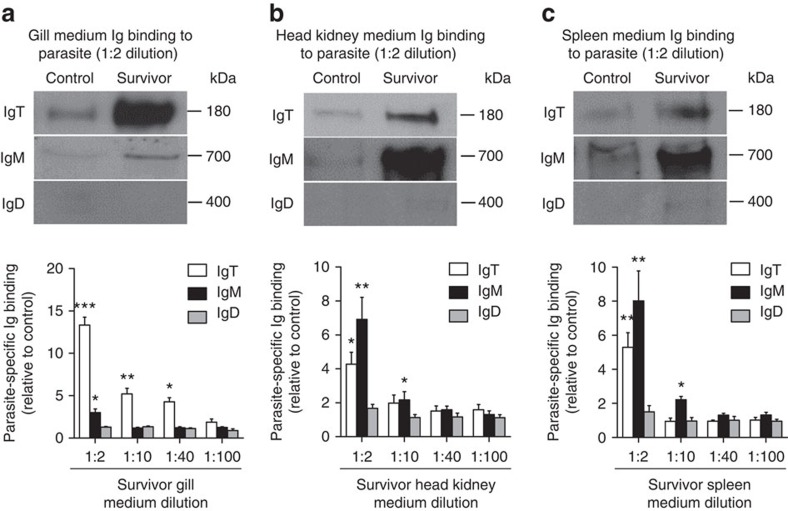
Gas-exchange structures are critical for acquiring oxygen, but they also represent portals for pathogen entry. Local mucosal immunoglobulin responses against pathogens in specialized respiratory organs have only been described in tetrapods. Since fish gills are considered a mucosal surface, we hypothesized that a dedicated mucosal immunoglobulin response would be generated within its mucosa on microbial exposure. Supporting this hypothesis, here we demonstrate that following pathogen exposure, IgT(+) B cells proliferate and generate pathogen-specific IgT within the gills of fish, thus providing the first example of locally induced immunoglobulin in the mucosa of a cold-blooded species. Moreover, we demonstrate that gill microbiota is predominantly coated with IgT, thus providing previously unappreciated evidence that the microbiota present at a respiratory surface of a vertebrate is recognized by a mucosal immunoglobulin. Our findings indicate that respiratory surfaces and mucosal immunoglobulins are part of an ancient association that predates the emergence of tetrapods.


Figures

Figure 1
Figure 1. Protein characterization of gill mucus immunoglobulins and identification of B cells in the gill of trout.
(a) Fractionation of gill mucus (∼0.5 ml) by gel filtration (upper) followed by immunoblot analysis of the fractions with anti-trout IgM, anti-trout IgD and anti-trout IgT-specific mAbs (lower). A280, absorbance at 280 nm. (b) SDS–PAGE of gel-filtration fractions (4–15%) corresponding to elution volumes of 8.5 and 11.5 ml under non-reducing conditions followed by immunoblot analysis with mAbs to trout IgM, IgD or IgT. (c,d) Immunoblot and densitometric analysis of the concentration of IgT, IgM and IgD in gill mucus (c) and serum (d) (n=15 fish). (e,f) Ratio of IgT to IgM concentration (e) and IgD to IgM concentration (f) in gill mucus and serum, calculated from the values shown in c,d. (g) Dot plots of leucocytes from gills. Numbers adjacent to outlined areas indicate percentage IgT+ B cells, IgM+ B cells or IgD+ B cells in the lymphocyte gate. (h) Frequency of IgT+ and IgM+IgD+ B cells among total B cells. Results in ce and h are expressed as mean and s.e.m. obtained from 15 individual fishes.
Figure 2
Figure 2. Trout gill bacteria are predominantly coated with IgT.
(a) Representative flow cytometry histograms showing the staining of gill bacteria with IgT, IgM and IgD. Bacteria were stained with anti-trout IgT (green line), anti-trout IgM (red line) or anti-trout IgD (magenta line) mAbs or isotype controls (shaded histograms). (b,c) Percentage of gill bacteria coated with IgT, IgM or IgD (b) or coated with IgT and IgM, IgT and IgD, IgM and IgD, IgT and IgM and IgD (n=16) (c). The median percentage is shown by a red line. Statistical differences were evaluated by the nonparametric Mann–Whitney test. (d) Differential interference contrast (DIC) images of gill bacteria stained with a DAPI-Hoeschst solution (blue), anti-IgT (green), anti-IgM (red) or anti-IgD (magenta), and merging IgT, IgM and IgD stainings (Merge). (Isotype-matched control antibody staining is shown in Supplementary Fig. 3 online). (Scale bars, 5 μm). (e) Immunoblot analysis of IgT, IgM and IgD on gill bacteria. Lane 1, 0.1 μg of purified IgT, IgM or IgD; lanes 2–7, gill bacteria (n=6 fish). (f) Percentage of total gill mucus IgT, IgM or IgD coating gill bacteria (n=13). The median is shown by a red line. Statistical differences were evaluated by one-way ANOVA with Bonferroni correction. Data are representative of at least three independent experiments. ANOVA, analysis of variance.
Figure 3
Figure 3. Parasites are mainly coated by IgT in the gill of infected trout.
Four different microscope images (ad) of slides showing immunofluorescence staining of Ich parasites in gill cryosections from trout infected with Ich after 25 days (n=6). From left to right: Ich (magenta), IgM (red) and IgT (green) with nuclei stained with DAPI (blue); DIC images showing merged staining (isotype-matched control antibody staining, Supplementary Fig. 4a online). Scale bars, 20 μm.
Figure 4
Figure 4. Increases in IgT+ B cells in the gill of trout infected with Ich.
(ac) DIC images of immunofluorescence staining on trout gill cryosections from uninfected fish (a), 25 days infected fish (b) and survivor fish (c, upper), stained for IgT (green) and IgM (red); nuclei are stained with DAPI (blue) (isotype-matched control antibody staining, Supplementary Fig. 4b online). Enlarged images of the areas outlined in c are showing some IgT+ B cells possibly secreting IgT (white arrowhead, c, lower). Primary lamellae (PL) and secondary lamellae (SL) are shown. Scale bars, 20 μm. Data are representative of at least three different independent experiments (n=8–9 per group). (d) Percentage of gill IgT+ and IgM+IgD+ B cells in the lymphocyte gate of uninfected control fish, infected fish and survivor fish measured by flow cytometric analysis. (e,f) Concentration of IgT, IgM and IgD in gill mucus (e) and serum (f) of control, infected and survivor fish (n=12 per group). **P<0.01 and ***P<0.001 (one-way ANOVA with Bonferroni correction). Data in df are representative of at least three independent experiments (mean and s.e.m.). ANOVA, analysis of variance.
Figure 5
Figure 5. Immunoglobulin responses in the gill mucus and serum from infected and survivor fish.
(a) Western blot analysis of IgT-, IgM- and IgD-specific binding to Ich in gill mucus (dilution 1:2) from infected and survivor fish. (b,c) IgT-, IgM- and IgD-specific binding to Ich in dilutions of gill mucus from infected (b) and survivor (c) fish, evaluated by densitometric analysis of immunoblots and presented as relative values to those of control fish (n=9 per group). (d) Western blot analysis of IgT-, IgM- and IgD-specific binding to Ich in serum (dilution 1:10) from infected and survivor fish. (e,f) IgT-, IgM- and IgD-specific binding to Ich in dilutions of serum from infected (e) and survivor (f) fish, evaluated by densitometric analysis of immunoblots and presented as relative values to those of control fish (n=9 per group). *P<0.05, **P<0.01 and ***P<0.001 (unpaired Student's t-test). Data are representative of at least three independent experiments (mean and s.e.m.).
Figure 6
Figure 6. Proliferative responses of IgT+ and IgM+ B cells in the gill of fish that survived Ich infection.
(a,b) Representative flow cytometry dot plot showing proliferation of IgT+ B cells (a) and IgM+ B cells (b) in gill leucocytes of control and survivor fish. The percentage of lymphocytes representing proliferative B cells (EdU+) is shown in each dot plot. (c) Percentage of EdU+ cells from the total gill IgT+ or IgM+ B-cell populations in control or survivor fish (n=12). (d,e) Immnofluorescence analysis of EdU incorporation by IgT+ or IgM+ B cells in gill of control (d) and survivor fish (e). Gill cryosections were stained for EdU (magenta), trout IgT (green), trout IgM (red) and nuclei (blue) detection (n=9). Primary lamellae (PL) and Secondary lamellae (SL) are shown. White arrowheads point to cells double stained for EdU and IgT. Scale bars, 20 μm. Data are representative of at least three different independent experiments. (f) Percentage of EdU+ cells from the total gill IgT+ or IgM+ B-cell populations in control or survivor fish counted from d,e. Data in c and f are representative of at least three independent experiments (mean and s.e.m.). Statistical analysis was performed by unpaired Student's t-test. ***P<0.001.
Figure 7
Figure 7. Local IgT-, IgM- and IgD-specific responses in gill explants of survivor fish.
Gill, head kidney and spleen explants (∼50 mg each) from control and survivor fish were cultured for 7 days. (ac) Western blot analysis of IgT-, IgM- and IgD-specific binding to Ich in the culture medium of gill (a, upper), head kidney (b, upper) and spleen (c, upper) (dilution 1:2) from control and survivor fish. (ac) IgT-, IgM- and IgD-specific binding to Ich in dilutions of culture medium from gill (a, lower), head kidney (b, lower) and spleen (c, lower) from control and survivor fish, measured by densitometric analysis of immunoblots and presented as relative values to those of control fish (n=9–12 per group). *P<0.05, **P<0.01 and ***P<0.001 (unpaired Student's t-test). Data are representative of at least three independent experiments (mean and s.e.m.).
Figure 8
Figure 8. Trout pIgR associates with gill sIgs.
(a) SDS–PAGE under reducing conditions of trout serum and gill mucus (∼5 μg each), followed by immunoblot analysis using anti-trout pIgR antibody. (b) Co-immunoprecipitation (CoIP) of gill mucus with anti-trout IgT antibody, followed by immunoblot analysis (IB) under reducing conditions (pIgR detection, upper panels) or non-reducing conditions (IgT detection, lower panels). (c) CoIP of gill mucus with rabbit anti-trout pIgR followed by IB under non-reducing conditions (IgT detection, upper panels) and reducing conditions (pIgR detection, lower panels). IgG purified from rabbit's serum before immunization (Pre-bleed) served as negative control for rabbit anti-trout pIgR and rabbit anti- trout IgT, respectively (left lane on each panel for b,c). (d) Immunofluorescence staining for pIgR with IgT in gill cryosections of rainbow trout. Differential interference contrast images of gill cryosections were stained with anti-trout pIgR (magenta), anti-trout IgT (green) and DAPI for nuclei (blue) (n=9). (isotype-matched control antibodies for anti-pIgR in Supplementary Fig. 4c online) (e) Enlarged sections of the areas outlined in d without DIC showing some pIgR/IgT colocalization (white arrowhead). Scale bars, 20 μm. Primary lamellae (PL) and secondary lamellae (SL) are shown. Data are representative of at least three independent experiments.
Figure 9
Figure 9. Proposed model of local IgT and IgT+ B-cell induction in the gills.
(a) Scheme of a typical teleost gill filament displaying the primary (PL) and secondary (SL) lamellae. (b) Induction of local IgT responses in the gill based on our findings. On Ich infection, Ich antigen (Ag) are taken up by antigen-presenting cells (APC) and presented to naive CD4-T cells. B cells are then activated by Ag-specific CD4-T cells and start proliferating. Activated B cells may differentiate further into plasmablasts or plasma cells to produce large amounts of parasite-specific IgT that recognize Ich within the gill PLs or the Ich present in the mucus. We cannot rule out the possibility that on antigen uptake, loaded gill APCs may migrate into central secondary lymphoid organs (that is, spleen or head kidney) where the resulting activated IgT+ B cells may then home into the gill. Alternatively, since gills are highly vascularized, antigens from parasite debris may travel from the gills into the lymphoid tissues through the vascular system, where they could be taken up by systemic APCs to initiate an immune response. In the potential scenarios (as indicated by a ?) where immune responses develop in the spleen or head kidney, we propose that IgT+ B-cell proliferation does not occur in the spleen or head kidney because in Supplementary Fig. 9 we do not detect differences in IgT+ B-cell proliferative responses between control and survivor fish. This would suggest that if activated IgT+ B cells are generated in the spleen or head kidney, then they are probably imprinted to home into the gills where they may then proliferate. (c) IgT produced by IgT-secreting B cells is transported from the epithelium into the mucus layer (grey colour) by the tpIgR. The microbiota contained in the mucus is predominantly coated by sIgT.

Similar articles

Cited by

References

    1. Maina J. N. Structure, function and evolution of the gas exchangers: comparative perspectives. J. Anat. 201, 281–304 (2002). - PMC - PubMed
    1. Glover C. N., Bucking C. & Wood C. M. The skin of fish as a transport epithelium: a review. J. Comp. Physiol. B 183, 877–891 (2013). - PubMed
    1. Aquilino C., Castro R., Fischer U. & Tafalla C. Transcriptomic responses in rainbow trout gills upon infection with viral hemorrhagic septicemia virus (VHSV). Dev. Comp. Immunol. 44, 12–20 (2014). - PubMed
    1. Pennacchi Y., Leef M. J., Crosbie P. B., Nowak B. F. & Bridle A. R. Evidence of immune and inflammatory processes in the gills of AGD-affected Atlantic salmon, Salmo salar L. Fish Shellfish Immunol. 36, 563–570 (2014). - PubMed
    1. Valenzuela-Miranda D., Boltana S., Cabrejos M. E., Yanez J. M. & Gallardo-Escarate C. High-throughput transcriptome analysis of ISAV-infected Atlantic salmon Salmo salar unravels divergent immune responses associated to head-kidney, liver and gills tissues. Fish Shellfish Immunol. 45, 367–377 (2015). - PubMed

Publication types

MeSH terms

LinkOut - more resources