. 2016 Apr;170(4):2172-86.
doi: 10.1104/pp.15.01667. Epub 2016 Feb 11.

expVIP: a Customizable RNA-seq Data Analysis and Visualization Platform

Affiliations

expVIP: a Customizable RNA-seq Data Analysis and Visualization Platform

Philippa Borrill et al. Plant Physiol. 2016 Apr.

Abstract

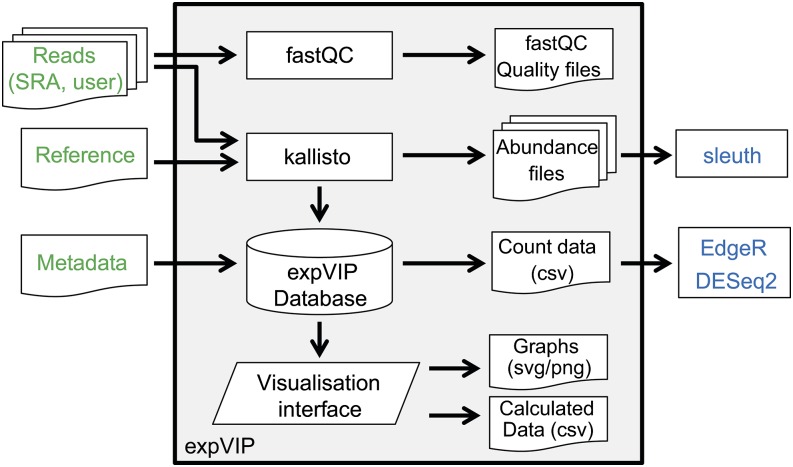
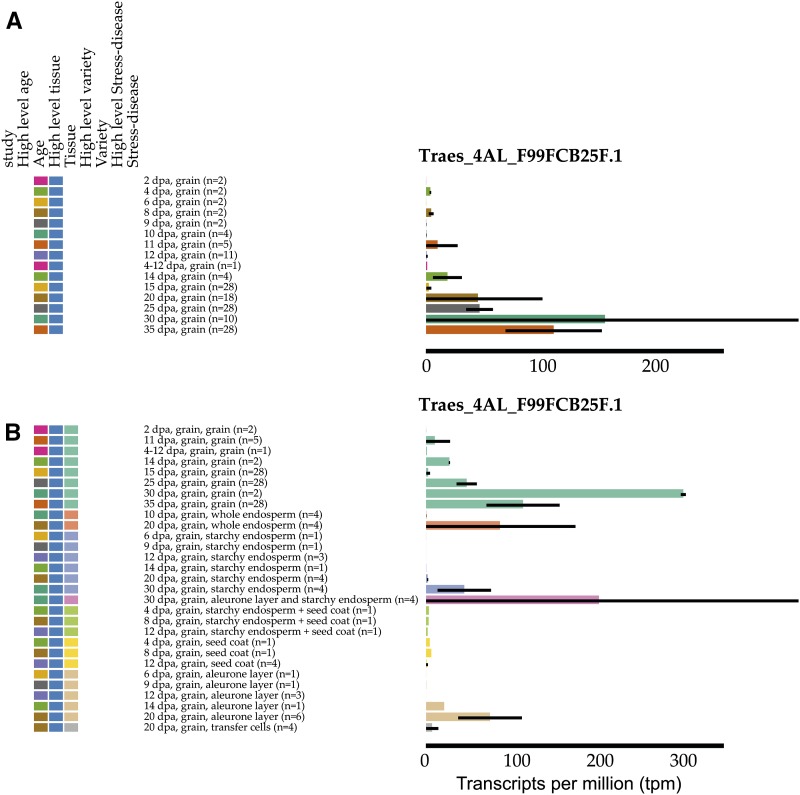
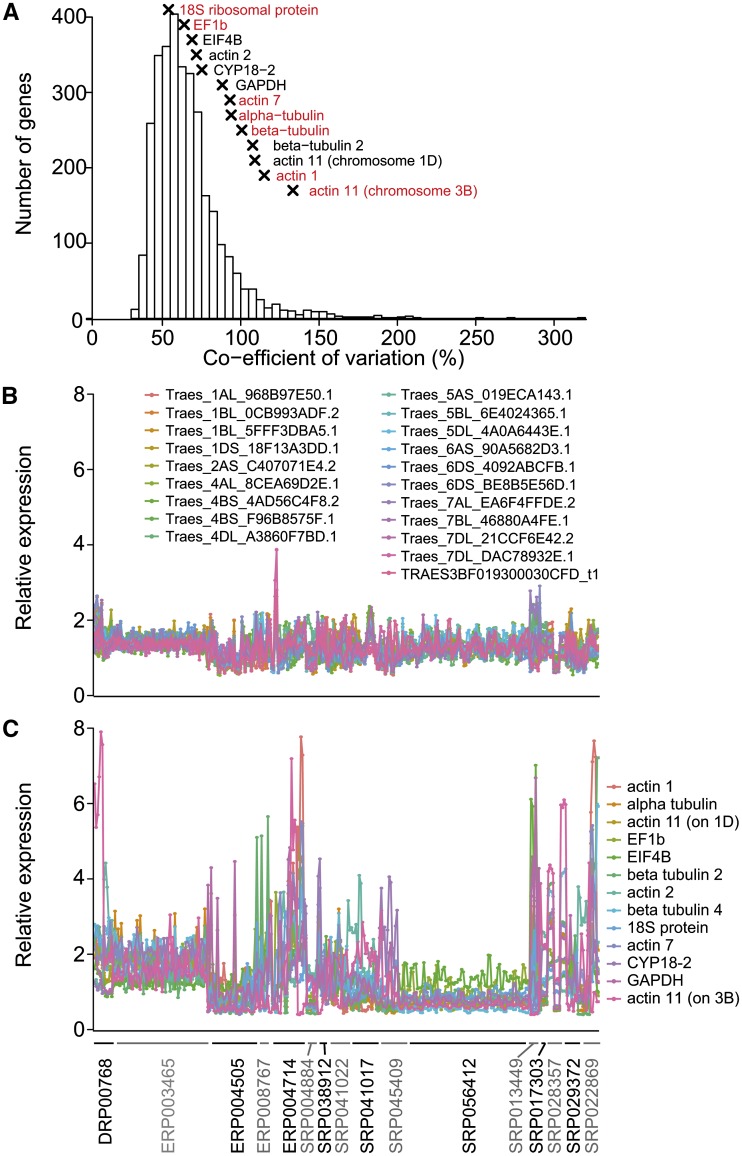
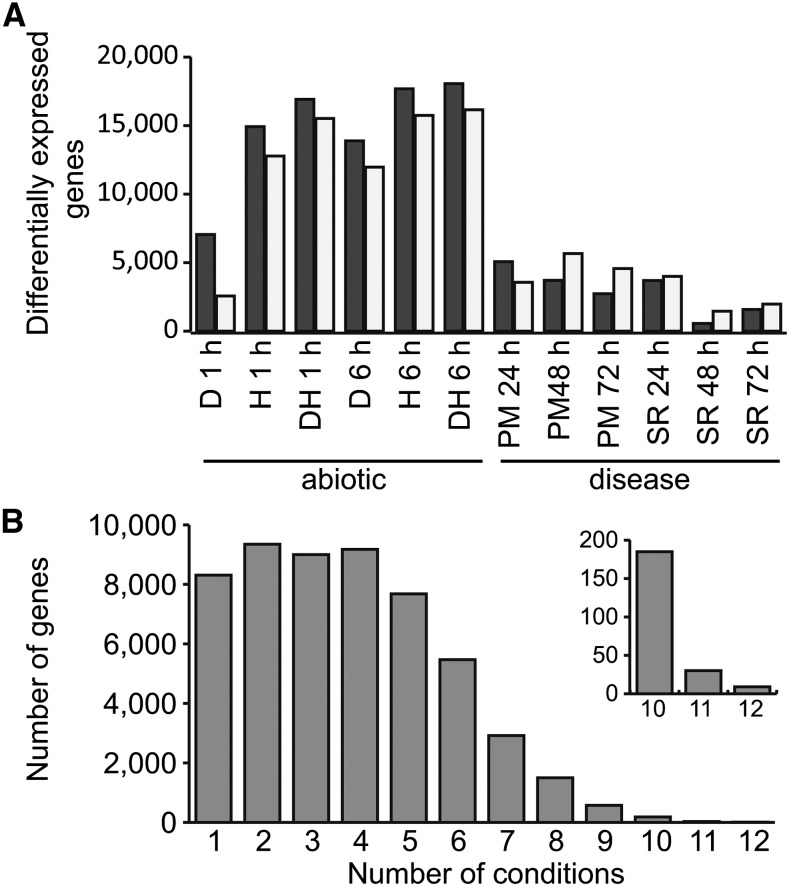
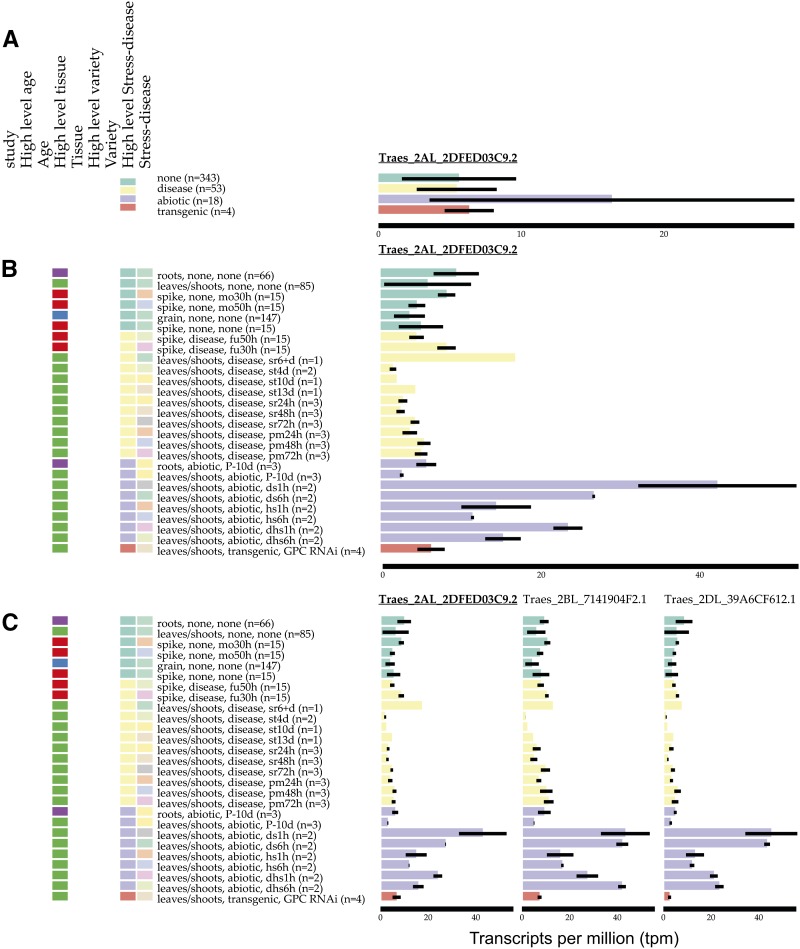
The majority of transcriptome sequencing (RNA-seq) expression studies in plants remain underutilized and inaccessible due to the use of disparate transcriptome references and the lack of skills and resources to analyze and visualize these data. We have developed expVIP, an expression visualization and integration platform, which allows easy analysis of RNA-seq data combined with an intuitive and interactive interface. Users can analyze public and user-specified data sets with minimal bioinformatics knowledge using the expVIP virtual machine. This generates a custom Web browser to visualize, sort, and filter the RNA-seq data and provides outputs for differential gene expression analysis. We demonstrate expVIP's suitability for polyploid crops and evaluate its performance across a range of biologically relevant scenarios. To exemplify its use in crop research, we developed a flexible wheat (Triticum aestivum) expression browser (www.wheat-expression.com) that can be expanded with user-generated data in a local virtual machine environment. The open-access expVIP platform will facilitate the analysis of gene expression data from a wide variety of species by enabling the easy integration, visualization, and comparison of RNA-seq data across experiments.


Figures

Figure 1.
Figure 1.
Implementation of expVIP. User inputs are highlighted in green. Downstream differential gene expression analysis (blue) can be performed on expVIP outputs, which are preformatted for this use. External programs are in rectangles, document symbols represent inputs and outputs, the trapezoid represents the visualization interface, and the cylinder represents the expVIP relational database.
Figure 2.
Figure 2.
Similarity of expression profiles between samples (columns), with replicate samples averaged and excluding samples from nullitetrasomic lines. One thousand randomly selected genes are represented, one gene per row. Only genes expressed in at least one sample over 2 tpm were used. Colors on the dendrogram indicate the tissues from which samples originate: grain (red), spike excluding grain (blue), leaves/stem (green), and roots (gray).
Figure 3.
Figure 3.
Expression of genes with three homeologous copies on chromosome 1 in nullitetrasomic wheat lines in shoots and roots. Genotypes for chromosome 1 are indicated by colored squares: A genome in green, B genome in blue, and D genome in purple. Squares listed at bottom (+) indicate extra copies (tetra); the absence of squares indicates deletion (nulli) of the entire chromosome.
Figure 4.
Figure 4.
A simple search on www.wheat-expression.com reveals gene expression patterns of six candidate genes within a quantitative trait locus region for preharvest sprouting. The data may be displayed as a heat map for all six genes simultaneously (A), with the intensity of the blue color indicating the expression level [log2(tpm)]. Alternatively, each gene may be displayed individually as a bar graph (B) in tpm. The display was configured to average data according to the high-level tissue; hence, all samples coming from spike (red), grain (blue), leaves/shoots (green), and roots (purple) are averaged according to their respective categories. Genes are ordered from lowest expressed (left [A] and top [B]) to highest expressed (right [A] and bottom [B]). Note that axes in B are not equal because expVIP recalculates the axis for each gene individually.
Figure 5.
Figure 5.
Expression of Traes_4AL_F99FCB25F.1 in grains categorized by age (A) and age and tissue (B). The colors represent age (A) or tissue (B): the color coding of the graph is determined by the most recent category clicked by the user.
Figure 6.
Figure 6.
Stability of gene expression between samples. A, Coefficient of variation for genes that are expressed at over 2 tpm in all samples. Commonly used reference genes are indicated by crosses (x), and reference genes in red are not expressed at over 2 tpm in all samples. B and C, Expression of the 20 most stably expressed genes (B) and 13 commonly used reference genes (C) across 321 wheat samples belonging to 16 studies indicated on the x axis. The expression level of each gene in a sample is relative to the average expression level of this gene across all samples. Abbreviations are as follows: elongation factor 1-β (EF1b), eukaryotic translation initiation factor 4B (EIF4B), cylophilin A (CYP18-2), and glyceraldehyde 3-phosphate dehydrogenase (GAPDH).
Figure 7.
Figure 7.
Differentially expressed genes (q < 0.05) in abiotic stress and disease conditions. A, Numbers of up-regulated genes (black bars) and down-regulated genes (gray bars) in individual stress conditions. D, Drought; H, heat; DH, drought and heat combined; PM, powdery mildew; SR, stripe rust. B, Number of genes that are differentially expressed in multiple abiotic stress and disease conditions.
Figure 8.
Figure 8.
Example of gene expression visualization using expVIP for the gene Traes_2AL_2DFED03C9.2, with samples grouped according to their High level stress-disease (A), Traes_2AL_2DFED03C9.2, with additional categorization of samples including lower level Stress-disease and High level tissue (B), and Traes_2AL_2DFED03C9.2 and its B and D homeologues, which are differentially expressed in 11 and 12 abiotic and disease conditions, respectively (C). The data shown here include expression data from all studies, not just the studies examined for differential expression. Samples are ordered by their High level stress-disease status: none (green), disease (yellow), abiotic (purple), and transgenic (orange).

References

    1. Andersson I, Backlund A (2008) Structure and function of Rubisco. Plant Physiol Biochem 46: 275–291 - PubMed
    1. Andrews S. (2010) FastQC: a quality control tool for high throughput sequence data. http://www.bioinformatics.babraham.ac.uk/projects/fastqc (September 9, 2015)
    1. Avraham S, Tung CW, Ilic K, Jaiswal P, Kellogg EA, McCouch S, Pujar A, Reiser L, Rhee SY, Sachs MM, et al. (2008) The Plant Ontology Database: a community resource for plant structure and developmental stages controlled vocabulary and annotations. Nucleic Acids Res 36: D449–D454 - PMC - PubMed
    1. Barrero JM, Cavanagh C, Verbyla KL, Tibbits JF, Verbyla AP, Huang BE, Rosewarne GM, Stephen S, Wang P, Whan A, et al. (2015) Transcriptomic analysis of wheat near-isogenic lines identifies PM19-A1 and A2 as candidates for a major dormancy QTL. Genome Biol 16: 93. - PMC - PubMed
    1. Bevan MW, Uauy C (2013) Genomics reveals new landscapes for crop improvement. Genome Biol 14: 206. - PMC - PubMed

Publication types

LinkOut - more resources