. 2016 Feb 3:10:14.
doi: 10.3389/fncel.2016.00014. eCollection 2016.

BID Mediates Oxygen-Glucose Deprivation-Induced Neuronal Injury in Organotypic Hippocampal Slice Cultures and Modulates Tissue Inflammation in a Transient Focal Cerebral Ischemia Model without Changing Lesion Volume

Affiliations

BID Mediates Oxygen-Glucose Deprivation-Induced Neuronal Injury in Organotypic Hippocampal Slice Cultures and Modulates Tissue Inflammation in a Transient Focal Cerebral Ischemia Model without Changing Lesion Volume

Nellie Anne Martin et al. Front Cell Neurosci. .

Abstract

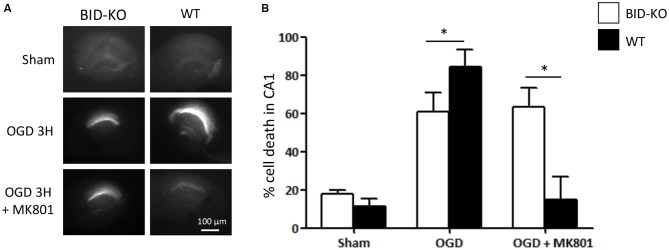
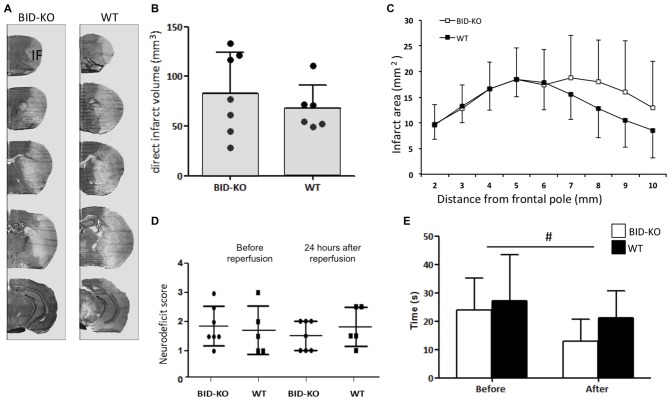
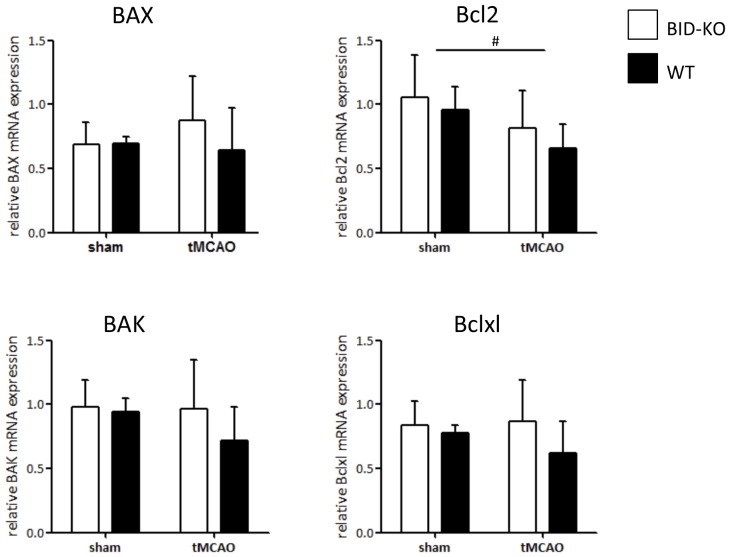
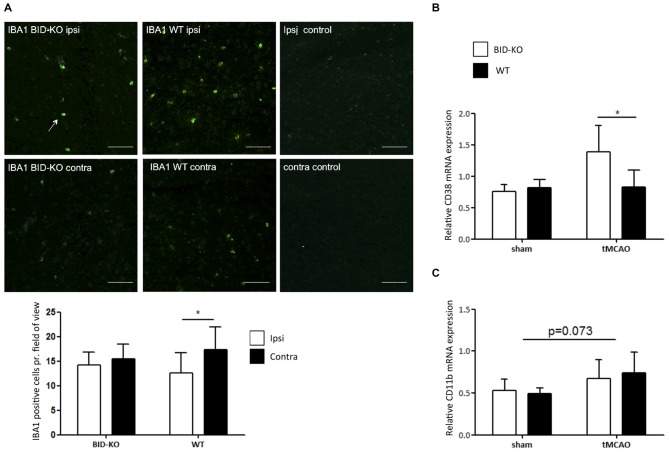
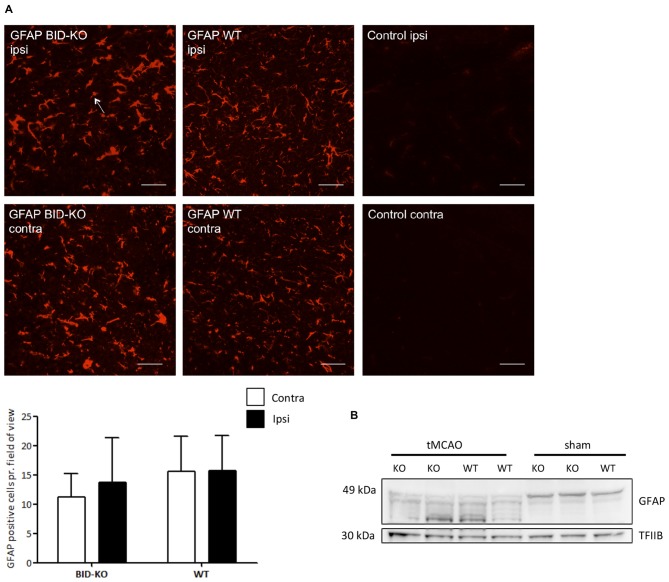
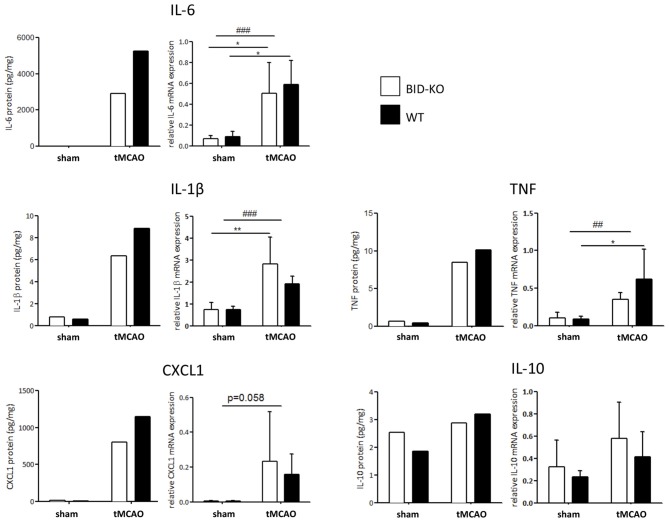
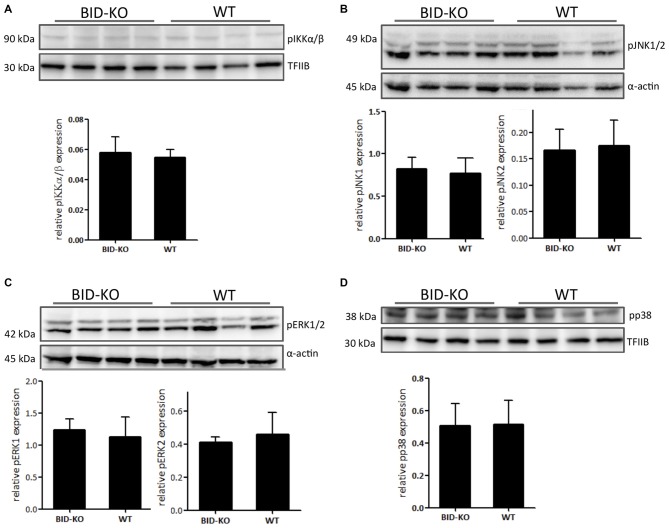
The BH3 interacting-domain death agonist (BID) is a pro-apoptotic protein involved in death receptor-induced and mitochondria-mediated apoptosis. Recently, it has also been suggested that BID is involved in the regulation of inflammatory responses in the central nervous system. We found that BID deficiency protected organotypic hippocampal slice cultures in vitro from neuronal injury induced by oxygen-glucose deprivation. In vivo, BID-knockout (KO) mice and wild type (WT) mice were subjected to 60 min of transient middle cerebral artery occlusion (tMCAO) to induce focal cerebral ischemia, and allowed to recover for 24 h. Infarct volumes and functional outcome were assessed and the inflammatory response was evaluated using immunofluorescence, Western blotting, quantitative PCR (qPCR) and Mesoscale multiplex analysis. We observed no difference in the infarct volume or neurological outcome between BID-KO and WT mice. The inflammatory response was reduced by BID deficiency as indicated by a change in microglial/leukocyte response. In conclusion, our data suggest that BID deficiency is neuroprotective in an in vitro model and modulates the inflammatory response to focal cerebral ischemia in vivo. However, this is not translated into a robust neuroprotection in vivo.

Keywords: BID; focal cerebral ischemia; inflammation; neuronal injury; organotypic hippocampal slice cultures.


Figures

Figure 1
Figure 1
BID deletion in the applied knockout (KO) strain. Representative PCR amplification of genomic DNA at the deleted bid gene locus by bid genotyping reveals the appropriate PCR bands. M: 100 base pair ladder; NC, negative control without the tail DNA template.
Figure 2
Figure 2
Organotypic hippocampal slice cultures (OHSCs) isolated from BID deficient mice show protection in response to oxygen-glucose deprivation (OGD). The slices were sham-exposed or subjected to OGD conditions for 180 min in the absence or the presence of 10 μM MK-801 and allowed to recover for 24 h. (A) Representative images of OHSCs derived from BID-KO and WT mice. (B) Quantification of injury assessed by PI staining 24 h post-treatment in the CA1 subfield of the hippocampal slices. In the absence of MK-801, BID deficiency protected against neuronal injury (*p = 0.024). Note the protection exerted by MK-801 against OGD-induced neuronal injury of WT OHSCs. In BID-KO slice cultures MK-801 failed to reduce OGD-induced neuronal injury. Scale bar: 100 μm, (n = 3–7 in each group, 2-way ANOVA, mean ± SD).
Figure 3
Figure 3
Cerebrovascular anatomy. (A) The territory of the middle cerebral artery (MCA) was measured as the distance from the line of anastomoses between the MCA and the anterior cerebral artery (ACA) to the midline at 2, 4 and 6 mm from the frontal pole. The cerebrovascular anatomy was analyzed by visualizing the arteries with cresyl violet solution. We observed no significant difference between BID-KO mice and WT mice at any of these three sites (p = 0.96, n = 10–13 in each group, 2-way ANOVA mean ± SD). (B) The diameters of the posterior communicating arteries (PcomAs) were measured at the widest part and the values were calculated as a percentage of the basilar artery (BA) diameter. We found no significant difference between the two groups of mice (p = 0.11, n = 10–13 in each group, non-paired t-test, mean ± SD). SCA: Superior cerebellar artery.
Figure 4
Figure 4
BID deficiency does not affect infarct formation or improves functional outcome after tMCAO. (A) Representative cresyl violet stained coronal sections of brains from BID-KO mice and WT mice. IF: Infarct. (B) Direct infarct volume estimations showed no significant difference in infarct volume between BID-KO mice and WT mice (p = 0.45, non-paired t-test). (C) This was also true for the rostrocaudale distribution analyses (p = 0.45, n = 6–7 in each group, mean ± SD). (D) To evaluate the neurodeficit of mice we applied a scoring system from 0–4. We did not see a difference either before or after reperfusion (p = 0.73), just as no difference was observed between BID-KO mice and WT mice at any of the two time points (p = 0.52, n = 6–7 in each group, 2-way ANOVA, mean ± SD). (E) Mice spent significantly less time on the vertical rope 24 h following reperfusion compared to before surgery (#p = 0.013), however, there was no difference between the two groups of mice at any of the time points (p = 0.29, n = 6–7 in each group, 2-way ANOVA, mean ± SD).
Figure 5
Figure 5
mRNA expression of downstream regulators of mitochondrial mediated apoptosis. The mRNA level of BAX, BAK, Bcl2 and Bclxl was examined by qPCR on whole brain lysates and compared between BID-KO mice and WT mice exposed to tMCAO or sham surgery. We found no significant difference between BID-KO mice and WT mice for any of the examined mitochondrial apoptosis regulator genes. Overall the direction of expression was however similar for all four examined genes after tMCAO with the highest expression level found in BID-KO mice (BAK: p = 0.34, BAX: p = 0.44, Bcl2: 0.33, Bclxl: p = 0.25, n = 3 in each sham group, n = 5–6 in each tMCAO group, mean ± SD). There was a significantly lower Bcl2 expression level in tMCAO mice compared to sham mice (#p = 0.047), but not for BAX, BAK or Bclxl (p = 0.65, p = 0.42, p = 0.63 respectively, n = 3 in each sham group, n = 5–6 in each tMCAO group, non-paired t-test, mean ± SD).
Figure 6
Figure 6
Microglial/leukocyte response after transient middle cerebral artery occlusion (tMCAO). (A) IBA1 staining of ipsilateral and contralateral hemisphere of one representative BID-KO and WT mouse exposed to tMCAO. We observed no significant difference in the number of IBA1+ cells per field of view between BID-KO mice and WT mice exposed to tMCAO on the contralateral hemisphere or the ipsilateral hemisphere (p = 0.93), however, in the brains of WT mice, the expression was significantly higher in the ipsilateral hemisphere compared to the contralateral hemisphere (*p = 0.017). This difference was not observed in the brains of BID-KO mice. The white arrow marks an IBA1 positive cell. The pictures were taken from normal appearing cortex. Scale bars: 60 μm (n = 5–6 in each group, 2-way ANOVA, mean ± SD). (B) The relative mRNA expression of CD38 was significantly higher in BID-KO mice compared to WT mice exposed to tMCAO 24 h after surgery (*p = 0.05, n = 3 in each sham group, n = 5–6 in each tMCAO group, 2-way ANOVA, mean ± SD). (C) The relative mRNA expression level of CD11b was not quite upregulated 24 h after surgery (p = 0.073), and there was no significant difference between BID-KO and WT sham mice or between BID-KO and WT tMCAO mice (p = 0.87, n = 3 in each sham group, n = 5–6 in each tMCAO group, 2-way ANOVA, mean ± SD).
Figure 7
Figure 7
Astrocyte response after transient middle cerebral artery occlusion (tMCAO). (A) When we compared the number of GFAP positive cells per field of view between BID-KO mice and WT mice exposed to tMCAO, we found no difference between the ipsilateral and the contralateral hemisphere of either of the two groups of mice (p = 0.52) or between the two groups of mice at any of the hemispheres (p = 0.23). The white arrow marks a GFAP positive cell. The pictures were taken in the normal appearing cortex. Scale bars: 30 μm (n = 5–6 in each group, 2-way ANOVA, mean ± SD). (B) Western blot performed on whole brain lysate showed an activation of GFAP in both BID-KO mice and WT mice exposed to tMCAO as indicated by the expression pattern of the various isotypes of GFAP compared to sham mice.
Figure 8
Figure 8
Expression of cytokines and chemokines. The expression level of various cytokines and chemokines were evaluated on protein level by mesoscale multiplex analysis of pooled samples (pool from 3 mice in each sham group, and 5–6 mice in each tMCAO group), and on mRNA by qPCR of non-pooled samples. As expected, the expression was generally elevated after tMCAO on both protein and mRNA level (*p < 0.05, **p < 0.01, ##p < 0.01, ###p < 0.001). When comparing the expression between the two groups of mice after tMCAO there was an overall reduction in protein levels in the BID-KO mice compared to WT mice. The biggest reduction of expression in BID-KO mice was found for IL-6 which was reduced by ~45%. For CXCL1 protein the expression was reduced by ~30%, IL-1β protein by ~28%, TNF protein by ~16% and IL-10 protein by ~9%. However, all cytokines and chemokines were not reduced in BID-KO mice compared to WT mice on mRNA level, and there was no significant difference for any of the examined cytokines and chemokines (IL-6: p = 0.65, IL-1β: p = 0.27, CXCL1: p = 0.7, TNF: p = 0.33, IL-10: p = 0.33, 2-way ANOVA, mean ± SD).
Figure 9
Figure 9
Expression of phosphorylated signaling pathway components. (A) The level of phosphorylated NF-κB upstream kinase IKKα/β was compared by Western blotting and subsequent densitometry between BID-KO mice and WT mice on whole brain lysates 24 h after tMCAO. We found no difference between the two groups of mice (p = 0.63). (B) This was also true for the phosphorylated MAP kinases JNK1/2 (pJNK1: p = 0.69, pJNK2: p = 0.78), (C) ERK1/2 (pERK1: p = 0.57, pERK2: p = 0.5), and (D) p38 (p = 0.93). Probing for α-actin or TFIIB served as loading control (n = 4 in each group, non-paired t-test, mean ± SD).

Similar articles

Cited by

References

    1. Astrup J., Siesjö B. K., Symon L. (1981). Thresholds in cerebral ischemia–the ischemic penumbra. Stroke 12, 723–725. 10.1161/01.str.12.6.723 - DOI - PubMed
    1. Bonner H. P., Concannon C. G., Bonner C., Woods I., Ward M. W., Prehn J. H. (2010). Differential expression patterns of Puma and Hsp70 following proteasomal stress in the hippocampus are key determinants of neuronal vulnerability. J. Neurochem. 114, 606–616. 10.1111/j.1471-4159.2010.06790.x - DOI - PubMed
    1. Brooks S. P., Dunnett S. B. (2009). Test to assess motor phemotype in mice: a user’s guide. Nat. Rev. Neurosci. 10, 519–529. 10.1038/nrn2652 - DOI - PubMed
    1. Broughton B. R. S., Reutens D. C., Sobey C. G. (2009). Apoptotic mechanisms after cerebral ischemia. Stroke 40, e331–e339. 10.1161/STROKEAHA.108.531632 - DOI - PubMed
    1. Carlson N. G., Wieggel W. A., Chen J., Bacchi A., Rogers S. W., Gahring L. C. (1999). Inflammatory cytokines IL-1 alpha, IL-1 beta, IL-6 and TNF-alpha impart neuroprotection to an excitotoxin through distinct pathways. J. Immunol. 163, 3963–3968. - PubMed