. 2015 Oct 4;2(11):1705-17.
doi: 10.1016/j.ebiom.2015.09.041. eCollection 2015 Nov.

Metabolic Catastrophe in Mice Lacking Transferrin Receptor in Muscle

Affiliations

Metabolic Catastrophe in Mice Lacking Transferrin Receptor in Muscle

Tomasa Barrientos et al. EBioMedicine. .

Abstract

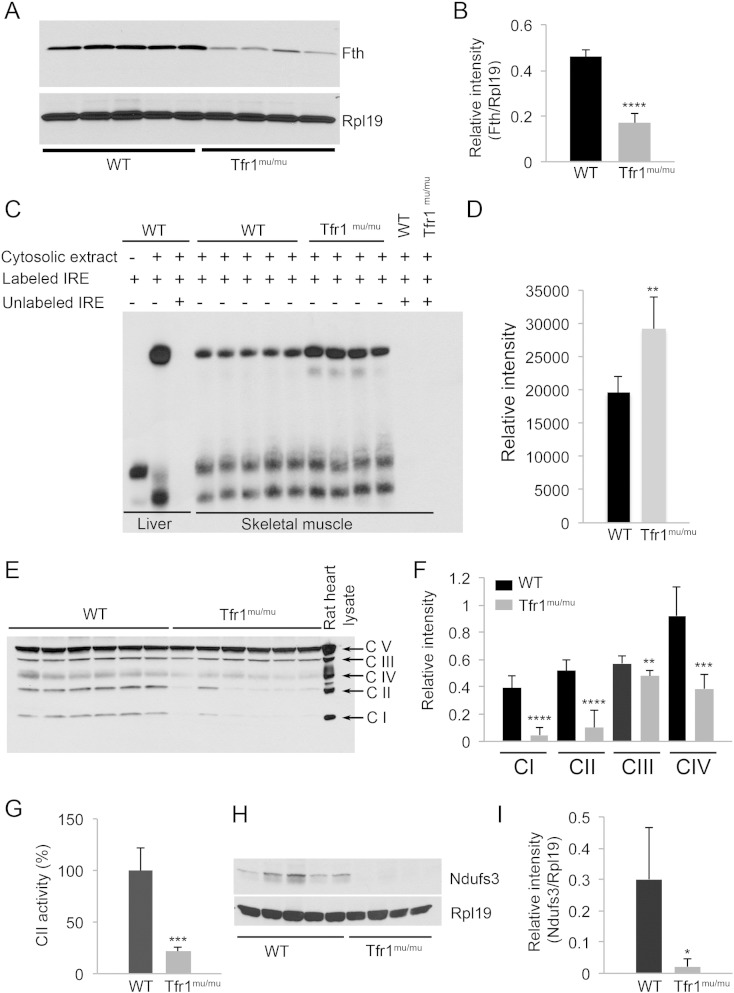
Transferrin receptor (Tfr1) is ubiquitously expressed, but its roles in non-hematopoietic cells are incompletely understood. We used a tissue-specific conditional knockout strategy to ask whether skeletal muscle required Tfr1 for iron uptake. We found that iron assimilation via Tfr1 was critical for skeletal muscle metabolism, and that iron deficiency in muscle led to dramatic changes, not only in muscle, but also in adipose tissue and liver. Inactivation of Tfr1 incapacitated normal energy production in muscle, leading to growth arrest and a muted attempt to switch to fatty acid β oxidation, using up fat stores. Starvation signals stimulated gluconeogenesis in the liver, but amino acid substrates became limiting and hypoglycemia ensued. Surprisingly, the liver was also iron deficient, and production of the iron regulatory hormone hepcidin was depressed. Our observations reveal a complex interaction between iron homeostasis and metabolism that has implications for metabolic and iron disorders.

Keywords: Hepcidin; Intermediary metabolism; Iron; Skeletal muscle; Transferrin receptor.


Figures

Fig. 1
Fig. 1
Phenotypic characterization of Tfr1mu/mu mice. (A) Appearance of WT and Tfr1mu/mu mice at P9 (C57/129 mixed background). (B) Body weights at P1 (WT n = 7, Tfr1mu/mu n = 7; 129 background), and P6 (WT n = 5, Tfr1mu/mu n = 10; 129 background). (C) Tibialis anterior (TA) and gastrocnemius (GA) muscles from P9 WT and Tfr1mu/mu mice (C57/129 mixed background). (D) Ratio of tibialis anterior (TA) mass to tibia length at P6 (WT n = 25, Tfr1mu/mu n = 27; 129 background). (E) Tibialis anterior fiber numbers in Tfr1mu/mu and WT mice at P6 (WT n = 5, Tfr1mu/mu n = 4; 129 background). (F) P9 Tfr1mu/mu mice lacked body fat pads found in control mice, as indicated with arrows (C57/129 mixed background). (G) Gross morphology of P9 WT and Tfr1mu/mu livers (WT n = 3, Tfr1mu/mu n = 3; C57/129 mixed background). (H) Oil Red O staining (red) of liver sections (C57/129 mixed background). (I) Gross morphology of spleens at P9 (C57/129 mixed background). (J) Serum glucose measurements at P6 (male mice; WT n = 5, Tfr1mu/mu n = 10; 129 background). (K) Serum ketone measurements at P6 (male mice; WT n = 12, Tfr1mu/mu n = 12; 129 background). For all panels with graphs: Error bars represent standard deviation, ** p ≤ 0.01, **** p ≤ 0.0001.
Fig. 2
Fig. 2
Skeletal muscles with deletion of Tfr1 have decreased iron levels. (A,B) H-ferritin (Fth) levels in P6 Tfr1mu/mu muscle compared to WT littermates [ribosome protein L19 (Rpl19) loading control; WT n = 5, Tfr1mu/mu n = 4; 129 background]. (C,D) Iron regulatory protein (IRP) binding to a biotinylated iron regulatory element (IRE) probe in P6 Tfr1mu/mu muscle compared to WT (WT n = 5, Tfr1mu/mu n = 4; 129 background). (E,F) Levels of representative proteins for complexes I (Ndufb8), II (Sdhb), III (Uqcrc2), and IV (Mtco1) in muscle from P6 Tfr1mu/mu mice compared to WT. The amount of ATP5A, a protein component of complex V, appeared unchanged and was used in panel F to normalize for relative intensity (WT n = 6, Tfr1mu/mu n = 6; 129 background). (G) Enzymatic activity of Complex II in P6 Tfr1mu/mu muscle compared to WT (WT n = 5, Tfr1mu/mu n = 3; 129 background). (H,I) Fe–S containing protein Ndufs3 in P6 muscle from Tfr1mu/mu mice [ribosome protein L19 (Rpl19) loading control; WT n = 5, Tfr1mu/mu n = 4; 129 background]. All panels: error bars represent standard deviation; * p ≤ 0.05, ** p ≤ 0.01, ***p ≤ 0.001, ****p ≤ 0.0001.
Fig. 3
Fig. 3
Exogenous iron rescues the Tfr1mu/mu phenotype. (A) Representative adult Tfr1mu/mu and WT mice treated with iron dextran. (B) Body weights of untreated WT and iron dextran treated WT and Tfr1mu/mu mice. + Fe indicates iron treatment (untreated WT n = 4, treated WT n = 4, treated Tfr1mu/mu n = 3). (C) Non-heme liver iron in WT and Tfr1mu/mu mice treated with iron. + Fe indicates mice treated with iron (note Log10 scale; untreated WT n = 4, treated WT n = 4, treated Tfr1mu/mu n = 3). (D) Non-heme skeletal muscle iron in WT and Tfr1mu/mu mice treated with iron. + Fe indicates mice treated with iron (note Log10 scale; untreated WT n = 4, treated WT n = 4, treated Tfr1mu/mu n = 3). (E,F) Muscle H-ferritin (Fth) in WT and Tfr1mu/mu mice treated with iron. + Fe indicates mice treated with iron [ribosome protein L19 (Rpl19) loading control; untreated WT n = 4, treated WT n = 4, treated Tfr1mu/mu n = 3]. (G) Blood glucose levels in WT and Tfr1mu/mu mice treated with iron. + Fe indicates mice treated with iron (untreated WT n = 4, treated WT n = 4, treated Tfr1mu/mu n = 3). Differences in blood glucose were not significant. For all panels: mice are one-month old females on a 129 background. Error bars represent standard deviation; ns = no significant, ** p ≤ 0.01, ***p ≤ 0.001, ****p ≤ 0.0001.
Fig. 4
Fig. 4
Hepatic iron is decreased in Tfr1mu/mu mice. (A) Relative Tfr1 mRNA levels in livers from P6 WT and Tfr1mu/mu mice (WT n = 10, Tfr1mu/mu n = 11; 129 background). (B) Non-heme liver iron in P6 WT and Tfr1mu/mu mice (WT n = 8, Tfr1mu/mu n = 8, 129 background). (C,D) Liver H-ferritin (Fth) in WT and Tfr1mu/mu mice [ribosome protein L19 (Rpl19) loading control; WT n = 8 and Tfr1mu/mu n = 9; 129 background]. (E) Aconitase activity in liver from P6 WT and Tfr1mu/mu mice (WT n = 10, Tfr1mu/mu n = 12; 129 background). (F) Relative hepcidin mRNA levels in liver from P6 WT and Tfr1mu/mu mice (WT n = 10, Tfr1mu/mu n = 11; 129 background). Error bars represent standard deviation; ns = no significant, * p ≤ 0.05, ** p ≤ 0.01, ***p ≤ 0.001.
Fig. 5
Fig. 5
Metabolic changes in Tfr1mu/mu mice. (Left panel) Heat map of metabolomics results from gastrocnemius muscle, liver and serum from P4 (4d) and P6 (6d) WT and Tfr1mu/mu mice (males; 129 background). Blue — decreased, red — increased, white — not significantly different from WT, gray — not determined; SC — short chain, MC — medium chain, LC — long chain, VLC — very long chain, AC — acylcarnitine. Because the animals were small, we pooled tissue from 3 to 4 mice for each sample in this analysis. At P4 we analyzed 6 pools each for WT and Tfr1mu/mu (total 23 mice of each genotype). At P6 we analyzed 6 pools each for WT and Tfr1mu/mu (total 18 mice of each genotype). P4 Tfr1mu/mu mice were compared to P4 WT mice and P6 Tfr1mu/mu mice were compared to P6 WT mice. (Right panels) Diagrammatic representation of pathways changing in the muscle (top) and liver (bottom) of Tfr1mu/mu mice. Metabolites highlighted in blue are decreased and metabolites highlighted in red are increased.
Fig. 6
Fig. 6
Proteomic analysis shows increased acetylation in proteins in muscle of Tfr1mu/mu mice. (A) Heat map showing the global protein expression of three pools of Tfr1mu/mu gastrocnemius (9–10 mice per pool) and three pools of WT gastrocnemius (7 mice per pool) at P6 (males; 129 background). The table lists proteins with significant changes in expression in Tfr1mu/mu mice compared to WT mice. (B) Heat map of acetyl proteome of three Tfr1mu/mu and three WT mice at 6 days of age. We used the same pooled samples as in (A). The table lists proteins with significant increase in acetylation in Tfr1mu/mu mice compared to WT mice.

Comment in

References

    1. An J., Muoio D.M., Shiota M., Fujimoto Y., Cline G.W., Shulman G.I., Koves T.R., Stevens R., Millington D., Newgard C.B. Hepatic expression of malonyl-CoA decarboxylase reverses muscle, liver and whole-animal insulin resistance. Nat. Med. 2004;10:268–274. - PubMed
    1. Anderson K.A., Hirschey M.D. Mitochondrial protein acetylation regulates metabolism. Essays Biochem. 2012;52:23–35. - PMC - PubMed
    1. Andrews N.C. Medical Progress: Disorders of Iron Metabolism. N. Engl. J. Med. 1999;341:1986–1995. - PubMed
    1. Baker E., Baker S.M., Morgan E.H. Characterisation of non-transferrin-bound iron (ferric citrate) uptake by rat hepatocytes in culture. Biochim. Biophys. Acta. 1998;1380:21–30. - PubMed
    1. Barisani D., Berg C.L., Wessling-Resnick M., Gollan J.L. Evidence for a low Km transporter for non-transferrin-bound iron in isolated rat hepatocytes. Am. J. Phys. 1995;269:G570–G576. - PubMed

Publication types

MeSH terms

Substances