

Mimecan, a Hormone Abundantly Expressed in Adipose Tissue, Reduced Food Intake Independently of Leptin Signaling
- PMID: 26870797
- PMCID: PMC4740298
- DOI: 10.1016/j.ebiom.2015.09.044
Mimecan, a Hormone Abundantly Expressed in Adipose Tissue, Reduced Food Intake Independently of Leptin Signaling
Abstract
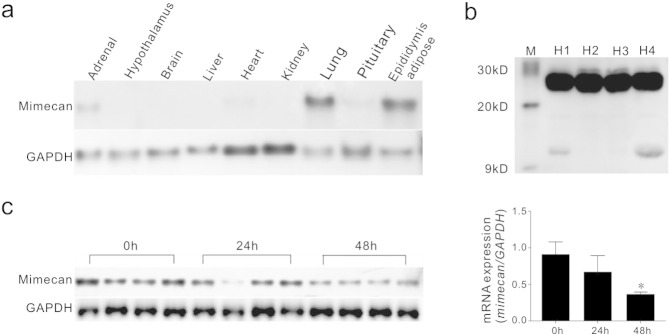
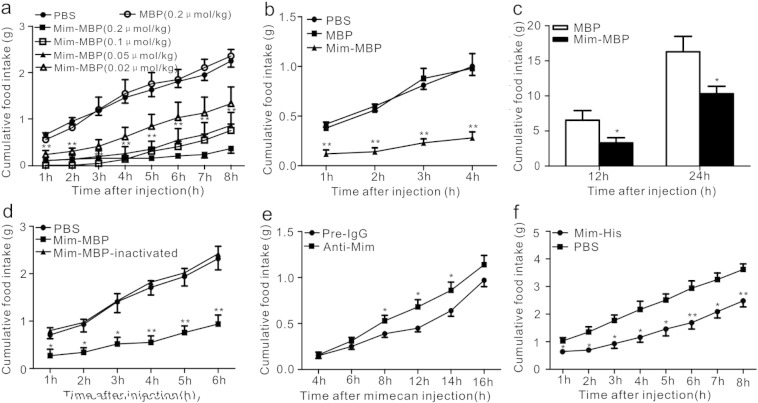
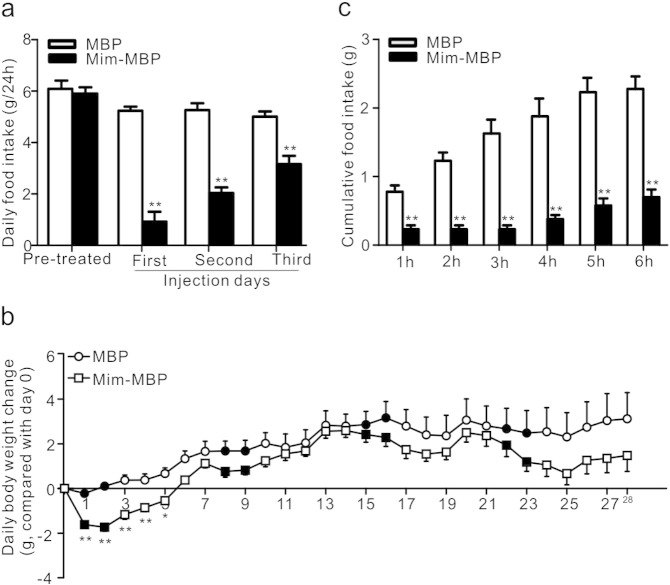
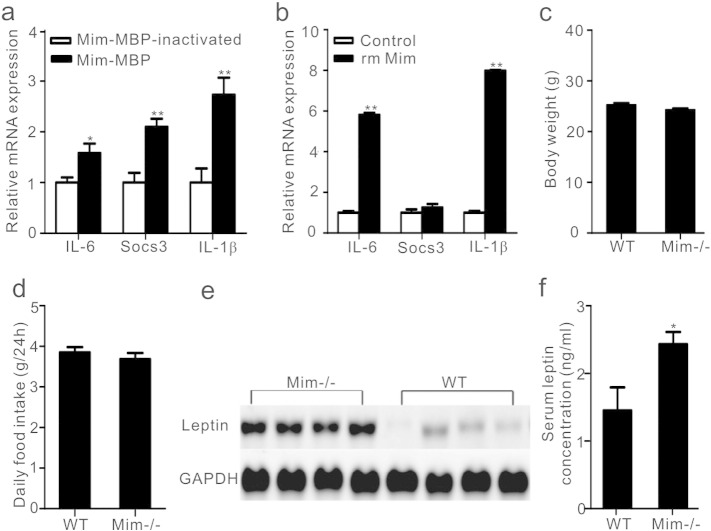
Adipokines such as leptin play important roles in the regulation of energy metabolism, particularly in the control of appetite. Here, we describe a hormone, mimecan, which is abundantly expressed in adipose tissue. Mimecan was observed to inhibit food intake and reduce body weight in mice. Intraperitoneal injection of a mimecan-maltose binding protein (-MBP) complex inhibited food intake in C57BL/6J mice, which was attenuated by pretreatment with polyclonal antibody against mimecan. Notably, mimecan-MBP also induced anorexia in A(y)/a and db/db mice. Furthermore, the expression of interleukin (IL)-1β and IL-6 was up-regulated in the hypothalamus by mimecan-MBP, as well as in N9 microglia cells by recombinant mouse mimecan. Taken together, the results suggest that mimecan is a satiety hormone in adipose tissue, and that mimecan inhibits food intake independently of leptin signaling by inducing IL-1β and IL-6 expression in the hypothalamus.
Keywords: Anorexia; IL-1β; IL-6; Leptin; Mimecan.
Figures
Comment in
-
Mimecan: A Newly Identified Adipokine and Regulator of Appetite.EBioMedicine. 2015 Nov 6;2(11):1584-5. doi: 10.1016/j.ebiom.2015.11.008. eCollection 2015 Nov. EBioMedicine. 2015. PMID: 26870776 Free PMC article. No abstract available.
Similar articles
-
Amylin-induced central IL-6 production enhances ventromedial hypothalamic leptin signaling.Diabetes. 2015 May;64(5):1621-31. doi: 10.2337/db14-0645. Epub 2014 Nov 19. Diabetes. 2015. PMID: 25409701 Free PMC article.
-
Refeeding after prolonged food restriction differentially affects hypothalamic and adipose tissue leptin gene expression.Neuropeptides. 2009 Aug;43(4):321-5. doi: 10.1016/j.npep.2009.05.001. Epub 2009 Jun 18. Neuropeptides. 2009. PMID: 19539991
-
Blockage of the Neonatal Leptin Surge Affects the Gene Expression of Growth Factors, Glial Proteins, and Neuropeptides Involved in the Control of Metabolism and Reproduction in Peripubertal Male and Female Rats.Endocrinology. 2015 Jul;156(7):2571-81. doi: 10.1210/en.2014-1981. Epub 2015 Apr 9. Endocrinology. 2015. PMID: 25856428
-
Cross-talk between adipose and gastric leptins for the control of food intake and energy metabolism.Prog Histochem Cytochem. 2010 Sep;45(3):143-200. doi: 10.1016/j.proghi.2010.06.001. Epub 2010 Jul 10. Prog Histochem Cytochem. 2010. PMID: 20621336 Review.
-
How the brain regulates food intake and body weight: the role of leptin.J Pediatr Endocrinol Metab. 2001;14 Suppl 6:1417-29. J Pediatr Endocrinol Metab. 2001. PMID: 11837495 Review.
Cited by
-
Osteoglycin: An ECM Factor Regulating Fibrosis and Tumorigenesis.Biomolecules. 2022 Nov 11;12(11):1674. doi: 10.3390/biom12111674. Biomolecules. 2022. PMID: 36421687 Free PMC article. Review.
-
Vesicles Shed by Pathological Murine Adipocytes Spread Pathology: Characterization and Functional Role of Insulin Resistant/Hypertrophied Adiposomes.Int J Mol Sci. 2020 Mar 24;21(6):2252. doi: 10.3390/ijms21062252. Int J Mol Sci. 2020. PMID: 32214011 Free PMC article.
-
Interleukin-6 Expression by Hypothalamic Microglia in Multiple Inflammatory Contexts: A Systematic Review.Biomed Res Int. 2019 Aug 22;2019:1365210. doi: 10.1155/2019/1365210. eCollection 2019. Biomed Res Int. 2019. PMID: 31534953 Free PMC article.
-
Functional role of skeletal muscle-derived interleukin-6 and its effects on lipid metabolism.Front Physiol. 2023 Jul 24;14:1110926. doi: 10.3389/fphys.2023.1110926. eCollection 2023. Front Physiol. 2023. PMID: 37555019 Free PMC article. Review.
-
Extracellular Vesicles as Carriers of Adipokines and Their Role in Obesity.Biomedicines. 2023 Feb 1;11(2):422. doi: 10.3390/biomedicines11020422. Biomedicines. 2023. PMID: 36830957 Free PMC article. Review.
References
-
- Bentz H., Nathan R.M., Rosen D.M., Armstrong R.M., Thompson A.Y., Segarini P.R., Mathews M.C., Dasch J.R., Piez K.A., Seyedin S.M. Purification and characterization of a unique osteoinductive factor from bovine bone. J. Biol. Chem. 1989;264:20805–20810. - PubMed
-
- Campfield L.A., Smith F.J., Guisez Y., Devos R., Burn P. Recombinant mouse OB protein: evidence for a peripheral signal linking Adiposity and central neural networks. Science. 1995;269:546–549. - PubMed
-
- Chen H., Charlat O., Tartaglia L.A., Woolf E.A., Weng X., Ellis S.J., Lakey N.D., Culpepper J., Moore K.J., Breitbart R.E., Duyk G.M., Tepper R.I., Morgenstern J.P. Evidence that the diabetes gene encodes the leptin receptor: identification of a mutation in the leptin receptor gene in db/db mice. Cell. 1996;84:491–495. - PubMed
-
- Deboer M.D., Scarlett J.M., Levasseur P.R., Grant W.F., Marks D.L. Administration of IL-1beta to the 4th ventricle causes anorexia that is blocked by agouti-related peptide and that coincides with activation of tyrosine-hydroxylase Neurons in the nucleus of the solitary tract. Peptides. 2009;30:210–218. - PMC - PubMed
-
- Fan W., Boston B.A., Kesterson R.A., Hruby V.J., Cone R.D. Role of melanocortinergic neurons in feeding and the agouti obesity syndrome. Nature. 1997;385:165–168. - PubMed
Publication types
MeSH terms
Substances
LinkOut - more resources
Full Text Sources
Other Literature Sources
Miscellaneous
