. 2015 Sep 28;2(11):1767-84.
doi: 10.1016/j.ebiom.2015.09.042. eCollection 2015 Nov.

Cyclic AMP Response Element Binding Protein Mediates Pathological Retinal Neovascularization via Modulating DLL4-NOTCH1 Signaling

Affiliations

Cyclic AMP Response Element Binding Protein Mediates Pathological Retinal Neovascularization via Modulating DLL4-NOTCH1 Signaling

Nikhlesh K Singh et al. EBioMedicine. .

Abstract

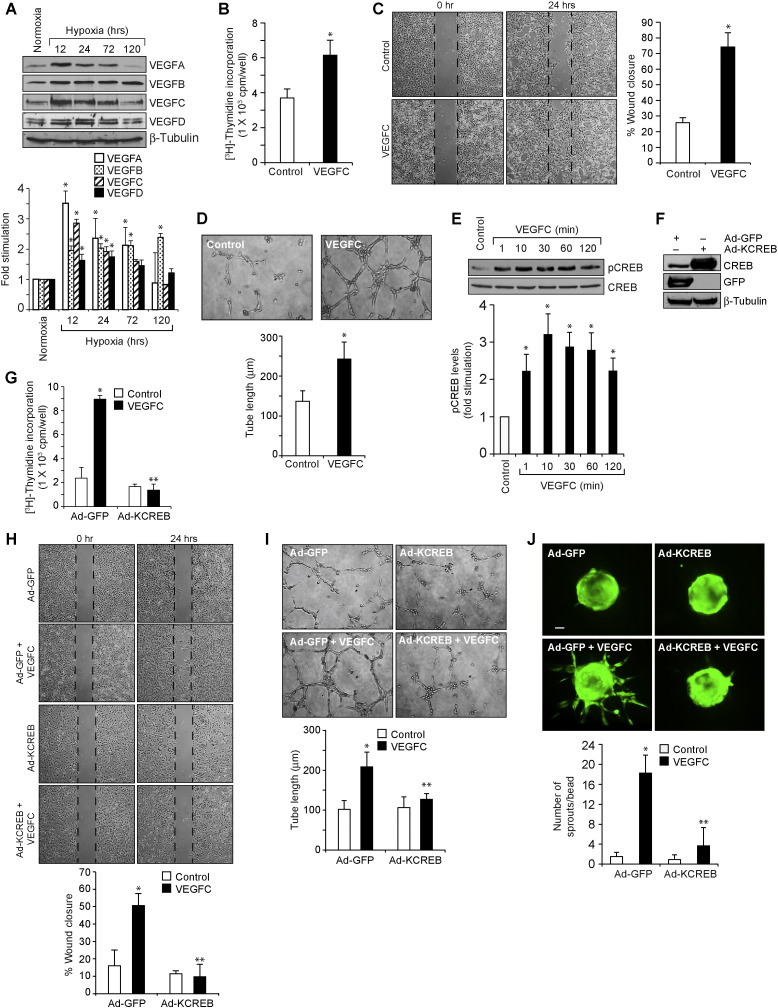
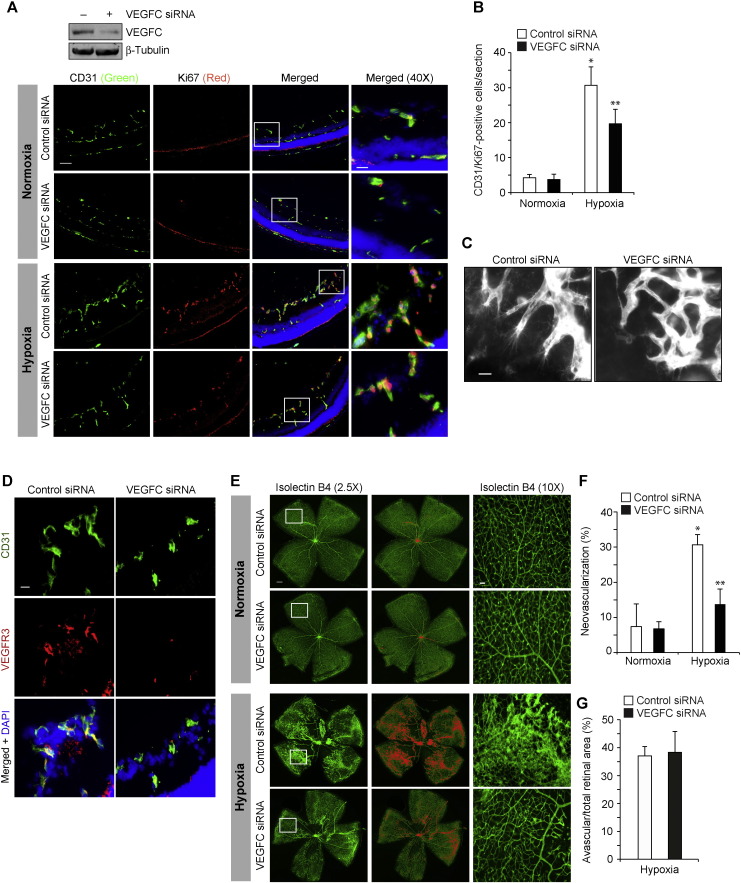
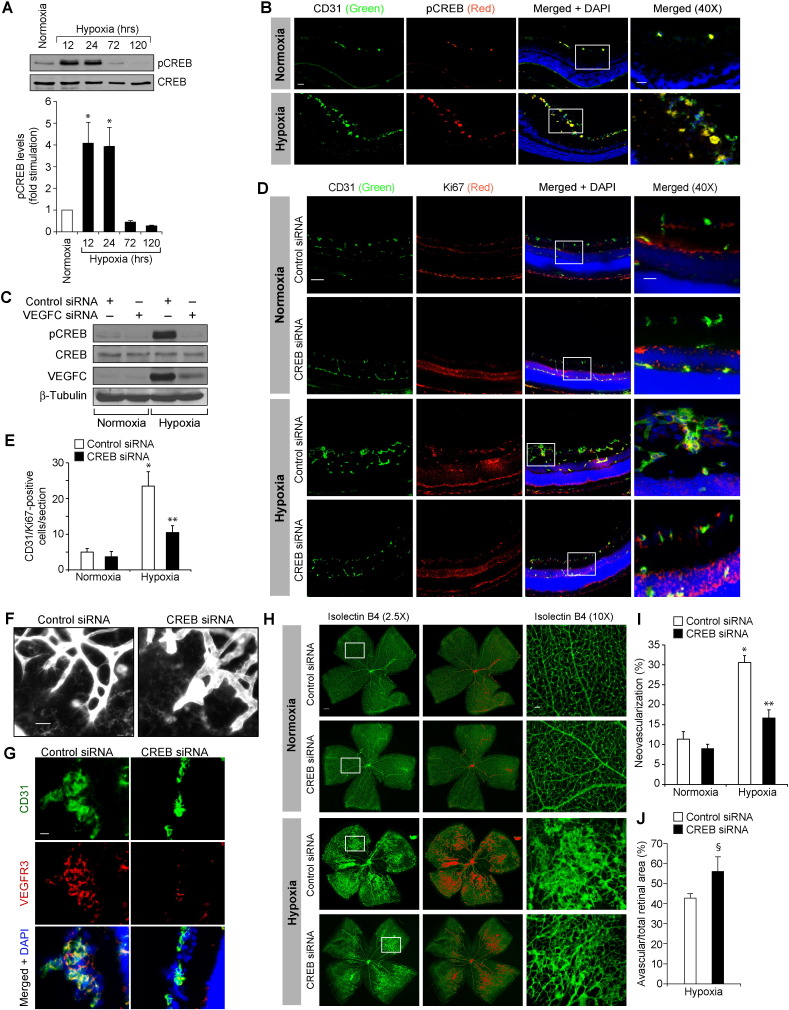
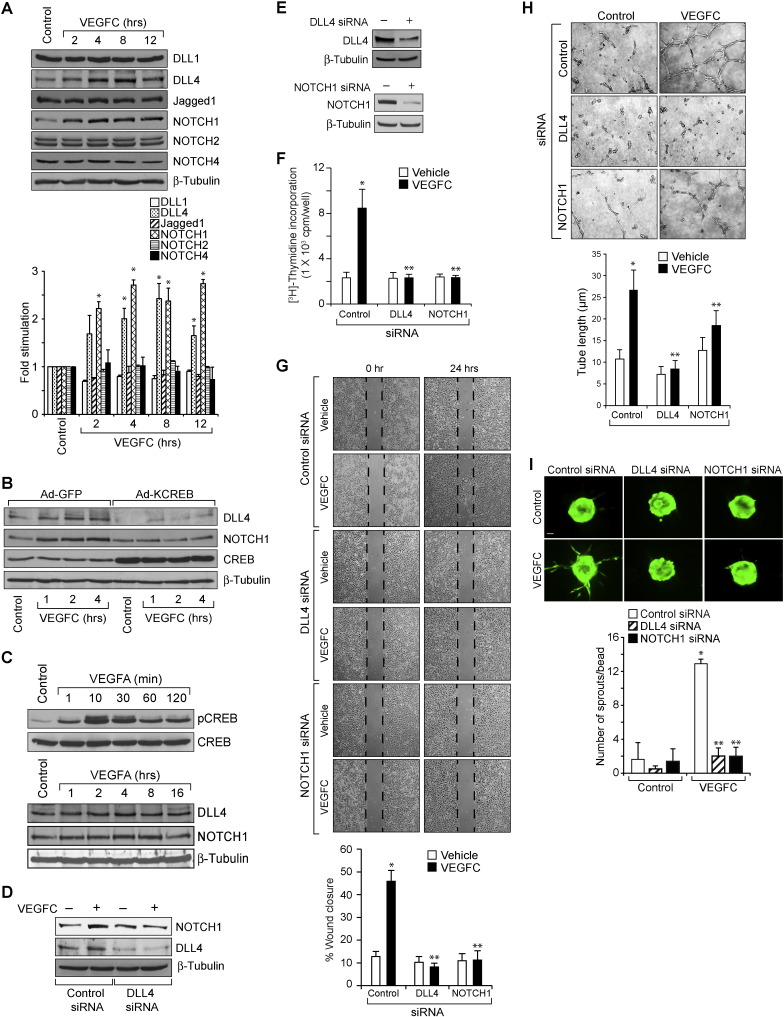
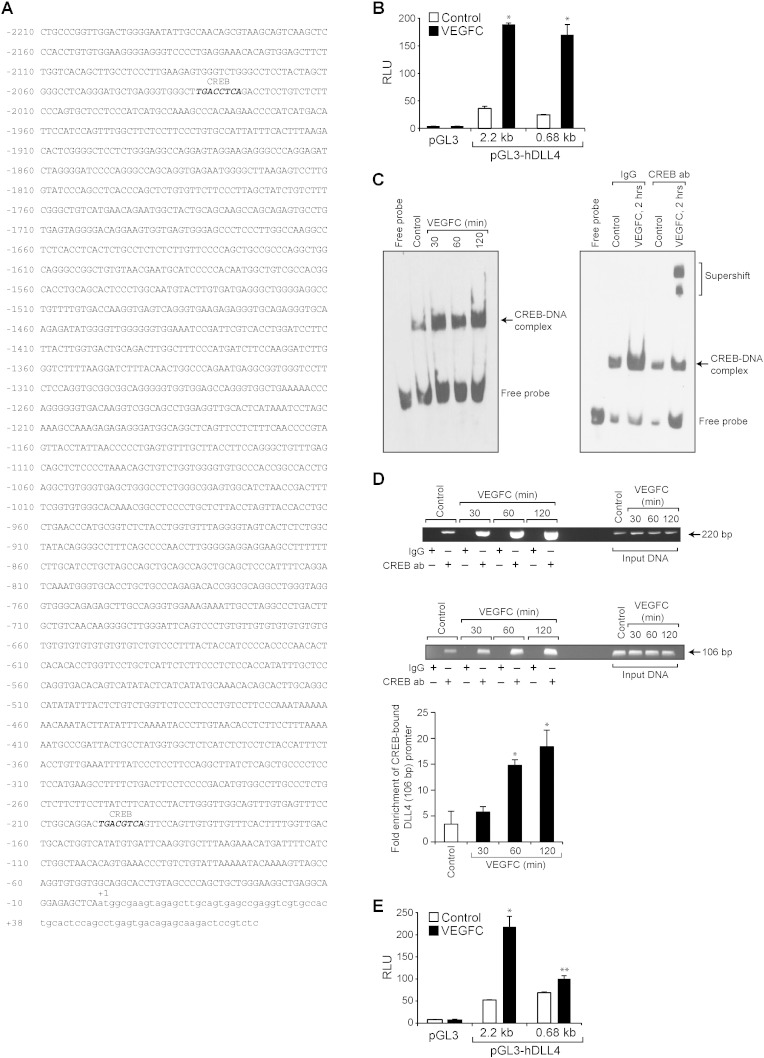
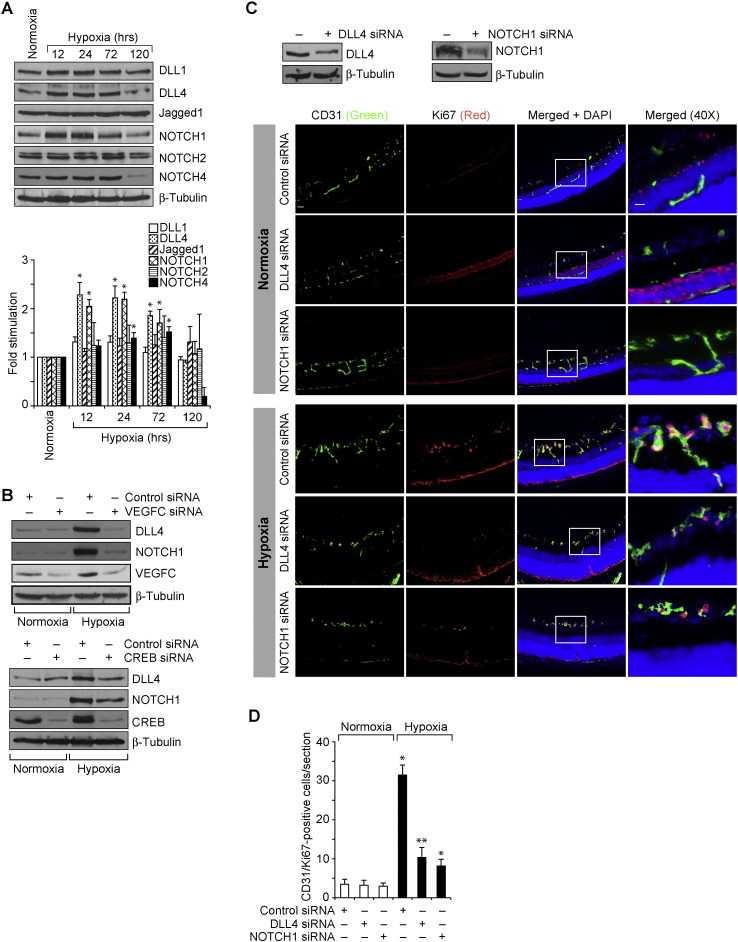
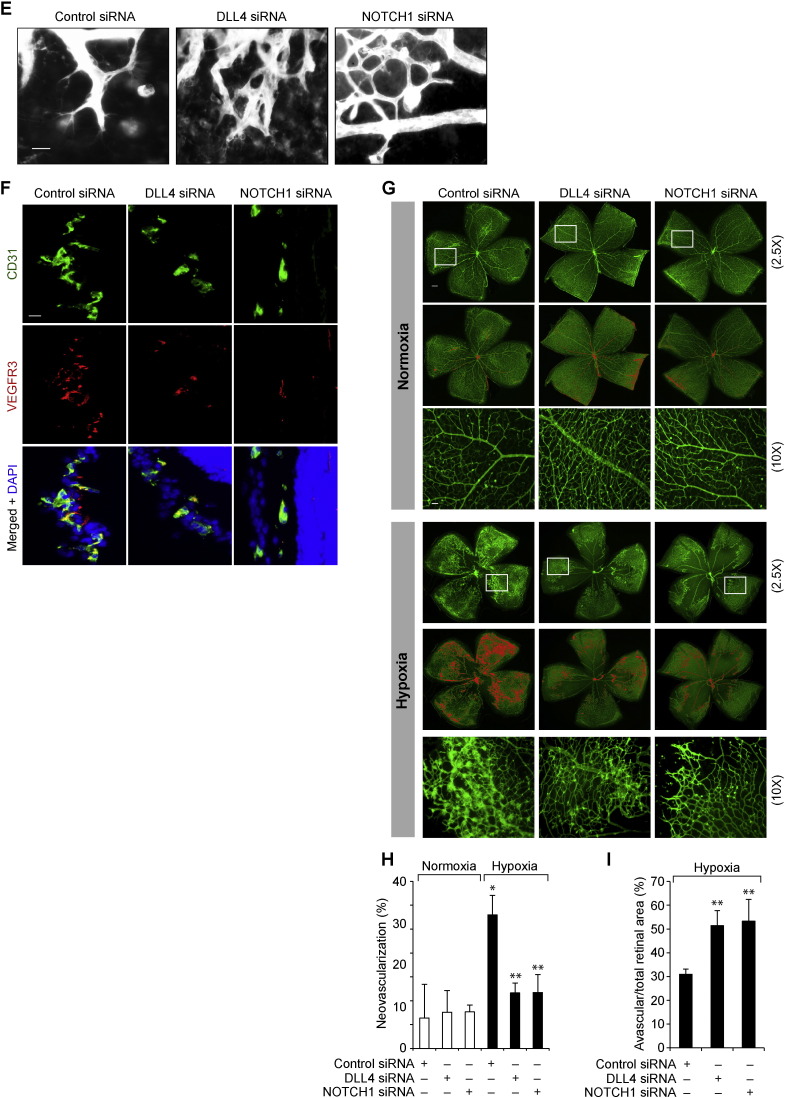
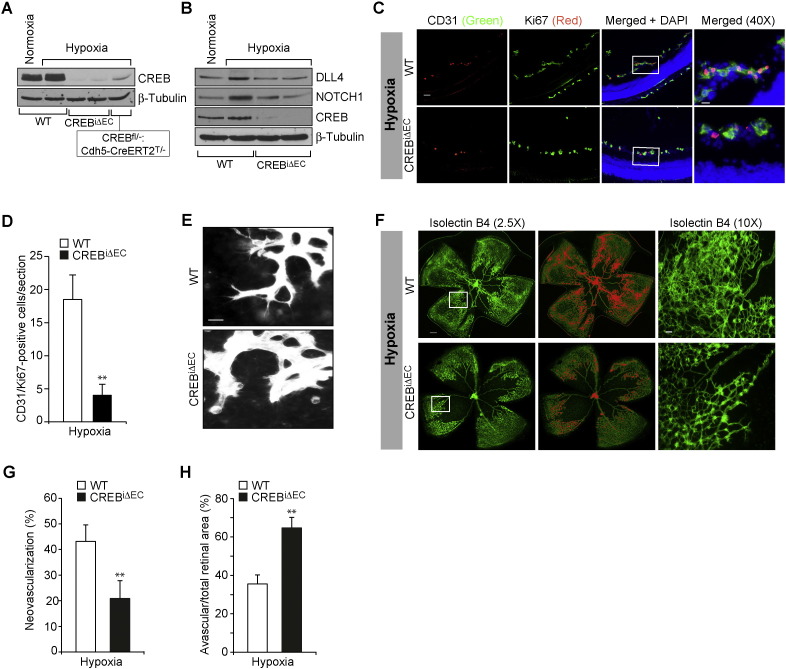
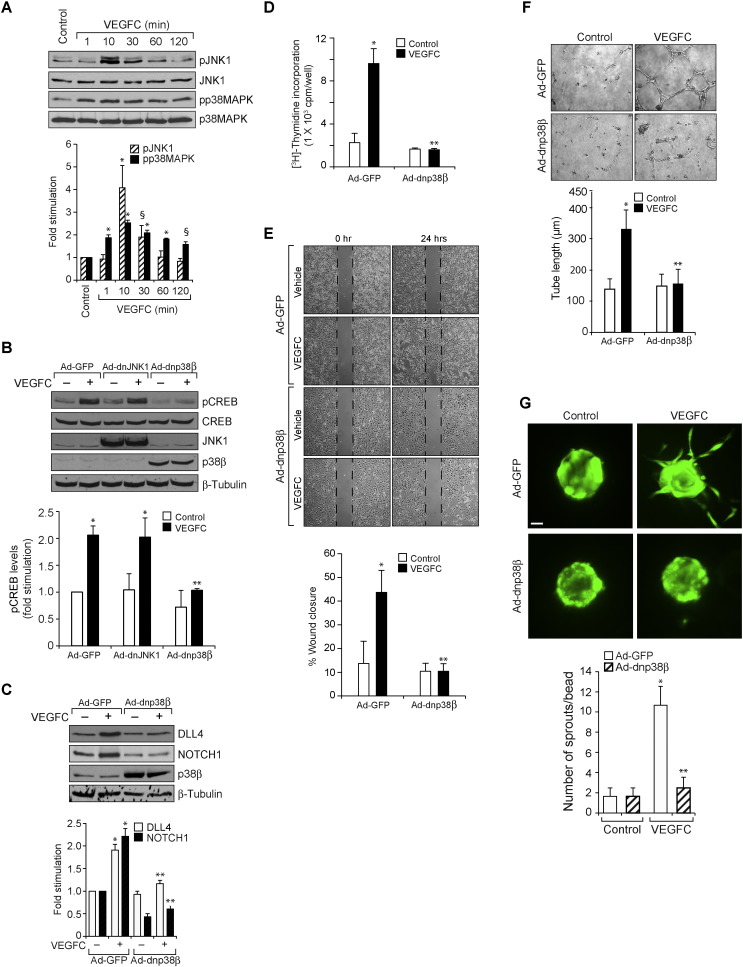
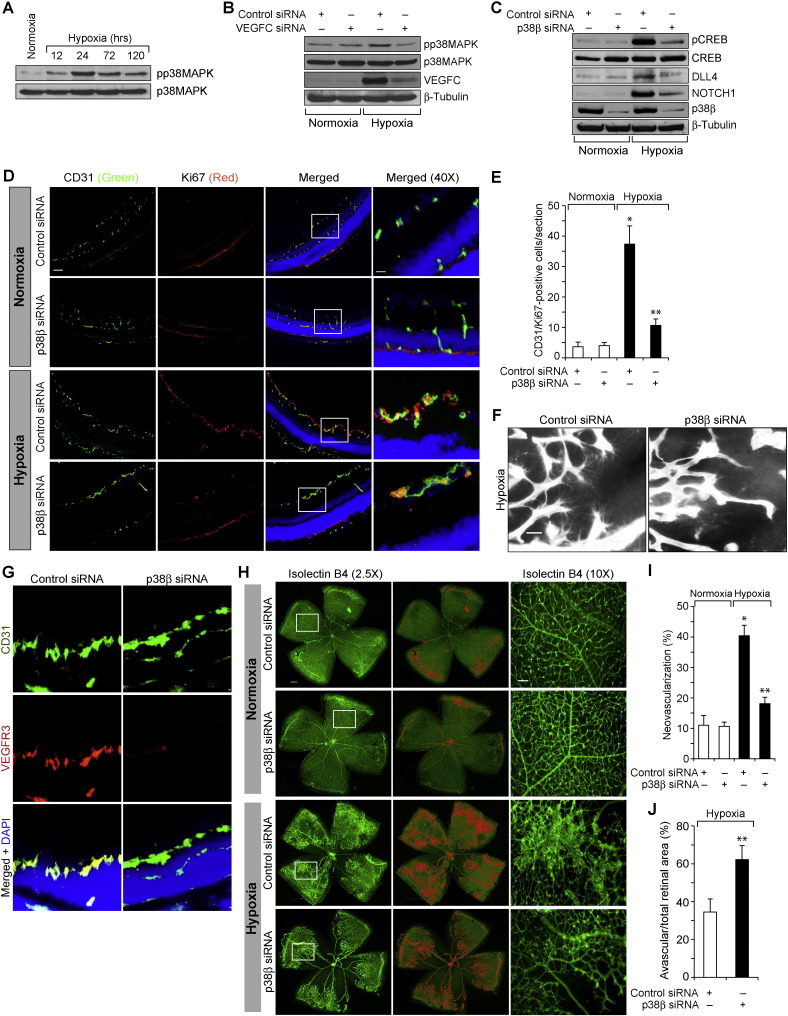
Retinal neovascularization is the most common cause of moderate to severe vision loss in all age groups. Despite the use of anti-VEGFA therapies, this complication continues to cause blindness, suggesting a role for additional molecules in retinal neovascularization. Besides VEGFA and VEGFB, hypoxia induced VEGFC expression robustly. Based on this finding, we tested the role of VEGFC in pathological retinal angiogenesis. VEGFC induced proliferation, migration, sprouting and tube formation of human retinal microvascular endothelial cells (HRMVECs) and these responses require CREB-mediated DLL4 expression and NOTCH1 activation. Furthermore, down regulation of VEGFC levels substantially reduced tip cell formation and retinal neovascularization in vivo. In addition, we observed that CREB via modulating the DLL4-NOTCH1 signaling mediates VEGFC-induced tip cell formation and retinal neovascularization. In regard to upstream mechanism, we found that down regulation of p38β levels inhibited hypoxia-induced CREB-DLL4-NOTCH1 activation, tip cell formation, sprouting and retinal neovascularization. Based on these findings, it may be suggested that VEGFC besides its role in the regulation of lymphangiogenesis also plays a role in pathological retinal angiogenesis and this effect depends on p38β and CREB-mediated activation of DLL4-NOTCH1 signaling.

Keywords: CREB; DLL4; NOTCH1; Retinal neovascularization; VEGFC.


Figures

Fig. 1
Fig. 1
CREB mediates VEGFC-induced angiogenic events. A. C57BL/6 mice pups after exposure to 75% oxygen from P7 to P12 were returned to room air to develop the relative hypoxia. Eyes from pups left in normoxia or at various time periods of hypoxia were enucleated, retinas isolated and extracts were prepared. An equal amount of protein from normoxic and various time periods of hypoxic retinal extracts was analyzed by Western blotting for VEGFA, VEGFB, VEGFC and VEGFD levels using their specific antibodies and normalized to β-tubulin. B–D. Quiescent HRMVECs were treated with and without VEGFC (100 ng/ml) and DNA synthesis (B), migration (C), or tube formation (D) were measured. E. An equal amount of protein from control and the indicated time periods of VEGFC (100 ng/ml)-treated HRMVECs was analyzed by Western blotting for pCREB levels using its phospho-specific antibodies and normalized to CREB. F. Cells were transduced with Ad-GFP or Ad-KCREB (40 moi) and 48 h later cell extracts were prepared and analyzed for over expression of GFP or KCREB by Western blotting using their specific antibodies and normalized to β-tubulin. G–I. All the conditions were the same as in panel F except that after transduction with the adenovirus, cells were quiesced and subjected to VEGFC (100 ng/ml)-induced DNA synthesis (G), migration (H), or tube formation (I). J. All the conditions were the same as in panel F except that after transduction, cells were labeled with Cell Tracker Green, coated onto Cytodex beads, embedded in a 3D-fibrin gel in EGM2 medium for 3 days and sprouts were observed under fluorescent microscope. The images were captured using MRm camera. The bar graphs represent quantitative analysis of three independent experiments. The values are presented as Mean ± SD. * p < 0.01 vs control, normoxia or Ad-GFP; ** p < 0.01 vs Ad-GFP + VEGFC. Scale bar represents 50 μm.
Fig. 2
Fig. 2
VEGFC mediates hypoxia-induced retinal neovascularization. A. After exposure to 75% oxygen from P7 to P12, pups were returned to room air to develop the relative hypoxia. Pups were administered intravitreally with 1 μg/0.5 μl/eye of control or VEGFC siRNA at P12 and P13 and at P15 the retinas were isolated and either tissue extracts were prepared and analyzed for VEGFC levels by Western blotting using its specific antibody and normalized to β-tubulin or fixed, cross-sections made and stained by immunofluorescence for CD31 and Ki67. The right column shows the higher magnification (40 ×) of the areas selected by rectangular boxes in the left column images. B. Retinal EC proliferation was measured by counting CD31- and Ki67-positive cells that extended anterior to the inner limiting membrane per section (n = 6 eyes, 3 sections/eye). C. All the conditions were the same as in panel A except that control or VEGFC siRNAs were injected intravitreally at P12, P13, and P15 and at P17 the retinas were isolated, stained with isolectin B4, flat mounts were made and examined for EC filopodia formation at 40 × magnification. D. All the conditions were the same as in panel A except that the sections were stained for CD31, VEGFR3 and DAPI. E. All the conditions were the same as in panel C except that retinal neovascularization was measured at 2.5 × magnification. Retinal vascularization is shown in the first column. Neovascularization is highlighted in red in the second column. The third row shows the selected rectangular areas of the images in the first column under 10 × magnification. F & G. Retinal neovascularization (F) and avascular area (G) were determined as described in “Materials and Methods.” The bar graphs represent quantitative analysis of three blots or 6 retinas. The values are presented as Mean ± SD. * p < 0.01 vs normoxia + control siRNA; ** p < 0.01 vs hypoxia + control siRNA. Scale bar represents 50 μm and 20 μm in panel A, far left column and far right column, respectively, 20 μm in panels C & D, 300 μm and 50 μm in panel E, far left column and far right column, respectively.
Fig. 3
Fig. 3
CREB mediates hypoxia-induced retinal neovascularization. A. An equal amount of protein from normoxic and various time periods of hypoxic retinal extracts were analyzed by Western blotting for pCREB levels using its phospho-specific antibody and normalized to CREB. B. Following exposure to hyperoxia from P7 to P12, pups were returned to room air and at P15 the retinas were isolated, fixed, cross-sections were made and stained by immunofluorescence for CD31 and pCREB. C. All the conditions were the same as in panel B except that pups were administered intravitreally with 1 μg/0.5 μl/eye of control or VEGFC siRNA at P10 and P11 and at P13 the retinas were isolated and tissue extracts were prepared. An equal amount of protein from normoxic and hypoxic retinal extracts was analyzed by Western blotting for pCREB and CREB levels as described in panel A and the blot was reprobed for VEGFC or β-tubulin levels to show the effects of the siRNA on its target and off-target molecules, respectively. D. All the conditions were the same as in panel C except that pups were administered intravitreally with 1 μg/0.5 μl/eye of control or VEGFC siRNA at P12 and P13 and that at P15 the retinas were isolated and processed for CD31 and Ki67 immunofluorescence staining as described in Fig. 2, panel A. The right column shows the higher magnification (40 ×) of the areas selected by rectangular boxes in the images shown in the left column. E. Retinal EC proliferation was measured by counting CD31- and Ki67-positive cells that extended anterior to the inner limiting membrane per section (n = 6 eyes, 3 sections/eye). F. All the conditions were the same as in panel D except that control or CREB siRNAs were injected intravitreally at P12, P13, and P15 and at P17 the retinas were isolated, stained with isolectin B4, flat mounts were made and examined for EC filopodia formation at 40 × magnification. G. All the conditions were the same as in panel D except that the sections were stained for CD31, VEGFR3 and DAPI. H. All the conditions were the same as in panel F except that retinal neovascularization was measured at 2.5 × magnification. Retinal vascularization is shown in the first column. Neovascularization is highlighted in red in the second column. The third row shows the selected rectangular areas of the images shown in the first column under 10 × magnification. I & J. Retinal neovascularization (I) and avascular areas (J) were determined as described in “Materials and Methods.” The bar graphs represent quantitative analysis of three blots or 6 retinas. The values are presented as Mean ± SD. * p < 0.01 vs normoxia or normoxia + control siRNA; ** p < 0.01 vs hypoxia + control siRNA; § p < 0.05 vs hypoxia + control siRNA. Scale bar represents 50 μm and 20 μm in panels B & D, far left column and far right column, respectively, 20 μm in panels F & G, 300 μm and 50 μm in panel H, far left column and far right column, respectively.
Fig. 4
Fig. 4
DLL4 and NOTCH1 mediate VEGFC-induced angiogenic events. A. An equal amount of protein from control and various time periods of VEGFC (100 ng/ml)-treated HRMVECs were analyzed by Western blotting for DLL1, DLL4, Jagged1, NOTCH1, NOTCH2 and NOTCH4 levels using their specific antibodies. The DLL4 blot was normalized to β-tubulin. B. Cells were transduced with Ad-GFP or Ad-KCREB (40 moi), growth-arrested, treated with and without VEGFC (100 ng/ml) for the indicated time periods and cell extracts were prepared and analyzed for DLL4 and NOTCH1 levels using their specific antibodies and the blot was sequentially reprobed for CREB, and β-tubulin levels to show the overexpression of KCREB and normalization. C. An equal amount of protein from control and various time periods of VEGFA (40 ng/ml)-treated HRMVECs were analyzed by Western blotting for pCREB, CREB, DLL4 and cNOTCH1 levels using their specific antibodies and the DLL4 blot was normalized to β-tubulin. D. HRMVECs were transfected with control, or DLL4 siRNA, growth-arrested, treated with and without VEGFC (100 ng/ml) for 2 h, cell extracts were prepared and analyzed by Western blotting for NOTCH1 and DLL4 levels using their specific antibodies and normalized to β-tubulin. E. HRMVECs were transfected with control, DLL4 or NOTCH1 siRNA and 48 h later either cell extracts were prepared and analyzed by Western blotting for DLL4 and NOTCH1 levels using their specific antibodies and normalized to β-tubulin. F–H. All the conditions were the same as in panel E except that after transfection, cells were quiesced and subjected to VEGFC (100 ng/ml)-induced DNA synthesis (F), migration (G), or tube formation (H). I. All the conditions were the same as in panel E except that after transfection cells were subjected to sprouting assay as described in Fig. 1, panel J. The bar graphs represent quantitative analysis of 3 independent experiments. The values are presented as Mean ± SD. * p < 0.01 vs control; ** p < 0.01 vs control siRNA + VEGFC. Scale bar represents 50 μm in panel F.
Fig. 5
Fig. 5
CREB is required for VEGFC-induced DLL4 promoter activity. A. DLL4 promoter encompassing − 2210 nt to + 78 nt was cloned and the nucleotide sequence with CREB binding sites highlighted in bold italic letters is shown. B. The full-length (from − 2210 nt to + 78 nt) and a truncated DLL4 promoter encompassing from − 605 nt to + 78 nt were sub-cloned into pGL3 vector yielding pGL3-hDLL4 (2.28 kb) and pGL3-hDLL4 (0.68 kb) plasmids. HRMVECs were transfected with empty vector or pGL3-hDLL4 (2.28 kb) or pGL3-hDLL4 (0.68 kb) promoter plasmid DNAs, growth-arrested, treated with vehicle or VEGFC for 4 h and the luciferase activity was measured. C. Left panel: Nuclear extracts of control and various time periods of VEGFC (100 ng/ml)-treated cells were analyzed by EMSA for CREB binding using CREB-binding site at − 193 nt as a Biotin-labeled probe. Right panel: Nuclear extracts of control and 2 h of VEGFC (100 ng/ml)-treated cells were analyzed by supershift EMSA using normal IgG or anti-CREB antibodies. D. Control and various time periods of VEGFC (100 ng/ml)-treated cells were analyzed for CREB binding to DLL4 promoter by ChIP assay using two sets of primers that amplify a 220 bp and a 106 bp DNA fragments surrounding the CREB-binding site at − 193 nt. The data in the bar graph in panel D represents the qPCR of 106 bp region of CREB-bound DLL4 promoter. E. HRMVECs were transfected with empty vector or pGL3-hDLL4 (0.68 kb) promoter plasmid DNA with and without the CREB-binding site mutated (TGA was mutated to CTC), growth-arrested, treated with and without VEGFC (100 ng/ml) for 4 h and the luciferase activity was measured. The bar graphs represent quantitative analysis of three independent experiments. The values represent Mean ± SD. * p < 0.01 vs control; ** p < 0.01 vs pGL3-hDLL4 (0.68 kb) + VEGFC.
Fig. 6
Fig. 6
CREB-mediated DLL4-NOTCH1 signaling is required for hypoxia-induced neovascularization. A. An equal amount of protein from normoxic and various time periods of hypoxic retinal extracts were analyzed by Western blotting for the indicated proteins using their specific antibodies and normalized to β-tubulin. B. All the conditions were the same as in panel A except that pups were administered intravitreally with 1 μg/0.5 μl/eye of scrambled, VEGFC or CREB siRNA at P10 and P11 and at P13 the retinas were isolated and tissue extracts were prepared. An equal amount of protein from normoxic and hypoxic retinal extracts were analyzed by Western blotting for the indicated proteins using their specific antibodies and normalized to β-tubulin. C. All the conditions were the same as in panel B except that pups were administered intravitreally with 1 μg/0.5 μl/eye of scrambled, DLL4 or NOTCH1 siRNA at P12 and P13 and at P15 retinas were isolated and either tissue extracts were prepared and analyzed by Western blotting for DLL4 and NOTCH1 levels and normalized to β-tubulin or cross-sections were made, fixed and stained by immunofluorescence for CD31 and Ki67. D. Retinal EC proliferation was measured by counting CD31- and Ki67-positive cells that extended anterior to the inner limiting membrane per section (n = 6 eyes, 3 sections/eye). E. All the conditions were the same as in panel D except that at P17 retinas were isolated, stained with isolectin B4 and flat mounts were made and examined for EC filopodia formation. F. All the conditions were the same as in panel C except that the sections were stained for CD31, VEGFR3 and DAPI. G. All the conditions were the same as in panel C except that pups were administered intravitreally with 1 μg/0.5 μl/eye of scrambled, DLL4 or NOTCH1 siRNA at P12, P13 and P15 and at P17 retinas were isolated, stained with isolectin B4, flat mounts were made and examined for neovascularization. Retinal vascularization is shown in the first row. Neovascularization is highlighted in red in the second row. The third row shows the selected rectangular areas of the images shown in the first row under 10X magnification. H & I. Retinal neovascularization (H) and avascular areas (I) were determined as described in “Materials and Methods.” The bar graphs represent quantitative analysis of 6 retinas. The values are presented as Mean ± SD. * p < 0.01 vs normoxia, normoxia + control siRNA; ** p < 0.01 vs hypoxia + control siRNA. Scale bar represents 50 μm and 20 μm in panel C, far left column and far right column, respectively, 20 μm in panels E & F and 300 μm and 50 μm in panel G, upper row and bottom row, respectively.
Fig. 6
Fig. 6
CREB-mediated DLL4-NOTCH1 signaling is required for hypoxia-induced neovascularization. A. An equal amount of protein from normoxic and various time periods of hypoxic retinal extracts were analyzed by Western blotting for the indicated proteins using their specific antibodies and normalized to β-tubulin. B. All the conditions were the same as in panel A except that pups were administered intravitreally with 1 μg/0.5 μl/eye of scrambled, VEGFC or CREB siRNA at P10 and P11 and at P13 the retinas were isolated and tissue extracts were prepared. An equal amount of protein from normoxic and hypoxic retinal extracts were analyzed by Western blotting for the indicated proteins using their specific antibodies and normalized to β-tubulin. C. All the conditions were the same as in panel B except that pups were administered intravitreally with 1 μg/0.5 μl/eye of scrambled, DLL4 or NOTCH1 siRNA at P12 and P13 and at P15 retinas were isolated and either tissue extracts were prepared and analyzed by Western blotting for DLL4 and NOTCH1 levels and normalized to β-tubulin or cross-sections were made, fixed and stained by immunofluorescence for CD31 and Ki67. D. Retinal EC proliferation was measured by counting CD31- and Ki67-positive cells that extended anterior to the inner limiting membrane per section (n = 6 eyes, 3 sections/eye). E. All the conditions were the same as in panel D except that at P17 retinas were isolated, stained with isolectin B4 and flat mounts were made and examined for EC filopodia formation. F. All the conditions were the same as in panel C except that the sections were stained for CD31, VEGFR3 and DAPI. G. All the conditions were the same as in panel C except that pups were administered intravitreally with 1 μg/0.5 μl/eye of scrambled, DLL4 or NOTCH1 siRNA at P12, P13 and P15 and at P17 retinas were isolated, stained with isolectin B4, flat mounts were made and examined for neovascularization. Retinal vascularization is shown in the first row. Neovascularization is highlighted in red in the second row. The third row shows the selected rectangular areas of the images shown in the first row under 10X magnification. H & I. Retinal neovascularization (H) and avascular areas (I) were determined as described in “Materials and Methods.” The bar graphs represent quantitative analysis of 6 retinas. The values are presented as Mean ± SD. * p < 0.01 vs normoxia, normoxia + control siRNA; ** p < 0.01 vs hypoxia + control siRNA. Scale bar represents 50 μm and 20 μm in panel C, far left column and far right column, respectively, 20 μm in panels E & F and 300 μm and 50 μm in panel G, upper row and bottom row, respectively.
Fig. 7
Fig. 7
Conditional knockout of CREB in EC attenuates DLL4–NOTCH1 signaling and retinal neovascularization. A. Tamoxifen was given intraperitoneally to CREBfl/fl:Cdh5-CreERT2, and CREBfl/−:Cdh5-CreERT2 pups on P10 and P11, when the pups were under hyperoxia and at P13 the retinas were isolated from WT (both from normoxia and hypoxia), CREBi ∆ EC, and CREBfl/−:Cdh5-CreERT2T/− pups, and extracts were prepared and an equal amount of protein from each group was analyzed by Western blotting for CREB using its specific antibody and normalized to β-tubulin. B. All the conditions were the same as in panel A except that the retinal extracts from WT, CREBi ∆ EC pups were analyzed by Western blotting for DLL4, NOTCH1 and CREB levels using their specific antibodies and normalized to β-tubulin. C & D. WT and CREBiΔEC mice pups after exposure to 75% oxygen from P7 to P12 were returned to normoxia to develop the relative hypoxia. At P15, the retinas were isolated, cross-sections were made and stained by immunofluorescence for CD31 and Ki67 (C) and cells positive for both CD31 and Ki67 were counted (D). E & F. All the conditions were the same as in panel C except that at P17 the retinas were isolated, stained with isolectin B4 and flat mounts were made and examined either for EC filopodia formation or neovascularization. In panel F, retinal vascularization is shown in the first column. Neovascularization is highlighted in red in the second column. The third column shows the selected rectangular areas of the images shown in the first column under 10X magnification. G & H. Retinal neovascularization (G) and avascular areas (H) were determined as described in “Materials and Methods.” The bar graphs represent quantitative analysis of 6 retinas. The values are presented as Mean ± SD. * p < 0.01 vs WT. Scale bar represents 50 μm and 20 μm in panel C, far left column and far right column, respectively, 20 μm in panel E and 300 μm and 50 μm in panel F, far left column and far right column, respectively.
Fig. 8
Fig. 8
p38MAPKβ mediates VEGFC-induced angiogenic events. A. An equal amount of protein from control and various time periods of VEGFC (100 ng/ml)-treated HRMVECs were analyzed by Western blotting for pJNK1 and pp38MAPK levels using their phospho-specific antibodies and normalized to their total levels. B. Cells were transduced with Ad-GFP, Ad-JNK1 or Ad-dnp38MAPKβ (p38β) (40 moi), growth-arrested, treated with and without VEGFC (100 ng/ml) for 10 min and cell extracts were prepared and analyzed for pCREB levels using its phospho-specific antibodies and the blot was sequentially reprobed for CREB, JNK1, p38MAPK and β-tubulin levels to show the over expression of dnJNK1, dnp38β or normalization. C. Cells were transduced with Ad-GFP or Ad-dnp38β (40 moi), growth-arrested, treated with and without VEGFC (100 ng/ml) for 2 h and cell extracts were prepared and analyzed for DLL4 or cNOTCH1 levels using their specific antibodies and the blot was sequentially reprobed for p38β and β-tubulin to show the over expression of dnp38β or normalization. D–G. Cells were transduced with Ad-GFP or Ad-dnp38β (40 moi), growth-arrested and subjected to DNA synthesis (D), migration (E), tube formation (F) or sprouting assay (G). The bar graphs represent quantitative analysis of 3 independent experiments. The values are presented as Mean ± SD. * p < 0.01 vs control; ** p < 0.01 vs control siRNA + VEGFC. Scale bar represents 50 μm in panel E.
Fig. 9
Fig. 9
p38MAPKβ mediates hypoxia-induced CREB–DLL4–NOTCH1 activation and neovascularization. A. An equal amount of protein from normoxic and various time periods of hypoxic retinal extracts were analyzed by Western blotting for pp38MAPK levels using its phospho-specific antibodies and normalized to its total level. B & C. All the conditions were the same as in panel A except that pups were administered intravitreally with 1 μg/0.5 μl/eye of scrambled, VEGFC, or p38β siRNA at P10 and P11 and at P13 the retinas were isolated and tissue extracts were prepared. An equal amount of protein from normoxic and hypoxic retinal extracts were analyzed by Western blotting for the indicated proteins using their specific antibodies and normalized to β-tubulin. D. All the conditions were the same as in panel C except that pups were administered intravitreally with 1 μg/0.5 μl/eye of scrambled, or p38β siRNA at P12 and P13 and at P15 retinas were isolated, cross-sections were made and stained by immunofluorescence for CD31 and Ki67. E. Retinal EC proliferation was measured by counting CD31- and Ki67-positive cells that extended anterior to the inner limiting membrane per section (n = 6 eyes, 3 sections/eye). F. All the conditions were the same as in panel C except that that pups were administered intravitreally with 1 μg/0.5 μl/eye of scrambled, or p38β siRNA at P12, P13 and P15 and at P17 the retinas were isolated, stained with isolectin B4 and flat mounts were made and examined for filopodia formation. G. All the conditions were the same as in panel D except that the sections were stained for CD31, VEGFR3 and DAPI. H. All the conditions were the same as in panel F except that the flat mounts were examined for neovascularization. Retinal vascularization is shown in the first column. Neovascularization is highlighted in red in the second column. The third column shows the selected rectangular areas of the images shown in the first column under 10X magnification. I & J. Retinal neovascularization (I) and avascular areas (J) were determined as described in “Materials and Methods.” The bar graphs represent quantitative analysis of 6 retinas. The values are presented as Mean ± SD. * p < 0.01 vs normoxia, normoxia + control siRNA; ** p < 0.01 vs hypoxia + control siRNA. Scale bar represents 50 μm and 20 μm in panel D, far left column and far right column, respectively, 20 μm in panels F & G and 300 μm and 50 μm in panel H, far left column and far right column, respectively.

Comment in

Similar articles

Cited by

References

    1. Abramovitch R., Tavor E., Jacob-Hirsch J., Zeira E., Amariglio N., Pappo O., Rechavi G., Galun E., Honigman A. A pivotal role of cyclic amp-responsive element binding protein in tumor progression. Cancer Res. 2004;64:1338–1346. - PubMed
    1. Achen M.G., Jeltsch M., Kukk E., Makinen T., Vitali A., Wilks A.F., Alitalo K., Stacker S.A. Vascular Endothelial Growth Factor D (VEGF-D) is a ligand for the tyrosine kinases VEGF receptor 2 (Flk1) and VEGF receptor 3 (Flt4) Proc. Natl. Acad. Sci. U. S. A. 1998;95:548–553. - PMC - PubMed
    1. Aiello L.P., Avery R.L., Arrigg P.G., Keyt B.A., Jampel H.D., Shah S.T., Pasquale L.R., Thieme H., Iwamoto M.A., Park J.E., Nguyen H.V., Aiello L.M., Ferrara N., King G.L. Vascular endothelial growth factor in ocular fluid of patients with diabetic retinopathy and other retinal disorders. N. Engl. J. Med. 1994;331:1480–1487. - PubMed
    1. Alon T., Hemo I., Itin A., Pe'er J., Stone J., Keshet E. Vascular endothelial growth factor acts as a survival factor for newly formed retinal vessels and has implications for retinopathy of prematurity. Nat. Med. 1995;1:1024–1028. - PubMed
    1. Andreoli C.M., Miller J.W. Anti-vascular endothelial growth factor therapy for ocular neovascular disease. Curr. Opin. Ophthalmol. 2007;18:502–508. - PubMed

Publication types

MeSH terms

Substances

LinkOut - more resources