. 2015 Nov 26:3:43-53.
doi: 10.1016/j.ebiom.2015.11.045. eCollection 2016 Jan.

Human Leukemic Cells performing Oxidative Phosphorylation (OXPHOS) Generate an Antioxidant Response Independently of Reactive Oxygen species (ROS) Production

Affiliations

Human Leukemic Cells performing Oxidative Phosphorylation (OXPHOS) Generate an Antioxidant Response Independently of Reactive Oxygen species (ROS) Production

Abrar Ul Haq Khan et al. EBioMedicine. .

Abstract

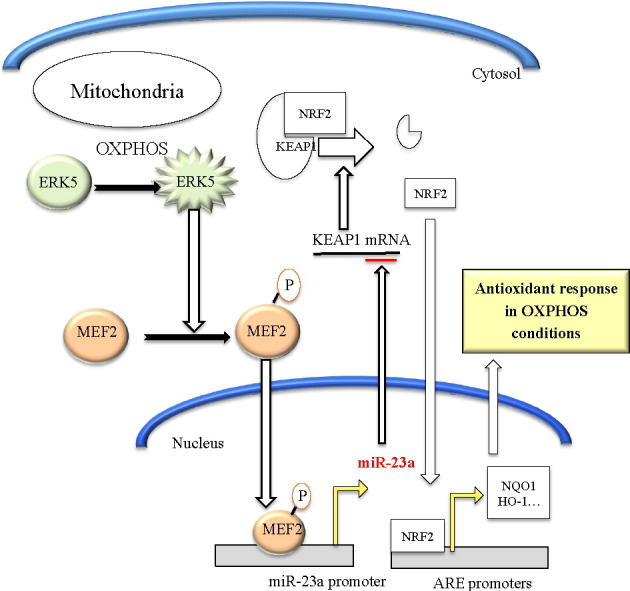
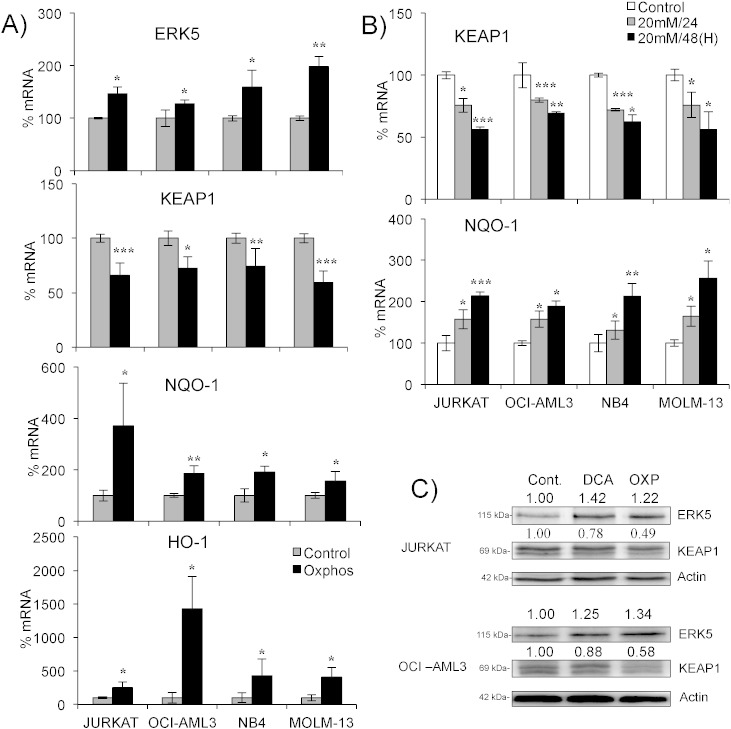
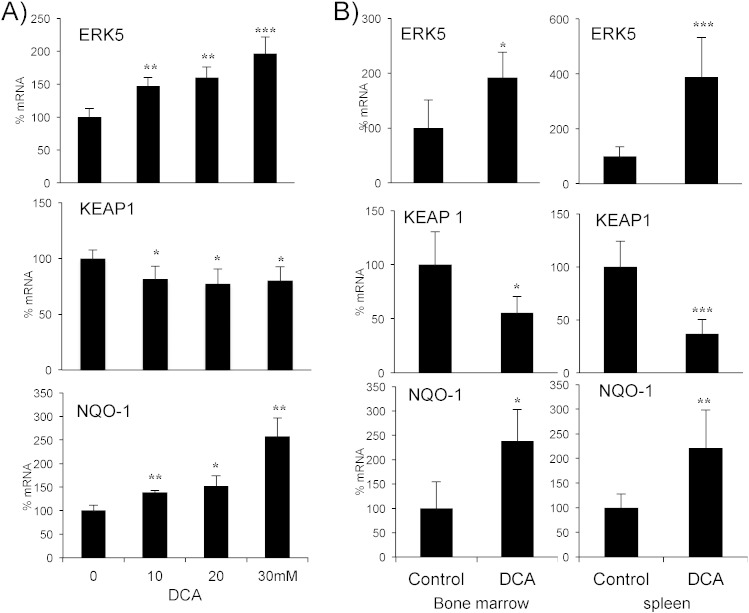
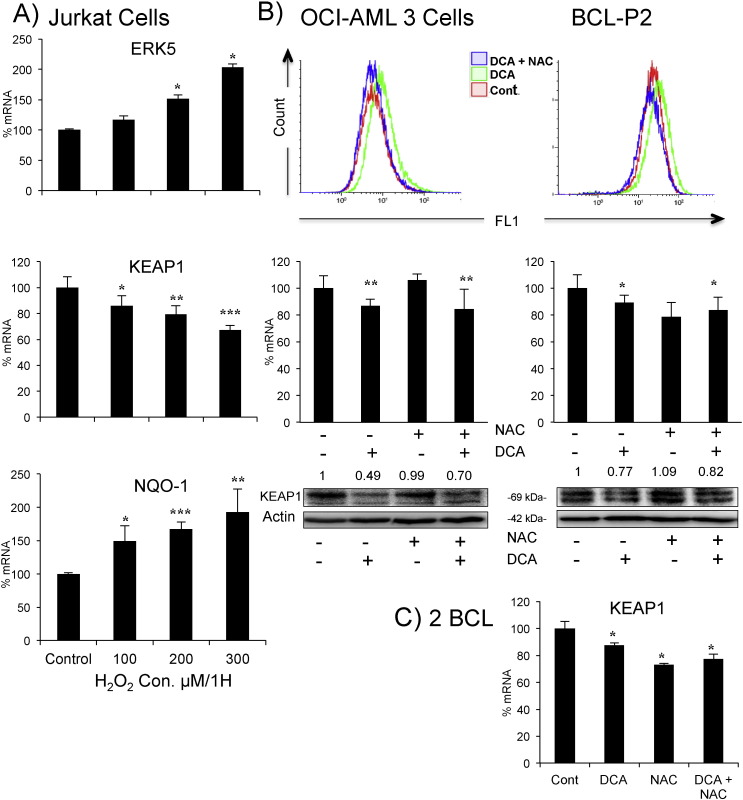
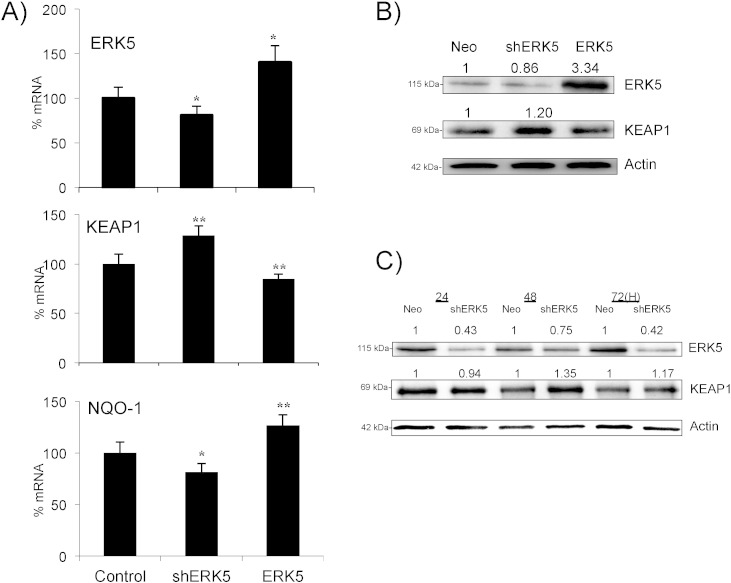
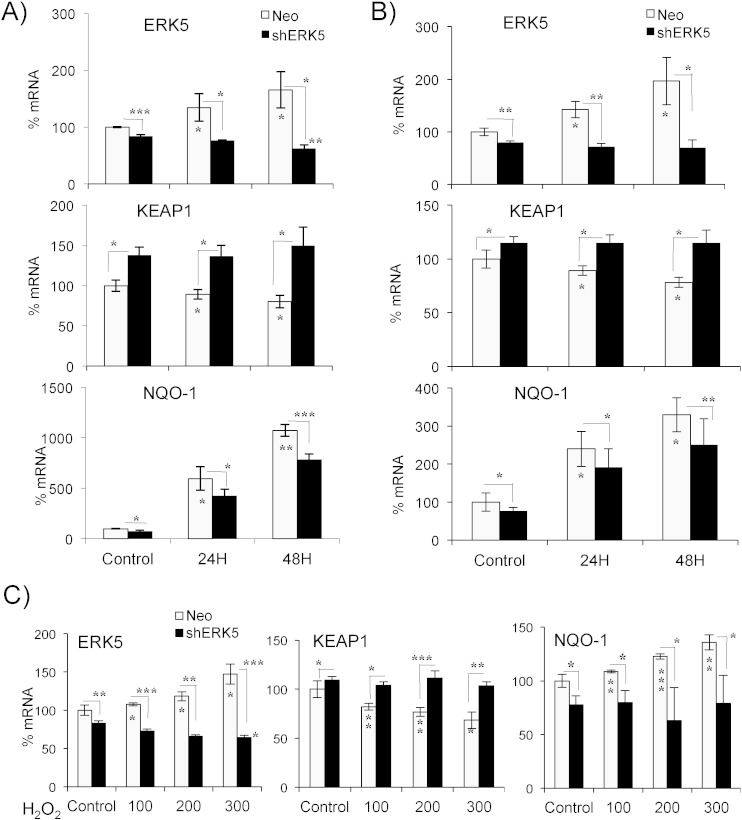
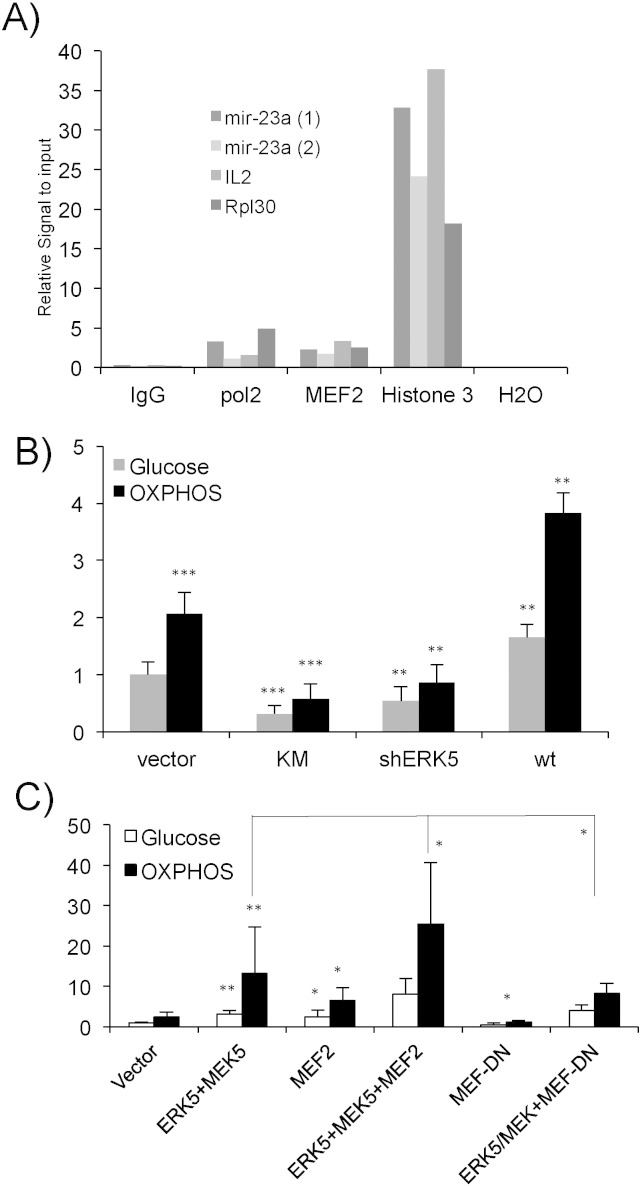
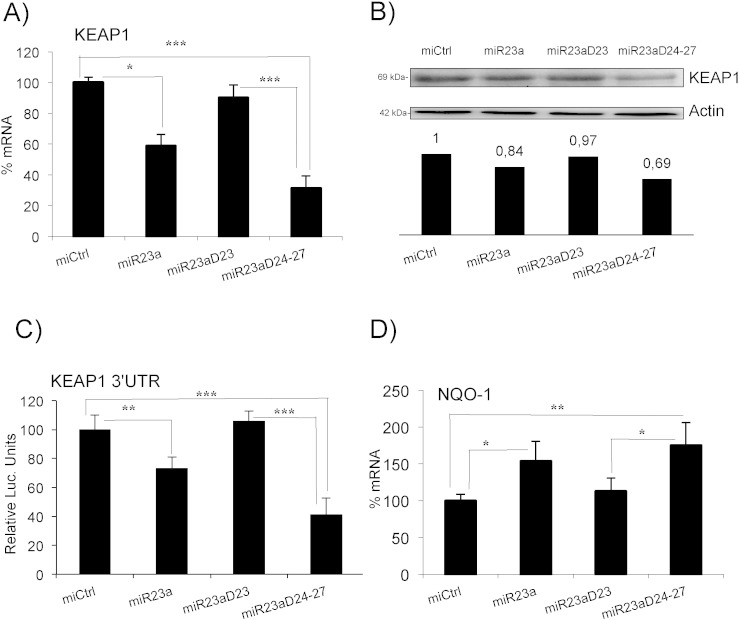
Tumor cell metabolism is altered during leukemogenesis. Cells performing oxidative phosphorylation (OXPHOS) generate reactive oxygen species (ROS) through mitochondrial activity. To limit the deleterious effects of excess ROS, certain gene promoters contain antioxidant response elements (ARE), e.g. the genes NQO-1 and HO-1. ROS induces conformational changes in KEAP1 and releases NRF2, which activates AREs. We show in vitro and in vivo that OXPHOS induces, both in primary leukemic cells and cell lines, de novo expression of NQO-1 and HO-1 and also the MAPK ERK5 and decreases KEAP1 mRNA. ERK5 activates the transcription factor MEF2, which binds to the promoter of the miR-23a-27a-24-2 cluster. Newly generated miR-23a destabilizes KEAP1 mRNA by binding to its 3'UTR. Lower KEAP1 levels increase the basal expression of the NRF2-dependent genes NQO-1 and HO-1. Hence, leukemic cells performing OXPHOS, independently of de novo ROS production, generate an antioxidant response to protect themselves from ROS.

Keywords: Antioxidant response elements (ARE); ERK5; MEF2; Mitochondria; Oxidative phosphorylation (OXPHOS); miR-23.


Figures

None
Graphical abstract
Fig. 1
Fig. 1
Different ROS production by cells performing OXPHOS. Different cell lines growing in glucose (control cells) were treated with H2O2 (100 μM) for 1 h or DCA (20 mM) for 12 h or were kept in OXPHOS medium for at least 1 month. Cells were labeled with CellROX® Deep Red Reagent and analyzed by FACs.
Fig. 2
Fig. 2
Cells performing OXPHOS activate an antioxidant response. A) Different cell lines were grown in OXPHOS medium for at least 1 month before mRNA extraction. mRNA expression was quantified by qPCR and represented as the % of mRNA compared to control cells. B) Cells were treated with 20 mM DCA for 24 and 48 h and KEAP1 and NQO1 mRNA levels were quantified by qPCR. C) The expression of different proteins was analyzed in cells growing in OXPHOS medium or treated with DCA as described above. The data represent means ± SD; *p < 0.05, **p < 0.01, ***p < 0.001 Student's t-test compared to control cells or as depicted in the graphic.
Fig. 3
Fig. 3
Cells performing OXPHOS activate an antioxidant response in vitro and in vivo in primary leukemic cells. A) Tumor cells from 4 hematological cancer patients (2 MM, 1 B-CLL and 1 T cell lymphoma) were treated with various concentrations of DCA for 24 h and mRNA was analyzed by qPCR. B) NSG mice were engrafted with primary human AML cells. At day 80 post-graft, they were treated with DCA (n = 4) or left untreated (n = 4). At day 140 mRNA from AML tumor cell from bone marrow or spleen was isolated and the expression of different proteins was quantified by qPCR. The data represent means ± SD; *p < 0.05, **p < 0.01, ***p < 0.001 Student's t-test compared to non treated cells or mice.
Fig. 4
Fig. 4
Increase in ROS levels is not essential for KEAP1 downregulation. A) Jurkat cells were treated with increasing concentrations of H2O2 for 1 h and mRNA expression was analyzed. B) OCI-AML3 cells (left) or primary tumor cells from a BCL patient (right) were treated with 1.5 mM NAC 1 h before adding DCA (20 mM) for 24 h. Cells were labeled with CH-H2DCFDA and analyzed by FACs for ROS production. Keap1 mRNA and protein were analyzed as described in Fig. 2. C) Primary tumor cells from 2 BCL patients were treated as in (B) before analyzing KEAP1 mRNA expression, results represent the means ± SD of these two patients in triplicate. The data represent means ± SD; *p < 0.05, **p < 0.01, ***p < 0.001 Student's t-test compared to non-transfected cells.
Fig. 5
Fig. 5
ERK5 controls Keap1 mRNA expression. A) 107 Jurkat-TAg cells were transfected with 5 μg of the empty pcDNA vector, ERK5 or a pSUPER Neo vector containing a small hairpin RNA for ERK5 (shERK5). Forty-eight hours later mRNA expression was analyzed by qPCR and presented as the % of mRNA compared to cells transfected with the control vector. B) Protein expression of cells transfected in (A). C) 107 Jurkat-TAg cells were transfected with 5 μg of the empty pSUPER Neo vector or with the vector encoding for the shERK5. Protein expression was analyzed by WB at different times after transfection. The data represent means ± SD; *p < 0.05, **p < 0.01, ***p < 0.001 Student's t-test compared to empty vector transfected cells (control).
Fig. 6
Fig. 6
ERK5 enables NRF2-mediated antioxidant response in cells performing OXPHOS. 107 Jurkat-TAg cells were transfected with 5 μg of the empty pcDNA vector or shERK5 as described in Fig. 4. A) Transfected cells were placed on glucose or OXPHOS media after 24 h and left for the indicated times before mRNA expression was analyzed by qPCR. B) Cells were prepared as in (A), kept in glucose and treated with 20 mM DCA before mRNA analysis. C) Cells prepared as in (B) but they were treated with different concentrations of H2O2 for 1 h before analyzing mRNA. The data represent means ± SD; *p < 0.05, **p < 0.01, ***p < 0.001 Student's t-test compared to non-treated cells or to empty vector transfected cells when depicted in the graphic.
Fig. 7
Fig. 7
The ERK5/MEF2 pathway regulates expression of the miR-23a–27a–24-2 locus. A) 40 × 107 Jurkat cells growing in glucose were used to perform ChIP analysis using antibodies against proteins depicted on the x-axis. Two different miR23a promoter oligonucleotides were used to study MEF2 binding to the promoter. IL-2 and Rpl30 promoters were used as a control. B-C) 107 Jurkat-TAg cells were co-transfected with 5 μg of the following vectors shERK5, ERK5 wild type (wt) and ERK5 K/M (KM) together with 2 μg of a luciferase reporter plasmid driven by the promoter of the miR-23a–27a–24-2 locus along with 1 μg of β-galactosidase expression vector. Cells were incubated in glucose (gray bars) or OXPHOS (black bars) media 16 h after transfection and analyzed 2 days later for luciferase and β-galactosidase activities. The graphic represents the relative luciferase units (RLU). C) Cells were transfected and treated as in (B) but we additionally used 5 μg of a constitutively active MEK5 mutant (MEK5D), MEF2C and MEF2 with dominant negative function MEF2-DN. Experiments in panels (B) and (C) were done in parallel but the scale is different to visualize differences in (B). The data represent means ± SD; *p < 0.05, **p < 0.01, ***p < 0.001 Student's t-test compared to empty vector transfected cells or as depicted in the graphic.
Fig. 8
Fig. 8
miR-23a targets KEAP1 mRNA. A) Jurkat cells were transfected with the whole miR-23a–27a–24-2 locus or with the constructs miR-23 ∆ 24–27 and miR-23 ∆ 23. The expression of KEAP1 mRNA was analyzed by qPCR and represented as the % of mRNA compared to cells transfected with the control vector. B) Expression of KEAP1 protein and the quantification. C) Jurkat cells were transfected with the different constructs together with a reporter plasmid containing the 3′UTR of KEAP1 mRNA downstream of the luciferase mRNA. Data are represented as the % of luciferase expression in cells transfected with the empty vector. D) The expression of NQO-1 mRNA was analyzed by qPCR in cells transfected as in (A). The data represent means ± SD; *p < 0.05, **p < 0.01, ***p < 0.001 Student's t-test compared to empty vector transfected cells or as depicted in the graphic.

Comment in

Similar articles

Cited by

References

    1. Abdul-Aziz A., MacEwan D.J., Bowles K.M., Rushworth S.A. Oxidative stress responses and NRF2 in human leukaemia. Oxidative Med. Cell. Longev. 2015;2015:454659. - PMC - PubMed
    1. Allende-Vega N., Krzywinska E., Orecchioni S., Lopez-Royuela N., Reggiani F., Talarico G., Rossi J.F., Rossignol R., Hicheri Y., Cartron G., Bertolini F., Villalba M. The presence of wild type p53 in hematological cancers improves the efficacy of combinational therapy targeting metabolism. Oncotarget. 2015;6:19228–19245. - PMC - PubMed
    1. Bellance N., Lestienne P., Rossignol R. Mitochondria: from bioenergetics to the metabolic regulation of carcinogenesis. Front. Biosci. 2009;14:4015–4034. - PubMed
    1. Catalán E., Charni S., Aguiló J.-I., Enríquez J.-A., Naval J., Pardo J., Villalba M., Anel A. MHC-I modulation due to metabolic changes regulates tumor sensitivity to CTL and NK cells. Oncoimmunology. 2015;4 - PMC - PubMed
    1. Charni S., Aguilo J.I., Garaude J., De Bettignies G., Jacquet C., Hipskind R.A., Singer D., Anel A., Villalba M. ERK5 knockdown generates mouse leukemia cells with low MHC class I levels that activate NK cells and block tumorigenesis. J. Immunol. 2009;182:3398–3405. - PMC - PubMed

Publication types

MeSH terms