

Small Molecule Inhibitors of BAF; A Promising Family of Compounds in HIV-1 Latency Reversal
- PMID: 26870822
- PMCID: PMC4739437
- DOI: 10.1016/j.ebiom.2015.11.047
Small Molecule Inhibitors of BAF; A Promising Family of Compounds in HIV-1 Latency Reversal
Abstract
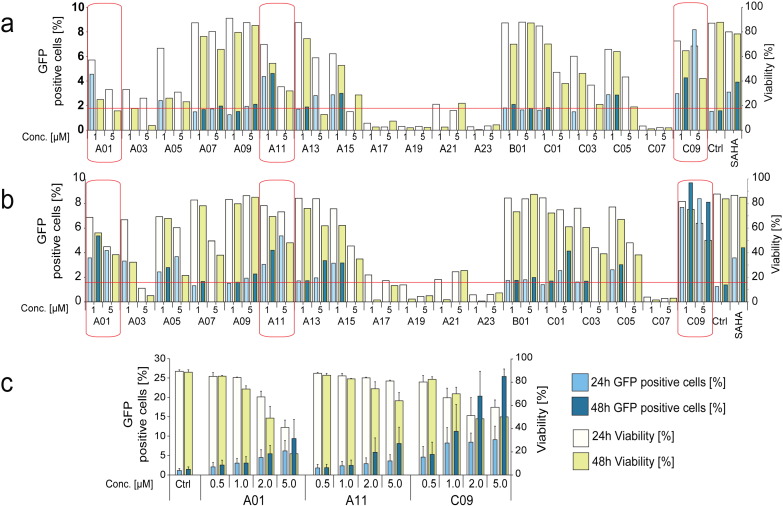
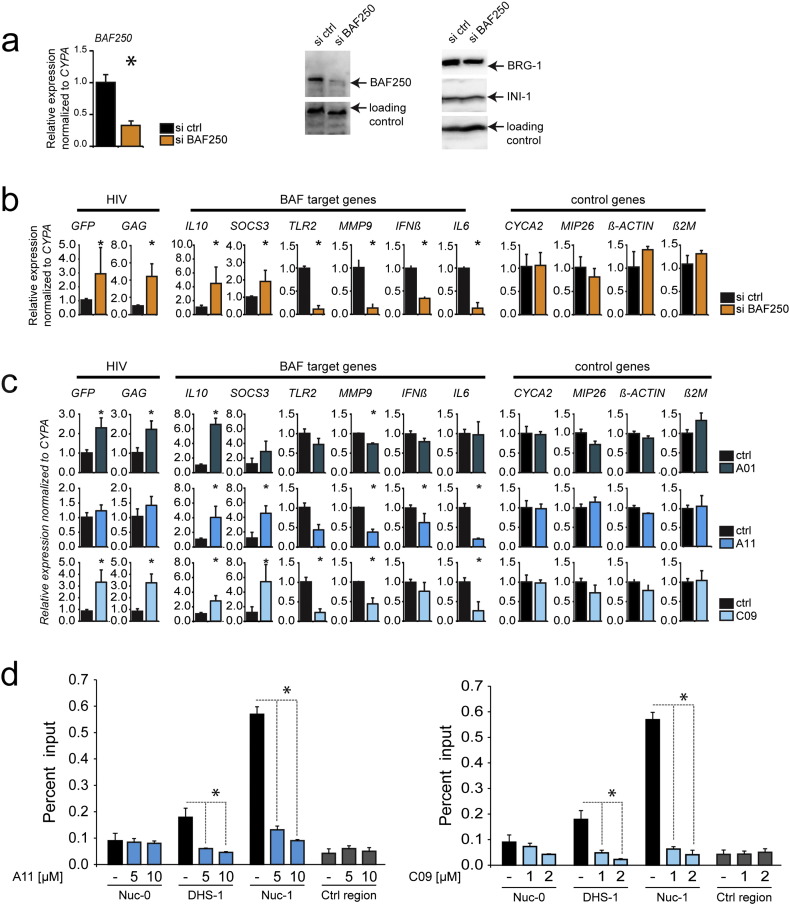
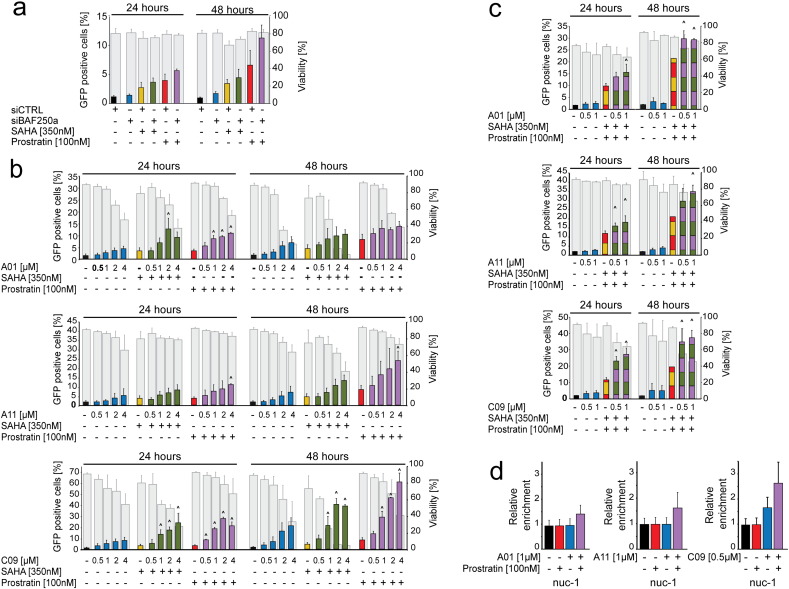
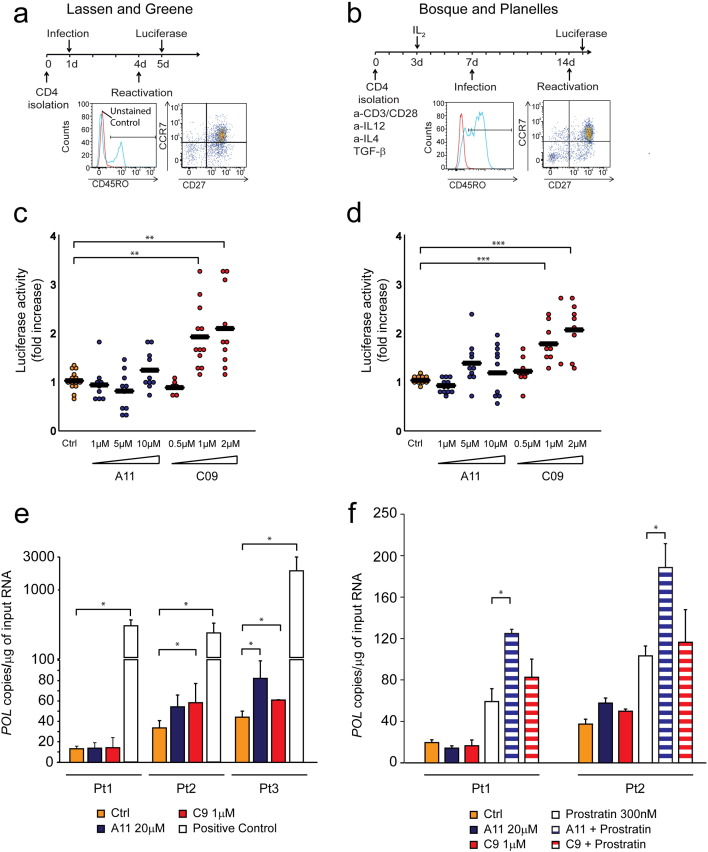
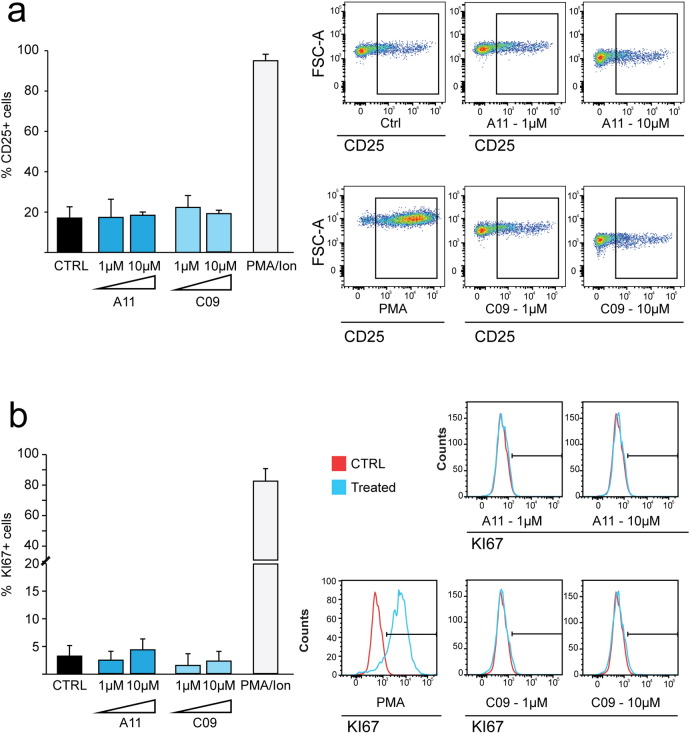
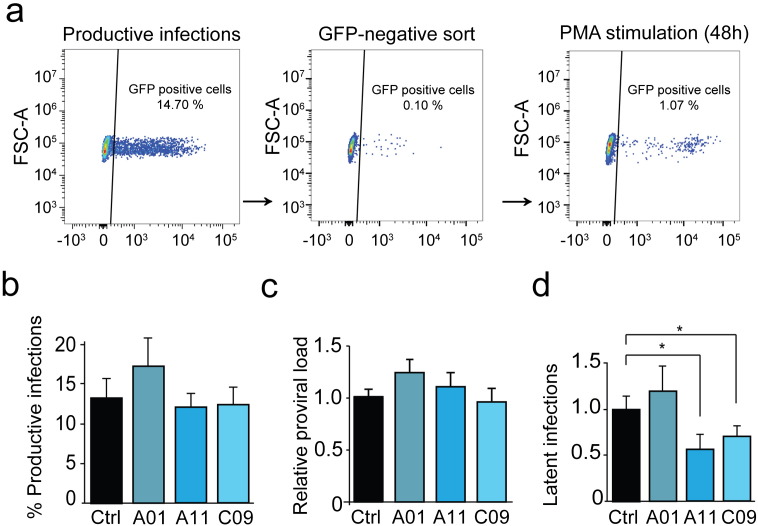
Persistence of latently infected cells in presence of Anti-Retroviral Therapy presents the main obstacle to HIV-1 eradication. Much effort is thus placed on identification of compounds capable of HIV-1 latency reversal in order to render infected cells susceptible to viral cytopathic effects and immune clearance. We identified the BAF chromatin remodeling complex as a key player required for maintenance of HIV-1 latency, highlighting its potential as a molecular target for inhibition in latency reversal. Here, we screened a recently identified panel of small molecule inhibitors of BAF (BAFi's) for potential to activate latent HIV-1. Latency reversal was strongly induced by BAFi's Caffeic Acid Phenethyl Ester and Pyrimethamine, two molecules previously characterized for clinical application. BAFi's reversed HIV-1 latency in cell line based latency models, in two ex vivo infected primary cell models of latency, as well as in HIV-1 infected patient's CD4 + T cells, without inducing T cell proliferation or activation. BAFi-induced HIV-1 latency reversal was synergistically enhanced upon PKC pathway activation and HDAC-inhibition. Therefore BAFi's constitute a promising family of molecules for inclusion in therapeutic combinatorial HIV-1 latency reversal.
Keywords: BAF complex; BAF, BRG-Brahma Associated Factors; BAF250a, BAF Associated Factor 250 a; BAFi, BAF inhibitor; BRG-1, Brahma Related Gene 1; CAPE, caffeic acid phenetyl esther; ChIP, Chromatin Immunoprecipitation; Chromatin remodeling; CycA, Cyclophilin A; DHS-1, DNase Hypersensitive Site 1; ES cells, embryonic stem cells; FAIRE, Formaldehyde Assisted Isolation of Regulatory Elements; FBS, Fetal Bovine Serum; GFP, Green Fluorescent Protein; HDAC, histone deacetylase; HIV; HIV-1, human immunodeficiency virus type 1; IFNß, Interferon beta; IL10, Interleukin 10; IL12, Interleukin 12; IL4, Interleukin 4; IL6, Interleukin 6; INI-1, Integrase Interactor 1; IRES, Internal Ribosome Entry Site; IκB-α, Inhibitor of NF-κB – alpha; LRA, latency reversal agent; LTR, Long Terminal Repeat; Latency; MIP26, Major Intrinsic Protein; MMP9, Matrix Metallopeptidase 9; NF-κB, Nuclear Factor Kappa-light-chain-enhancer of activated B cells; PBMC, peripheral blood mononuclear cell; PBS, Phosphate Buffered Saline; PKC, Protein Kinase C; PYR, Pyrimethamine; RT-qPCR, Reverse Transcriptase, quantitative Polymerase Chain Reaction; SAHA, Suberoylanilide Hydroxamic Acid; SD, Standard Deviation; SOCS3, Suppressor Of Cytokine Signaling 3; TGF-ß, Transforming Growth Factor beta; TLR2, Toll-like Receptor 2; bp, base pairs; cART, combination Antiretroviral Therapy; latency reversal agents; nuc, nucleosome; siRNA, small interfering RNA.
Figures
Similar articles
-
Alternate NF-κB-Independent Signaling Reactivation of Latent HIV-1 Provirus.J Virol. 2019 Aug 28;93(18):e00495-19. doi: 10.1128/JVI.00495-19. Print 2019 Sep 15. J Virol. 2019. PMID: 31243131 Free PMC article.
-
Repressive LTR nucleosome positioning by the BAF complex is required for HIV latency.PLoS Biol. 2011 Nov;9(11):e1001206. doi: 10.1371/journal.pbio.1001206. Epub 2011 Nov 29. PLoS Biol. 2011. PMID: 22140357 Free PMC article.
-
A Two-Color Haploid Genetic Screen Identifies Novel Host Factors Involved in HIV-1 Latency.mBio. 2021 Dec 21;12(6):e0298021. doi: 10.1128/mBio.02980-21. Epub 2021 Dec 7. mBio. 2021. PMID: 34872356 Free PMC article.
-
The role of latency reversal agents in the cure of HIV: A review of current data.Immunol Lett. 2018 Apr;196:135-139. doi: 10.1016/j.imlet.2018.02.004. Epub 2018 Feb 7. Immunol Lett. 2018. PMID: 29427743 Review.
-
CXCR4 Targeting Nanoplatform for Transcriptional Activation of Latent HIV-1 Infected T Cells.ACS Appl Bio Mater. 2024 Aug 19;7(8):4831-4842. doi: 10.1021/acsabm.3c00456. Epub 2023 Aug 16. ACS Appl Bio Mater. 2024. PMID: 37586084 Review.
Cited by
-
Diversity of small molecule HIV-1 latency reversing agents identified in low- and high-throughput small molecule screens.Med Res Rev. 2020 May;40(3):881-908. doi: 10.1002/med.21638. Epub 2019 Oct 13. Med Res Rev. 2020. PMID: 31608481 Free PMC article. Review.
-
A New Quinoline BRD4 Inhibitor Targets a Distinct Latent HIV-1 Reservoir for Reactivation from Other "Shock" Drugs.J Virol. 2018 Apr 27;92(10):e02056-17. doi: 10.1128/JVI.02056-17. Print 2018 May 15. J Virol. 2018. PMID: 29343578 Free PMC article.
-
Small Molecule Targeting of Specific BAF (mSWI/SNF) Complexes for HIV Latency Reversal.Cell Chem Biol. 2018 Dec 20;25(12):1443-1455.e14. doi: 10.1016/j.chembiol.2018.08.004. Epub 2018 Sep 6. Cell Chem Biol. 2018. PMID: 30197195 Free PMC article.
-
Tat inhibition by didehydro-Cortistatin A promotes heterochromatin formation at the HIV-1 long terminal repeat.Epigenetics Chromatin. 2019 Apr 16;12(1):23. doi: 10.1186/s13072-019-0267-8. Epigenetics Chromatin. 2019. PMID: 30992052 Free PMC article.
-
A 3D organoid platform that supports liver-stage P.falciparum infection can be used to identify intrahepatic antimalarial drugs.Heliyon. 2024 May 8;10(10):e30740. doi: 10.1016/j.heliyon.2024.e30740. eCollection 2024 May 30. Heliyon. 2024. PMID: 38770342 Free PMC article.
References
-
- Archin N.M., Liberty A.L., Kashuba A.D., Choudhary S.K., Kuruc J.D., Crooks A.M., Parker D.C., Anderson E.M., Kearney M.F., Strain M.C., Richman D.D., Hudgens M.G., Bosch R.J., Coffin J.M., Eron J.J., Hazuda D.J., Margolis D.M. Administration of vorinostat disrupts HIV-1 latency in patients on antiretroviral therapy. Nature. 2012;487:482–485. - PMC - PubMed
-
- Archin N.M., Bateson R., Tripathy M.K., Crooks A.M., Yang K.H., Dahl N.P., Kearney M.F., Anderson E.M., Coffin J.M., Strain M.C., Richman D.D., Robertson K.R., Kashuba A.D., Bosch R.J., Hazuda D.J., Kuruc J.D., Eron J.J., Margolis D.M. HIV-1 expression within resting CD4 + T cells after multiple doses of vorinostat. J. Infect. Dis. 2014;210:728–735. - PMC - PubMed
Publication types
MeSH terms
Substances
LinkOut - more resources
Full Text Sources
Other Literature Sources
Research Materials
Miscellaneous
