

Allergy associations with the adult fecal microbiota: Analysis of the American Gut Project
- PMID: 26870828
- PMCID: PMC4739432
- DOI: 10.1016/j.ebiom.2015.11.038
Allergy associations with the adult fecal microbiota: Analysis of the American Gut Project
Abstract
Background: Alteration of the gut microbial population (dysbiosis) may increase the risk for allergies and other conditions. This study sought to clarify the relationship of dysbiosis with allergies in adults.
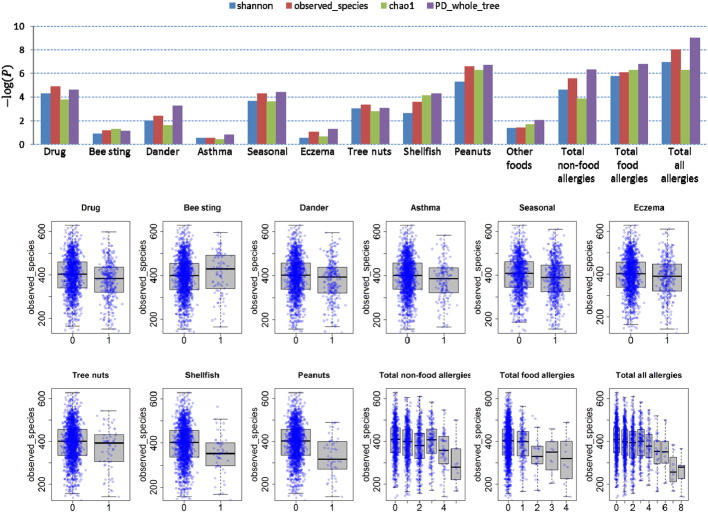
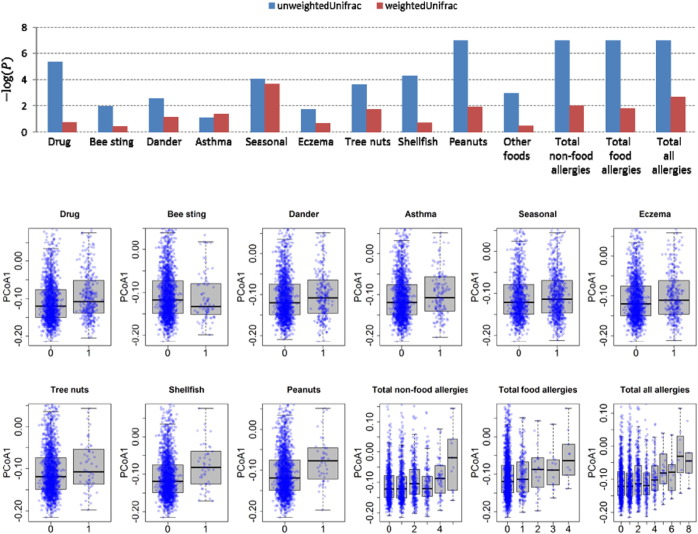
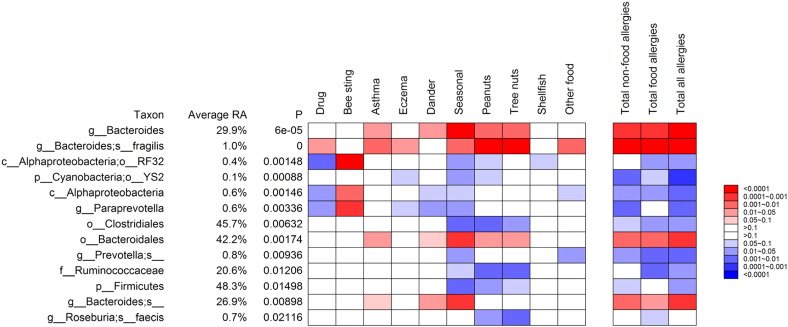
Methods: Publicly available American Gut Project questionnaire and fecal 16S rRNA sequence data were analyzed. Fecal microbiota richness (number of observed species) and composition (UniFrac) were used to compare adults with versus without allergy to foods (peanuts, tree nuts, shellfish, other) and non-foods (drug, bee sting, dander, asthma, seasonal, eczema). Logistic and Poisson regression models adjusted for potential confounders. Odds ratios and 95% confidence intervals (CI) were calculated for lowest vs highest richness tertile. Taxonomy associations considered 122 non-redundant taxa (of 2379 total taxa) with ≥ 0.1% mean abundance.
Results: Self-reported allergy prevalence among the 1879 participants (mean age, 45.5 years; 46.9% male) was 81.5%, ranging from 2.5% for peanuts to 40.5% for seasonal. Fecal microbiota richness was markedly lower with total allergies (P = 10(-9)) and five particular allergies (P ≤ 10(-4)). Richness odds ratios were 1.7 (CI 1.3-2.2) with seasonal, 1.8 (CI 1.3-2.5) with drug, and 7.8 (CI 2.3-26.5) with peanut allergy. These allergic participants also had markedly altered microbial community composition (unweighted UniFrac, P = 10(-4) to 10(-7)). Total food and non-food allergies were significantly associated with 7 and 9 altered taxa, respectively. The dysbiosis was most marked with nut and seasonal allergies, driven by higher Bacteroidales and reduced Clostridiales taxa.
Interpretation: American adults with allergies, especially to nuts and seasonal pollen, have low diversity, reduced Clostridiales, and increased Bacteroidales in their gut microbiota. This dysbiosis might be targeted to improve treatment or prevention of allergy.
Keywords: 16S rRNA, 16S ribosomal RNA; AGP, American Gut Project; Adults; Allergy; FDR, false discovery rate; Feces; Human microbiome; Hygiene hypothesis; MiRKAT, Microbiome Regression-based Kernel Association Test; NHANES, National Health And Examination Survey; PCoA, principal coordinate analysis; PD, phylogenetic diversity; QIIME, Quantitative Insights Into Microbial Ecology; RA, relative abundance.
Figures
Comment in
-
Allergy Associations with the Adult Fecal Microbiota: Cause, Effect or Biomarker?EBioMedicine. 2015 Nov 28;3:15-16. doi: 10.1016/j.ebiom.2015.11.051. eCollection 2016 Jan. EBioMedicine. 2015. PMID: 26870814 Free PMC article. No abstract available.
References
-
- Abrahamsson T.R., Jakobsson H.E., Andersson A.F., Bjorksten B., Engstrand L., Jenmalm M.C. Low diversity of the gut microbiota in infants with atopic eczema. J. Allergy Clin. Immunol. 2012;129:434–440. (440 e431-432) - PubMed
-
- Abrahamsson T.R., Jakobsson H.E., Andersson A.F., Bjorksten B., Engstrand L., Jenmalm M.C. Low gut Microbiota diversity in early infancy precedes asthma at school age. Clin. Exp. Allergy. 2014;44:842–850. - PubMed
-
- Birnbaum J., Vervloet D., Charpin D. Atopy and systemic reactions to hymenoptera stings. Allergy Proc. 1994;15:49–52. - PubMed
-
- Bisgaard H., Li N., Bonnelykke K., Chawes B.L., Skov T., Paludan-Muller G., Stokholm J., Smith B., Krogfelt K.A. Reduced diversity of the intestinal microbiota during infancy is associated with increased risk of allergic disease at school age. J. Allergy Clin. Immunol. 2011;128:646–652. (e641-645) - PubMed
Publication types
MeSH terms
Substances
Grants and funding
LinkOut - more resources
Full Text Sources
Other Literature Sources
Medical
Research Materials
